| Param | Original file | Final file |
|---|---|---|
| Filename | modeM0/AS1G08_062T01_9000001660_11336cztM0_level2.evt | modeM0/AS1G08_062T01_9000001660_11336cztM0_level2_quad_clean.evt |
| Size (bytes) | 674,213,760 | 77,912,640 |
| Size | 643.0 MB | 74.3 MB |
| Events in quadrant A | 4,072,831 | 495,149 |
| Events in quadrant B | 4,798,973 | 474,149 |
| Events in quadrant C | 3,244,468 | 502,398 |
| Events in quadrant D | 7,818,594 | 389,470 |
| Mode M0 | |||
|---|---|---|---|
| Quadrant | BADHDUFLAG | Total packets | Discarded packets |
| A | 0 | 16757 | 3 |
| B | 0 | 19120 | 2 |
| C | 0 | 14669 | 2 |
| D | 0 | 28172 | 2 |
| Mode SS | |||
|---|---|---|---|
| Quadrant | BADHDUFLAG | Total packets | Discarded packets |
| A | 0 | 144 | 0 |
| B | 0 | 144 | 0 |
| C | 0 | 144 | 0 |
| D | 0 | 144 | 0 |
| Mode M9 | |||
|---|---|---|---|
| Quadrant | BADHDUFLAG | Total packets | Discarded packets |
| A | 0 | 9 | 0 |
| B | 0 | 9 | 0 |
| C | 0 | 9 | 0 |
| D | 0 | 10 | 0 |
| Quadrant | Total seconds | Saturated seconds | Saturation percentage |
|---|---|---|---|
| A | 7143 | 144 | 2.015960% |
| B | 7143 | 543 | 7.601848% |
| C | 7143 | 47 | 0.657987% |
| D | 7143 | 1738 | 24.331513% |
Noise dominated data is calculated using 1-second bins in cleaned event files. If a bin has >2000 counts, and if more than 50% of those come from <1% of pixels, then it is considered to be noise-dominated and hence unusable.
| Quadrant | # 1 sec bins | Bins with >0 counts | Bins with >2000 counts | High rate bins dominated by noise | Noise dominated (total time) | Noise dominated (detector-on time) | Marked lightcurve |
|---|---|---|---|---|---|---|---|
| A | 7743 | 7144 | 30 | 30 | 0.39% | 0.42% | 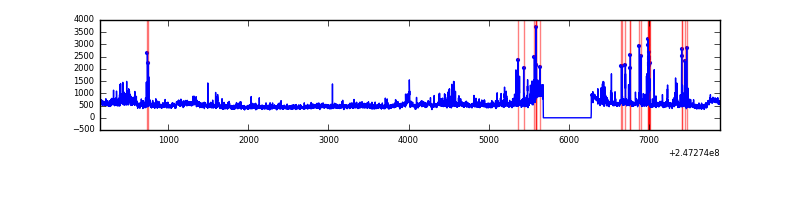 |
| B | 7743 | 7144 | 271 | 271 | 3.50% | 3.79% | 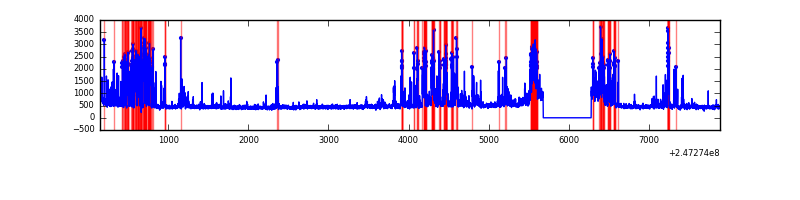 |
| C | 7743 | 7144 | 2 | 2 | 0.03% | 0.03% |  |
| D | 7743 | 7144 | 1411 | 1411 | 18.22% | 19.75% | 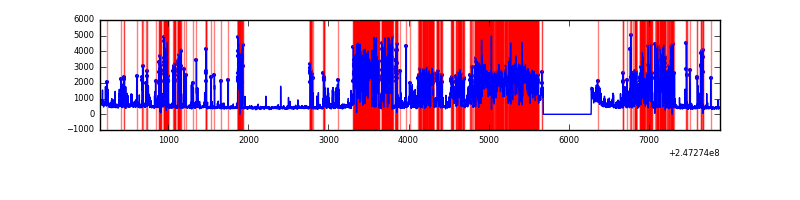 |
Top three noisy pixels from each quadrant. If the there are fewer than three noisy pixels in the level2.evt file, extra rows are filled as -1
| Pixel properties | Quadrant properties | ||||||
|---|---|---|---|---|---|---|---|
| Quadrant | DetID | PixID | Counts | Sigma | Mean | Median | Sigma |
| A | 13 | 251 | 496529 | 2902.33 | 836 | 819 | 170.8 |
| A | 15 | 174 | 217207 | 1266.93 | 836 | 819 | 170.8 |
| A | 1 | 162 | 38086 | 218.19 | 836 | 819 | 170.8 |
| B | 4 | 239 | 1284199 | 8209.98 | 817 | 796 | 156.3 |
| B | 3 | 64 | 219392 | 1398.37 | 817 | 796 | 156.3 |
| B | 3 | 189 | 37313 | 233.6 | 817 | 796 | 156.3 |
| C | 14 | 234 | 22820 | 114.41 | 826 | 828 | 192.2 |
| C | 13 | 61 | 6041 | 27.12 | 826 | 828 | 192.2 |
| C | 12 | 4 | 3005 | 11.33 | 826 | 828 | 192.2 |
| D | 1 | 52 | 3605435 | 20424.49 | 722 | 700 | 176.5 |
| D | 10 | 253 | 972188 | 5504.47 | 722 | 700 | 176.5 |
| D | 2 | 120 | 215163 | 1215.15 | 722 | 700 | 176.5 |
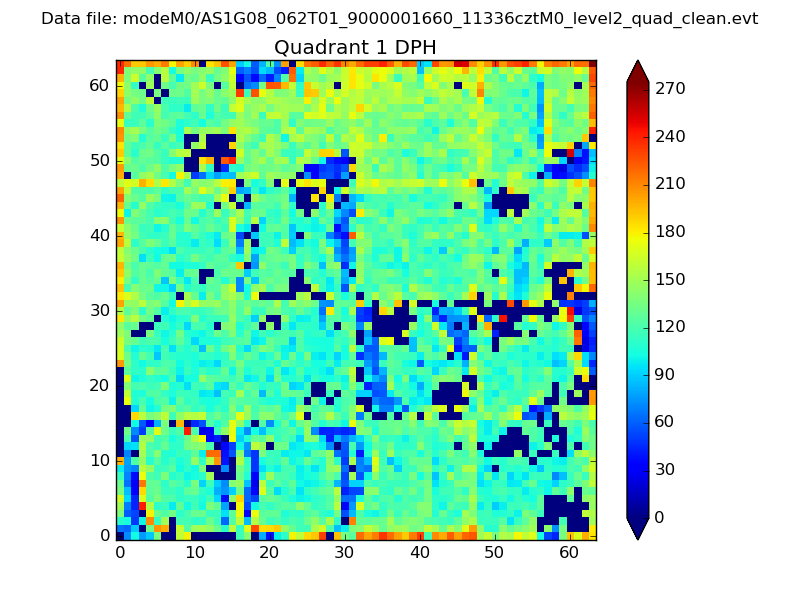
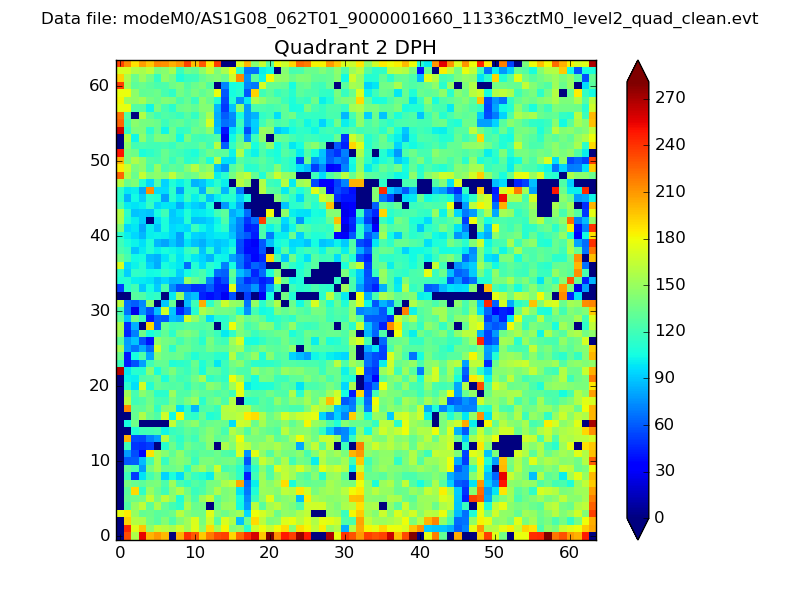
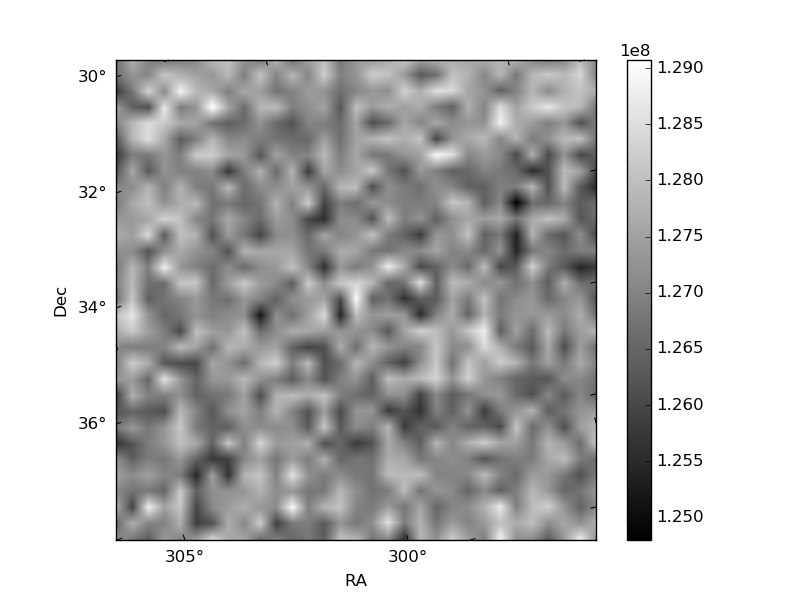
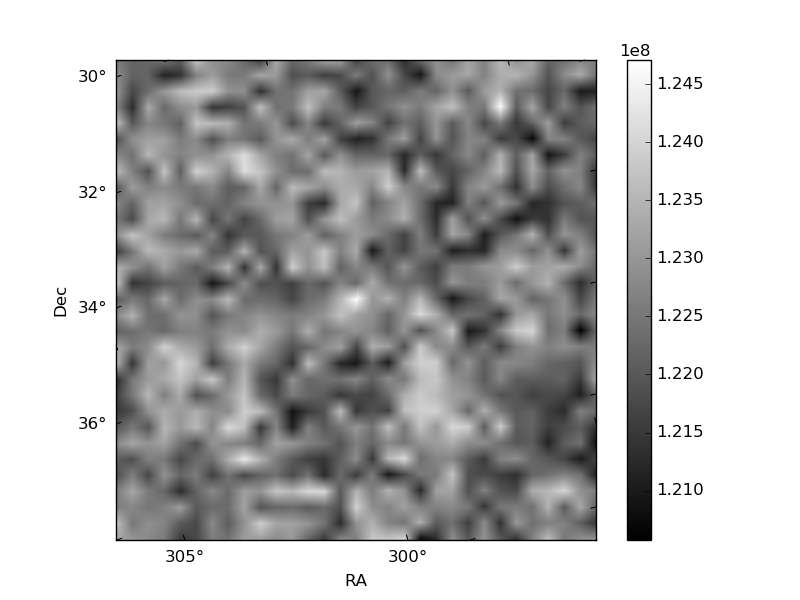
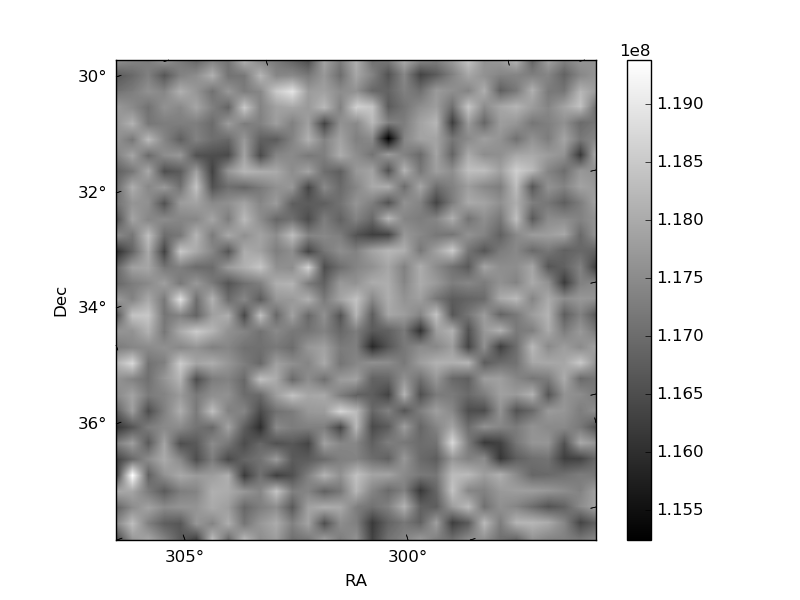
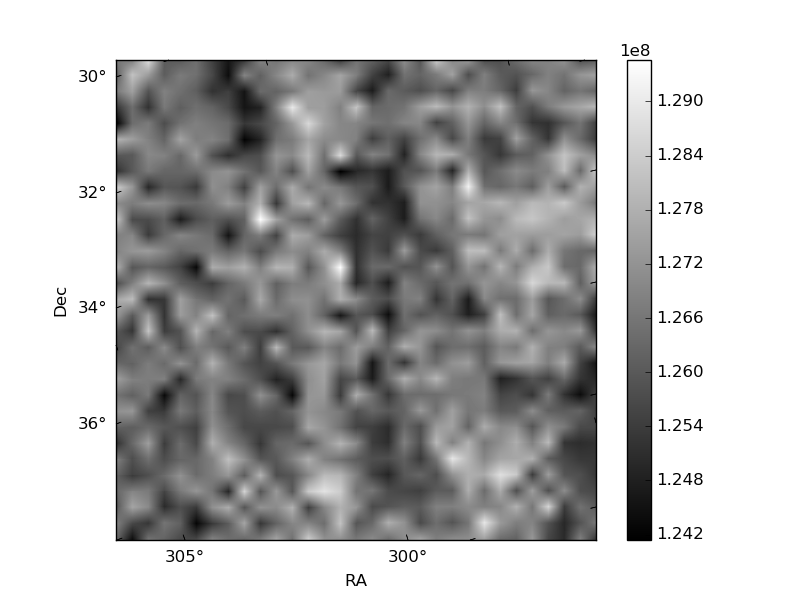
Histogram calculated using DETX and DETY for each event in the final _common_clean file
| Quadrant A | 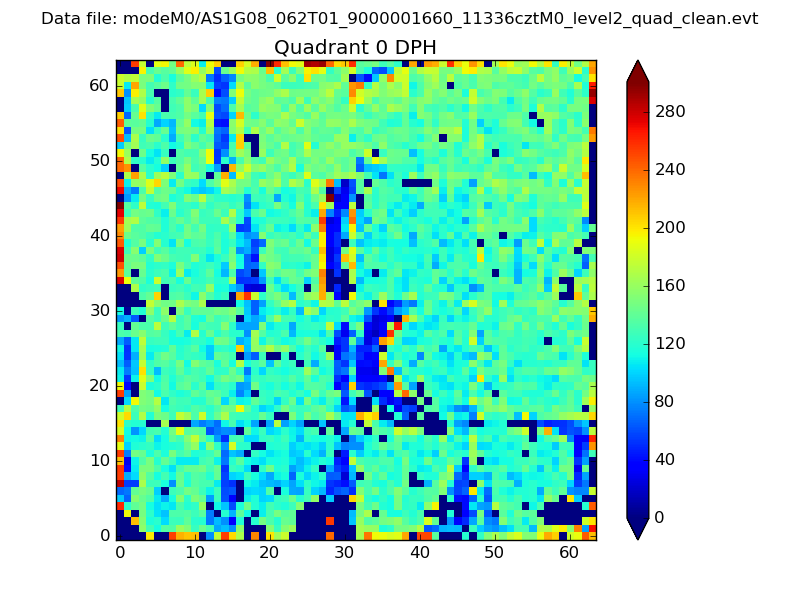 |
 |
Quadrant B |
|---|---|---|---|
| Quadrant D | 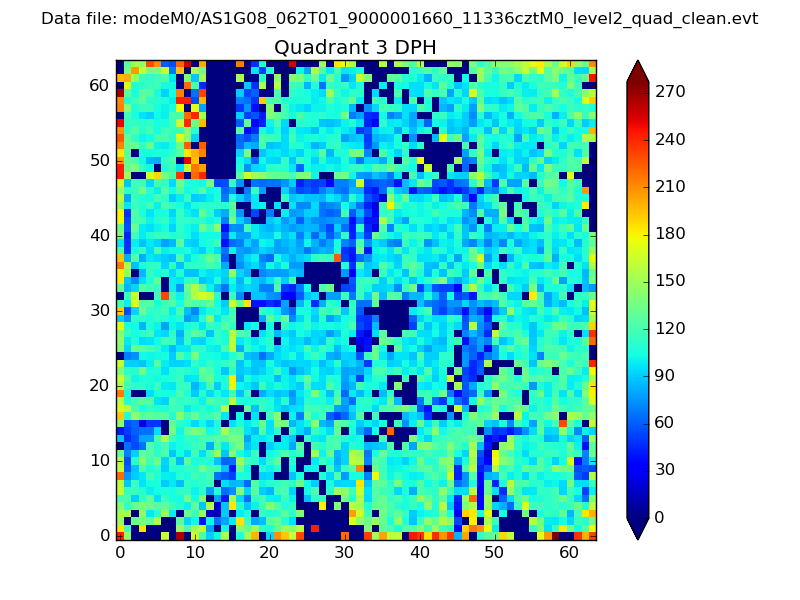 |
 |
Quadrant C |
| Plot type | Count rate plots | Images |
|---|---|---|
| Comparison with Poisson distribution Blue bars denote a histogram of data divided into 1 sec bins. Red curve is a Poisson curve with rate = median count rate of data. |
 |
 |
| Quadrant-wise count rates Data is divided into 100 sec bins |
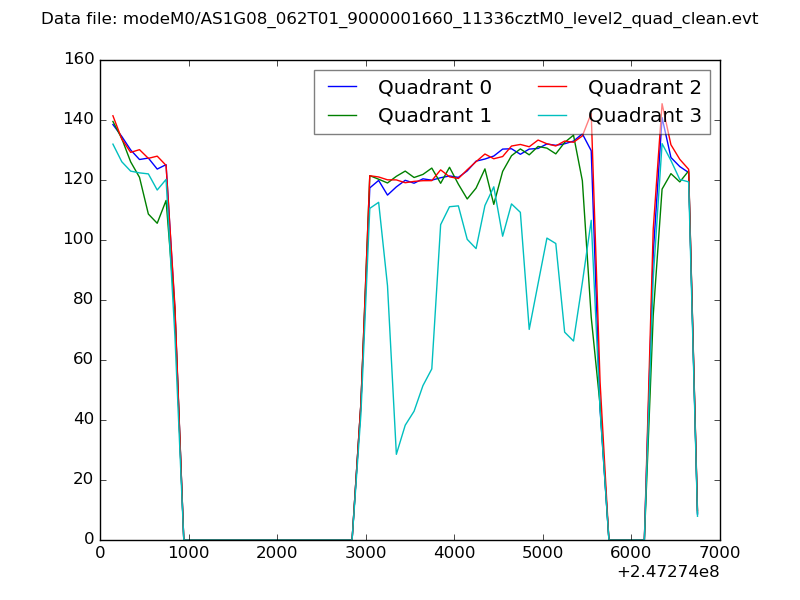 |
|
| Module-wise count rates for Quadrant A Data is divided into 100 sec bins |
 |
 |
| Module-wise count rates for Quadrant B Data is divided into 100 sec bins |
 |
 |
| Module-wise count rates for Quadrant C Data is divided into 100 sec bins |
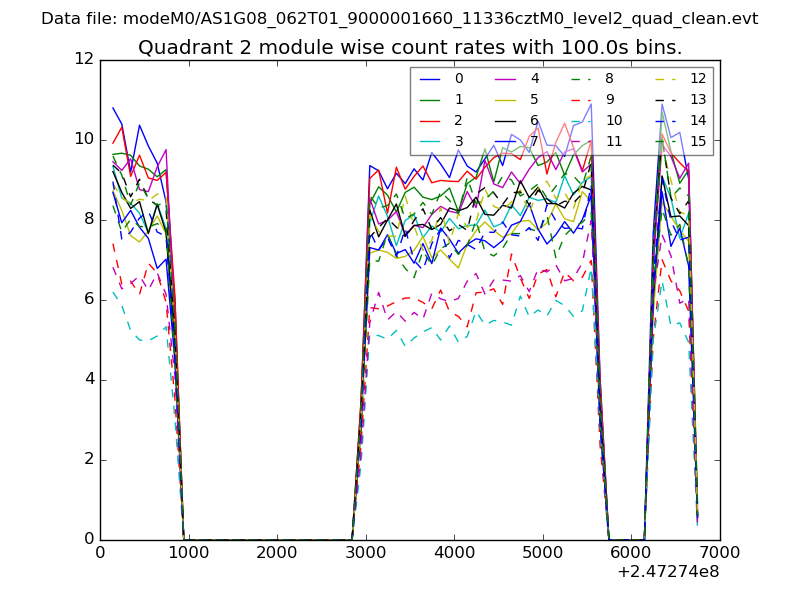 |
 |
| Module-wise count rates for Quadrant D Data is divided into 100 sec bins |
 |
 |
| Parameter | Plot |
|---|---|
| CZT HV Monitor |  |
| D_VDD | 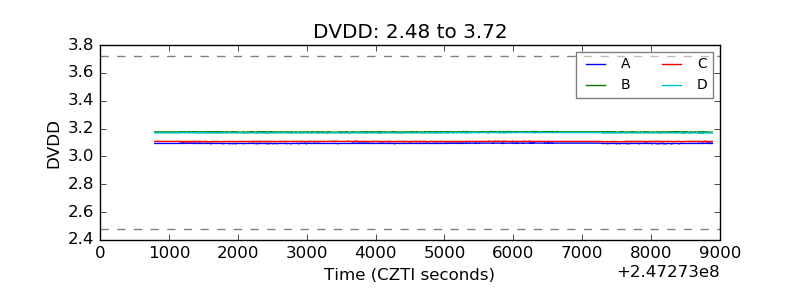 |
| Temperature 1 |  |
| Veto HV Monitor | 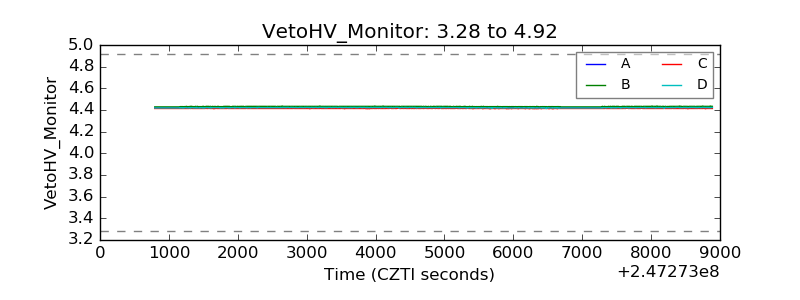 |
| Veto LLD | 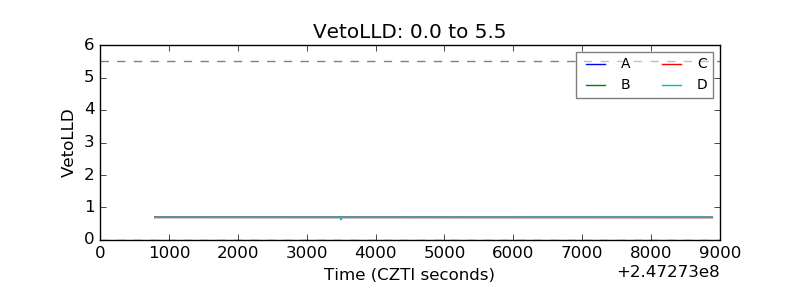 |
| Alpha Counter | 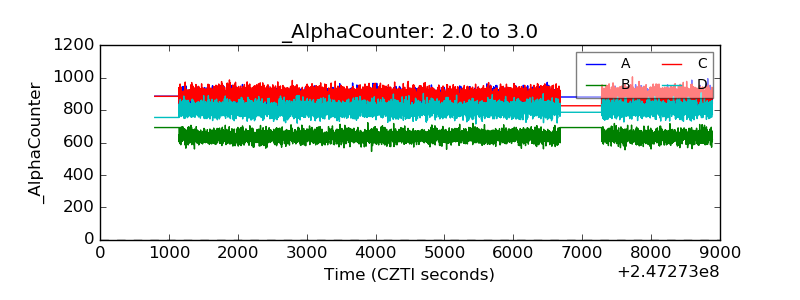 |
| _CPM_Rate |  |
| CZT Counter | 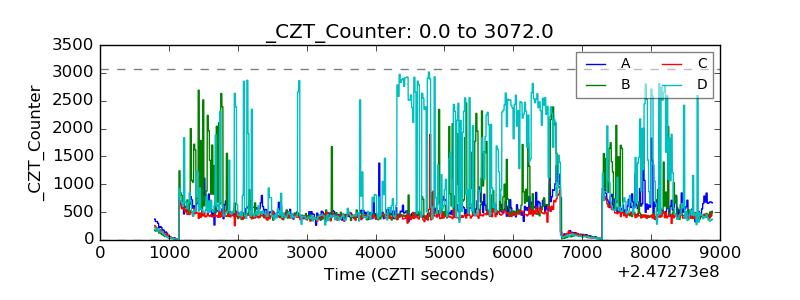 |
| +2.5 Volts monitor |  |
| +5 Volts monitor |  |
| _ROLL_ROT |  |
| _Roll_DEC |  |
| _Roll_RA | 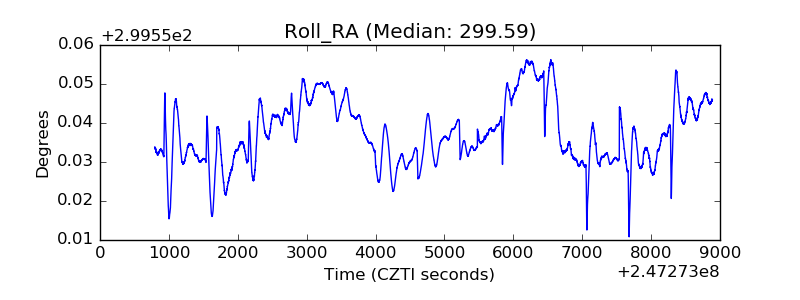 |
| Veto Counter |  |