| Param | Original file | Final file |
|---|---|---|
| Filename | modeM0/AS1G08_062T01_9000001660_11337cztM0_level2.evt | modeM0/AS1G08_062T01_9000001660_11337cztM0_level2_quad_clean.evt |
| Size (bytes) | 628,790,400 | 74,185,920 |
| Size | 599.7 MB | 70.7 MB |
| Events in quadrant A | 4,329,161 | 446,260 |
| Events in quadrant B | 4,534,416 | 431,091 |
| Events in quadrant C | 3,288,315 | 453,514 |
| Events in quadrant D | 6,401,373 | 411,979 |
| Mode M0 | |||
|---|---|---|---|
| Quadrant | BADHDUFLAG | Total packets | Discarded packets |
| A | 0 | 17725 | 3 |
| B | 0 | 18302 | 2 |
| C | 0 | 14899 | 2 |
| D | 0 | 24049 | 2 |
| Mode SS | |||
|---|---|---|---|
| Quadrant | BADHDUFLAG | Total packets | Discarded packets |
| A | 0 | 148 | 0 |
| B | 0 | 148 | 0 |
| C | 0 | 148 | 0 |
| D | 0 | 148 | 0 |
| Mode M9 | |||
|---|---|---|---|
| Quadrant | BADHDUFLAG | Total packets | Discarded packets |
| A | 0 | 1 | 0 |
| B | 0 | 1 | 0 |
| C | 0 | 1 | 0 |
| D | 0 | 1 | 0 |
| Quadrant | Total seconds | Saturated seconds | Saturation percentage |
|---|---|---|---|
| A | 7219 | 183 | 2.534977% |
| B | 7219 | 533 | 7.383294% |
| C | 7219 | 112 | 1.551461% |
| D | 7219 | 1109 | 15.362239% |
Noise dominated data is calculated using 1-second bins in cleaned event files. If a bin has >2000 counts, and if more than 50% of those come from <1% of pixels, then it is considered to be noise-dominated and hence unusable.
| Quadrant | # 1 sec bins | Bins with >0 counts | Bins with >2000 counts | High rate bins dominated by noise | Noise dominated (total time) | Noise dominated (detector-on time) | Marked lightcurve |
|---|---|---|---|---|---|---|---|
| A | 7359 | 7222 | 21 | 21 | 0.29% | 0.29% | 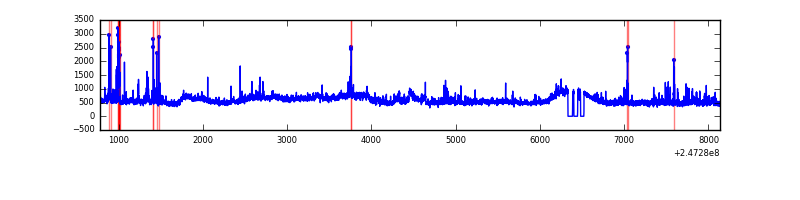 |
| B | 7359 | 7222 | 192 | 192 | 2.61% | 2.66% | 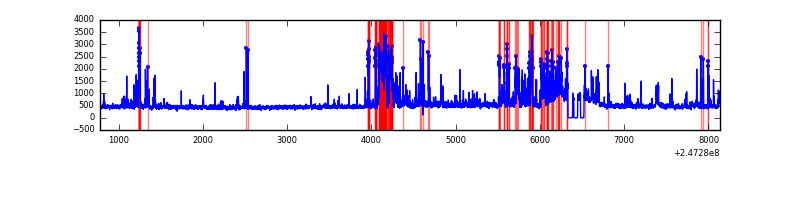 |
| C | 7359 | 7222 | 0 | 0 | 0.00% | 0.00% | 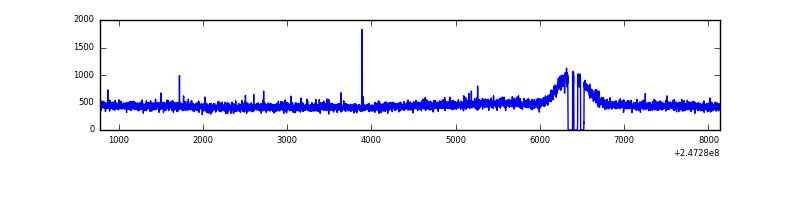 |
| D | 7359 | 7222 | 834 | 834 | 11.33% | 11.55% | 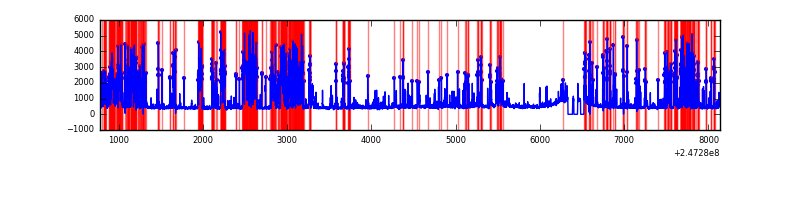 |
Top three noisy pixels from each quadrant. If the there are fewer than three noisy pixels in the level2.evt file, extra rows are filled as -1
| Pixel properties | Quadrant properties | ||||||
|---|---|---|---|---|---|---|---|
| Quadrant | DetID | PixID | Counts | Sigma | Mean | Median | Sigma |
| A | 15 | 174 | 565816 | 3229.22 | 851 | 832 | 175.0 |
| A | 13 | 251 | 339613 | 1936.34 | 851 | 832 | 175.0 |
| A | 1 | 162 | 49919 | 280.56 | 851 | 832 | 175.0 |
| B | 4 | 239 | 968331 | 5980.33 | 836 | 816 | 161.8 |
| B | 3 | 64 | 138111 | 848.64 | 836 | 816 | 161.8 |
| B | 11 | 51 | 71037 | 434.04 | 836 | 816 | 161.8 |
| C | 14 | 234 | 7649 | 34.71 | 841 | 843 | 196.1 |
| C | 13 | 61 | 6207 | 27.35 | 841 | 843 | 196.1 |
| C | 12 | 4 | 3004 | 11.02 | 841 | 843 | 196.1 |
| D | 10 | 253 | 2707779 | 14388.6 | 769 | 745 | 188.1 |
| D | 1 | 52 | 324704 | 1721.93 | 769 | 745 | 188.1 |
| D | 7 | 80 | 120864 | 638.46 | 769 | 745 | 188.1 |
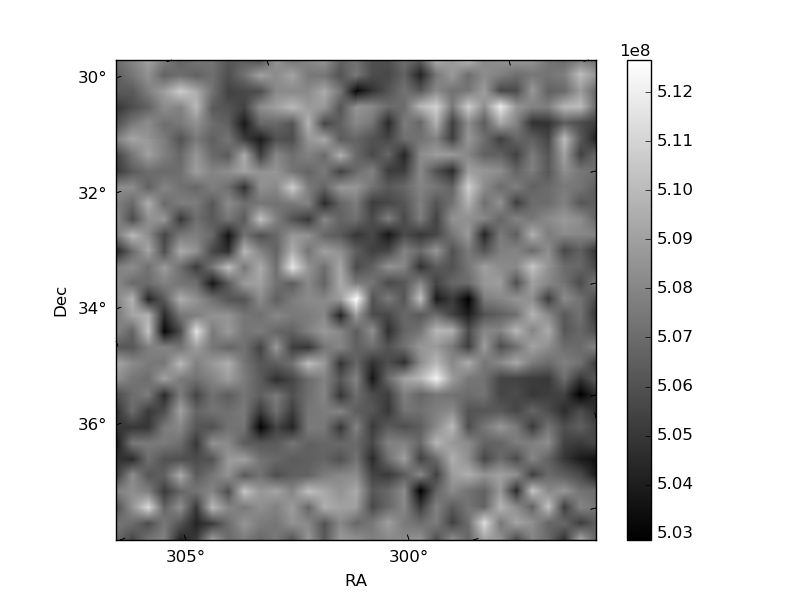
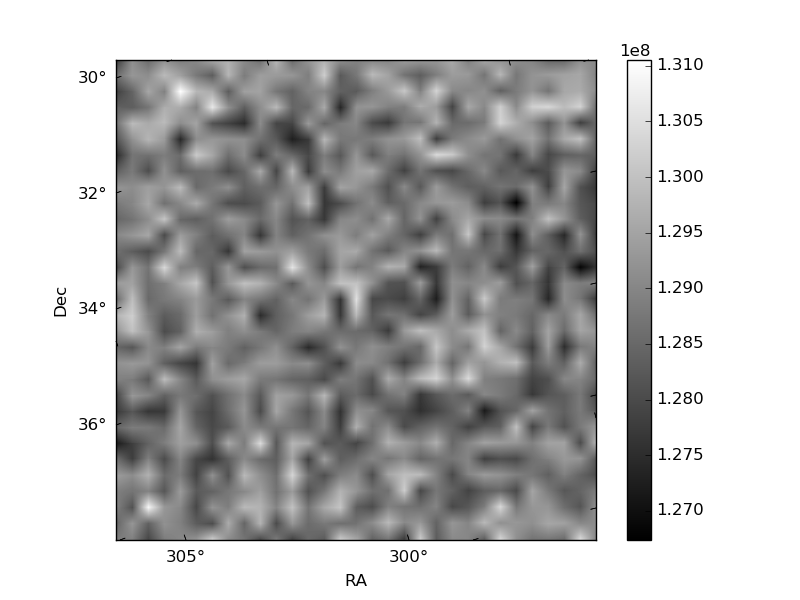
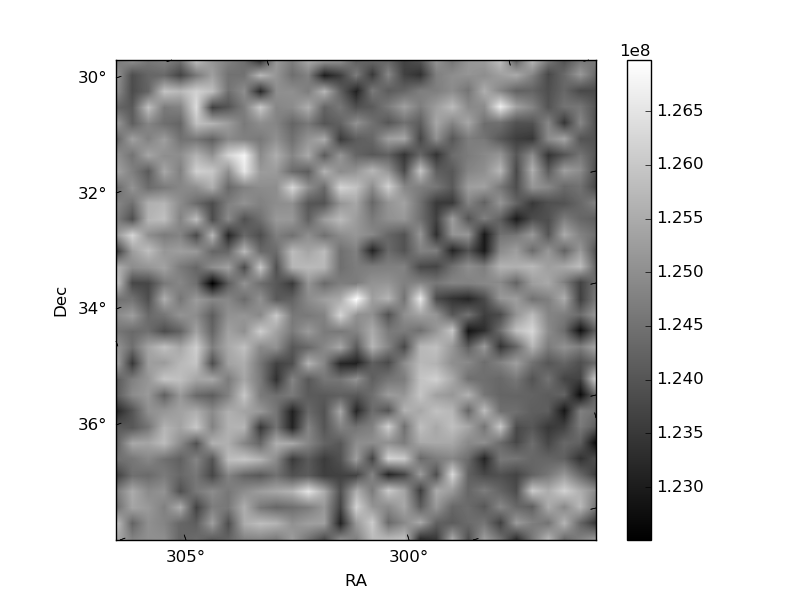
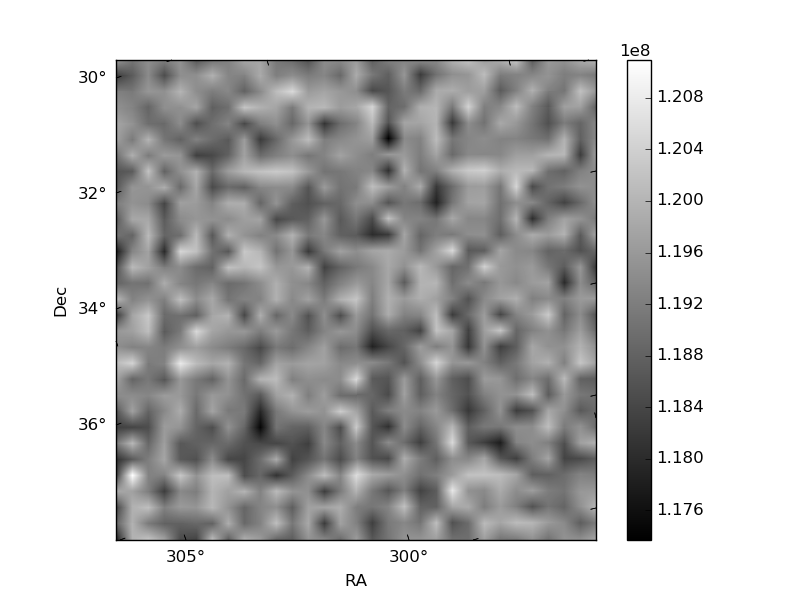
Histogram calculated using DETX and DETY for each event in the final _common_clean file
| Quadrant A | 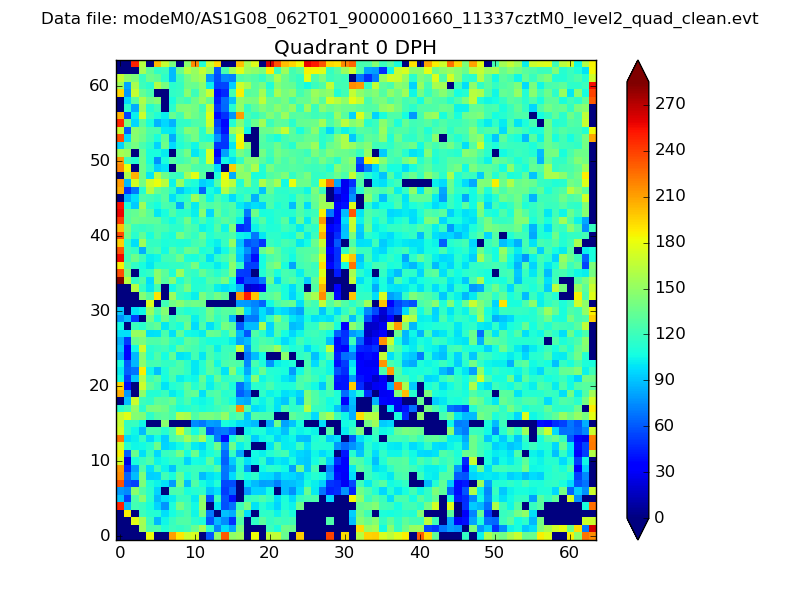 |
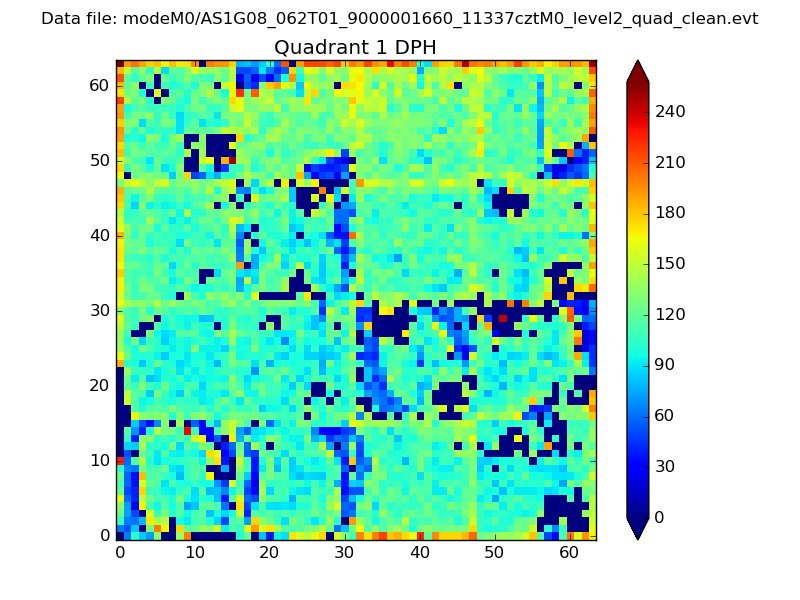 |
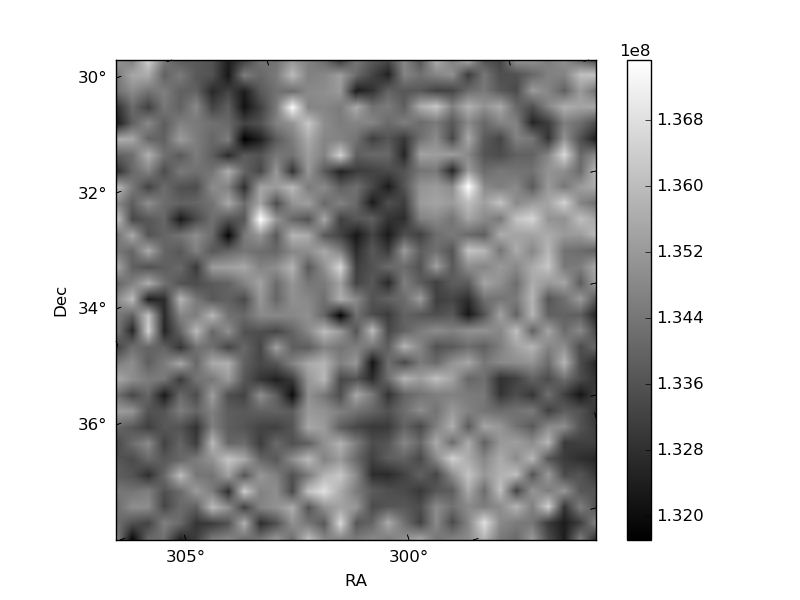
Quadrant B |
|---|---|---|---|
| Quadrant D | 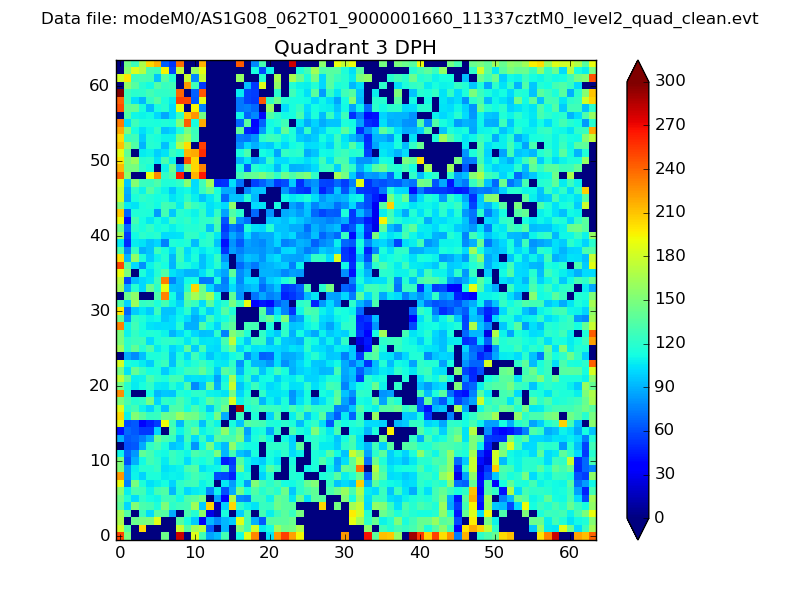 |
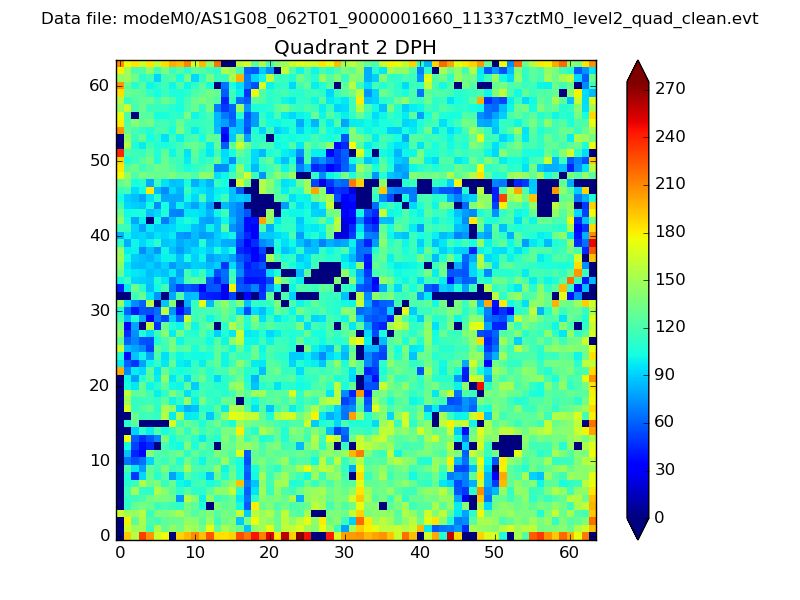 |
Quadrant C |
| Plot type | Count rate plots | Images |
|---|---|---|
| Comparison with Poisson distribution Blue bars denote a histogram of data divided into 1 sec bins. Red curve is a Poisson curve with rate = median count rate of data. |
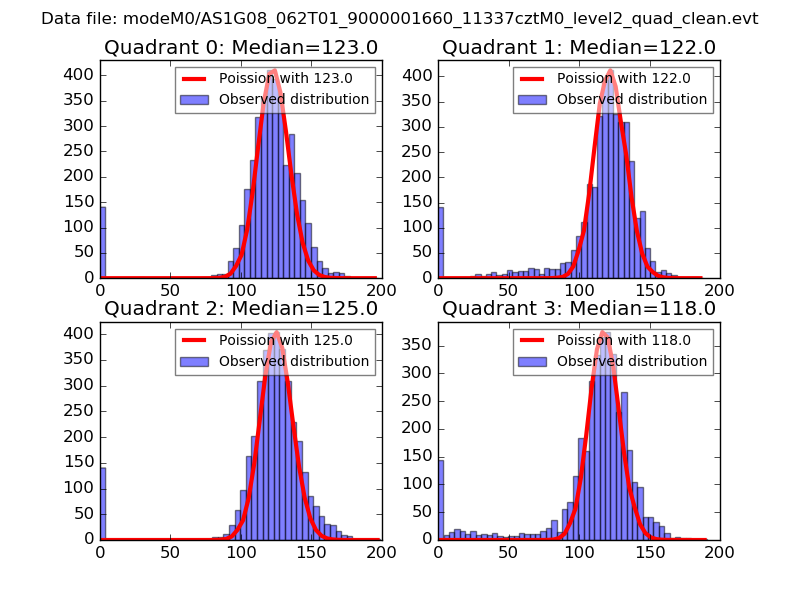 |
 |
| Quadrant-wise count rates Data is divided into 100 sec bins |
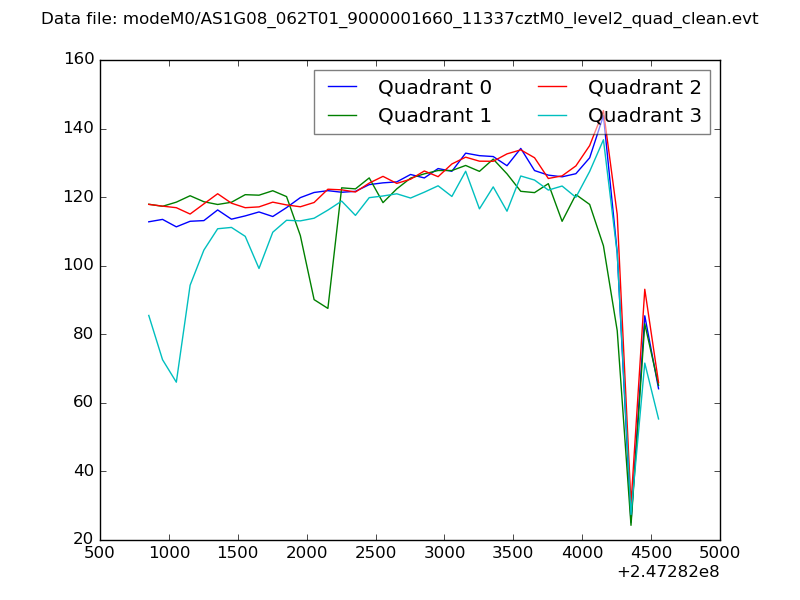 |
|
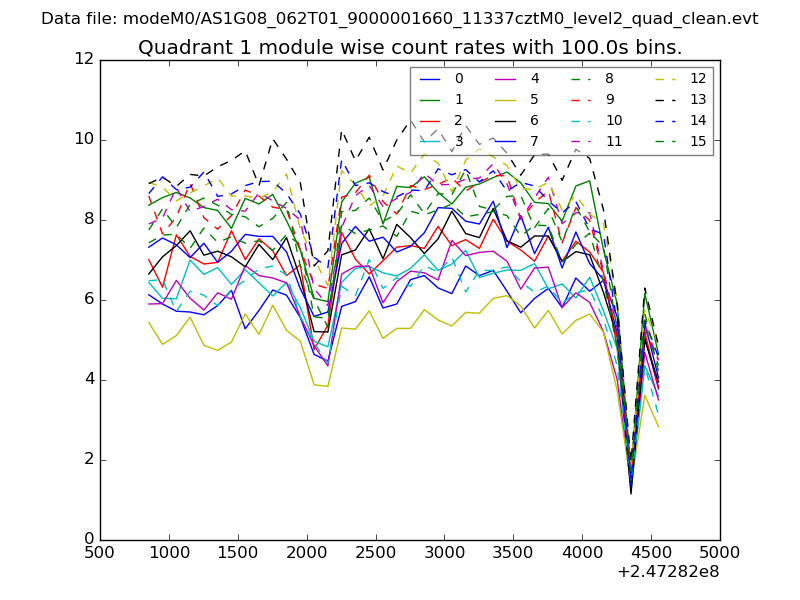
| Module-wise count rates for Quadrant A Data is divided into 100 sec bins |
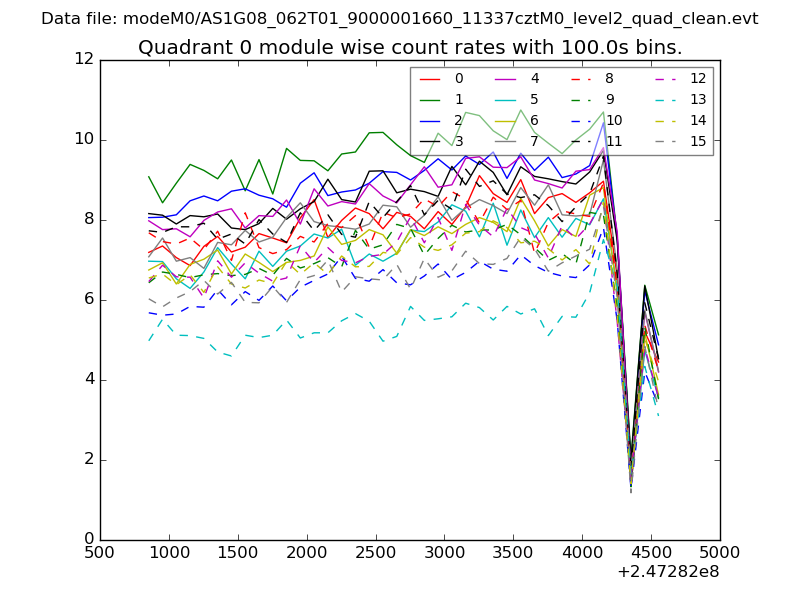 |
 |
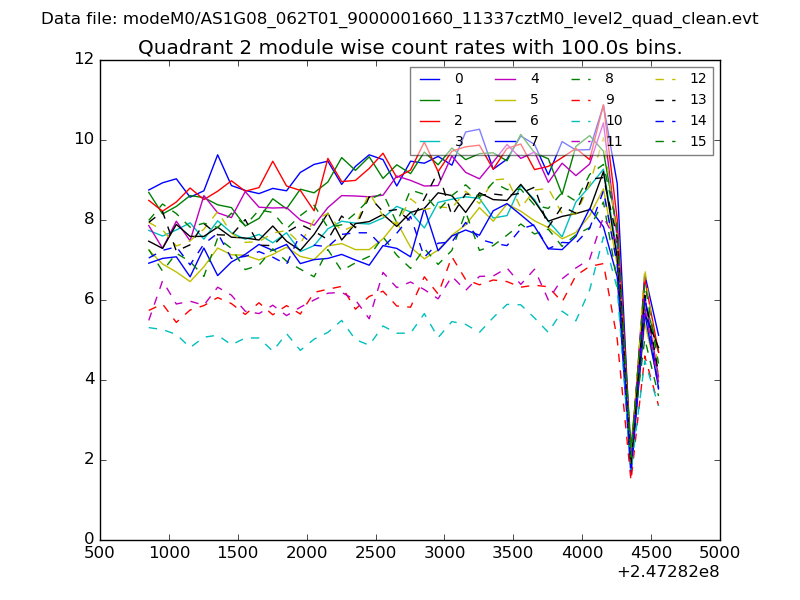
| Module-wise count rates for Quadrant B Data is divided into 100 sec bins |
 |
 |
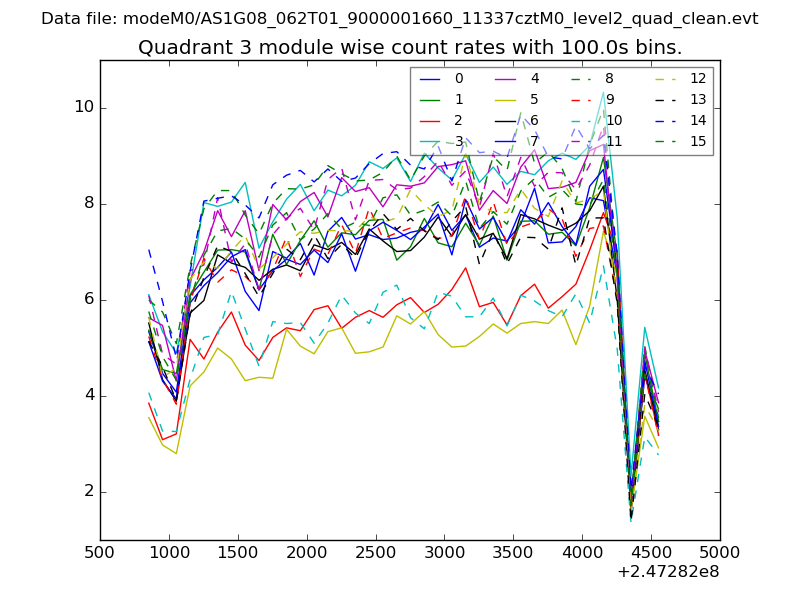
| Module-wise count rates for Quadrant C Data is divided into 100 sec bins |
 |
 |
| Module-wise count rates for Quadrant D Data is divided into 100 sec bins |
 |
 |
| Parameter | Plot |
|---|---|
| CZT HV Monitor | 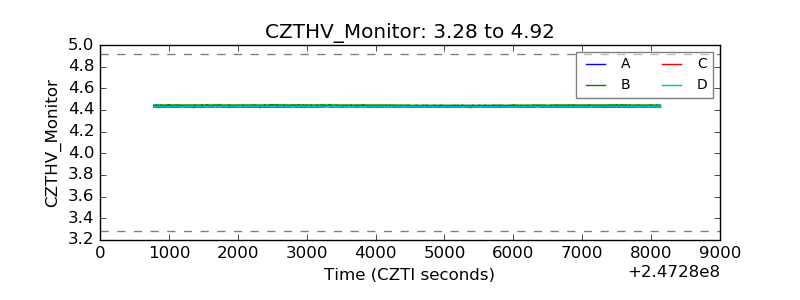 |
| D_VDD | 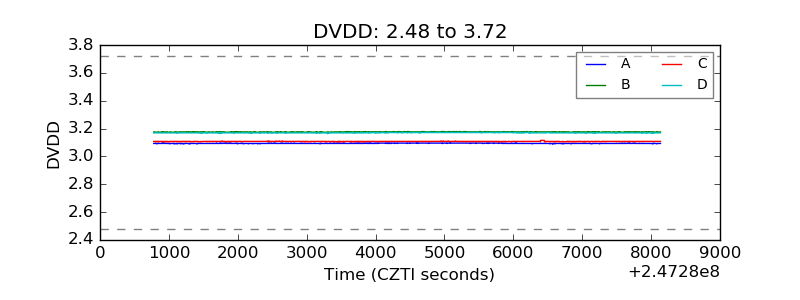 |
| Temperature 1 | 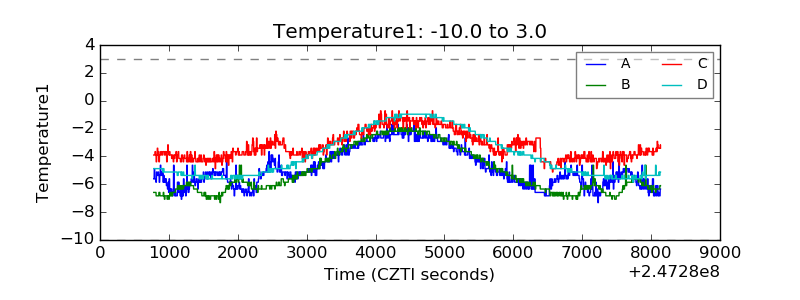 |
| Veto HV Monitor |  |
| Veto LLD | 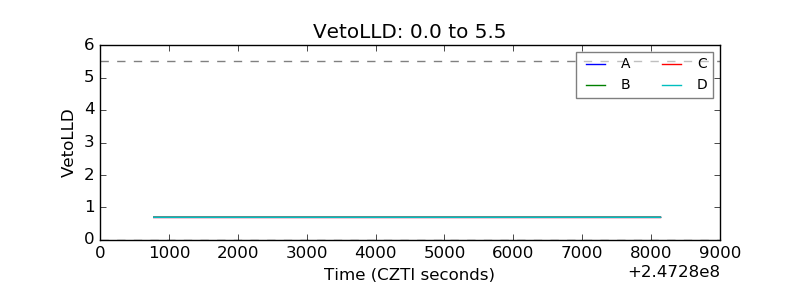 |
| Alpha Counter | 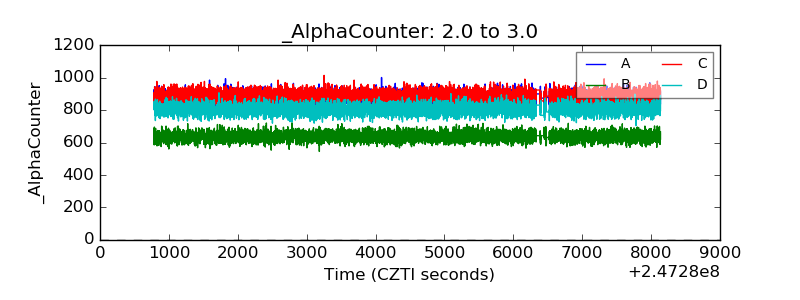 |
| _CPM_Rate | 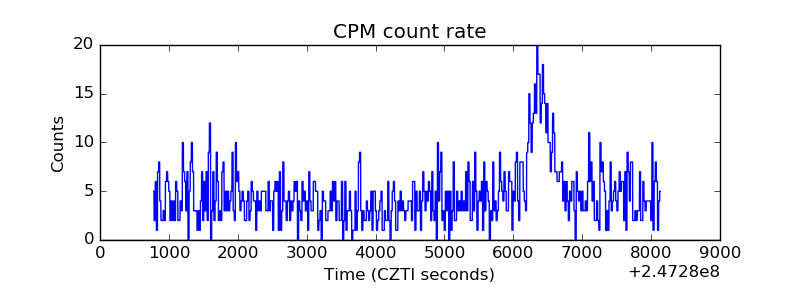 |
| CZT Counter | 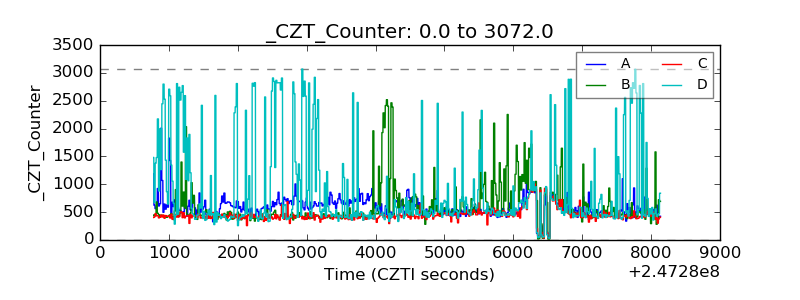 |
| +2.5 Volts monitor |  |
| +5 Volts monitor |  |
| _ROLL_ROT | 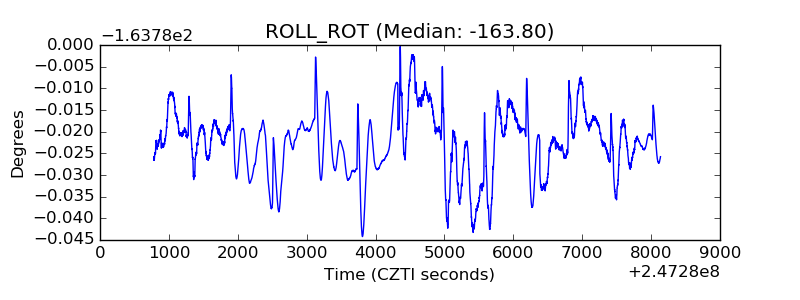 |
| _Roll_DEC | 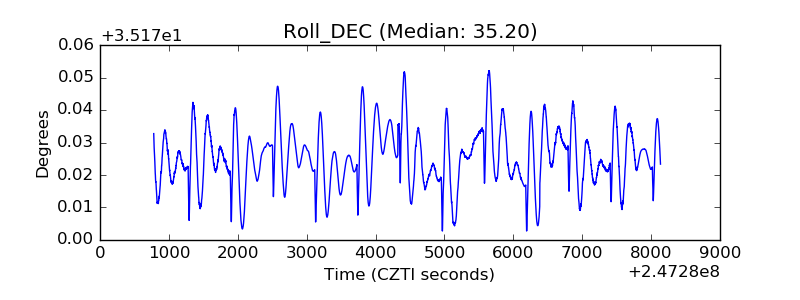 |
| _Roll_RA | 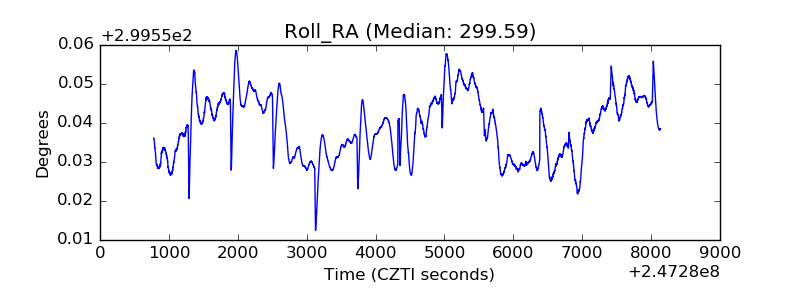 |
| Veto Counter | 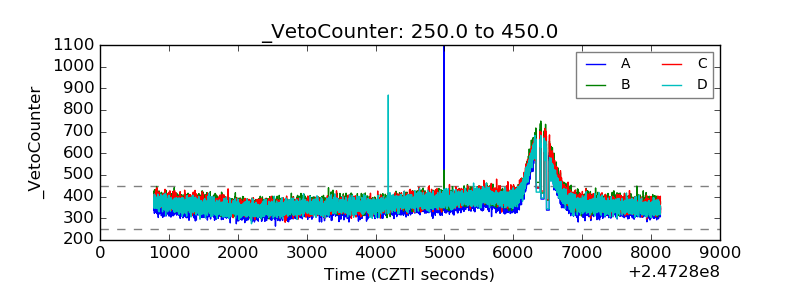 |