| Param | Original file | Final file |
|---|---|---|
| Filename | modeM0/AS1G08_062T01_9000001660_11338cztM0_level2.evt | modeM0/AS1G08_062T01_9000001660_11338cztM0_level2_quad_clean.evt |
| Size (bytes) | 775,912,320 | 89,691,840 |
| Size | 740.0 MB | 85.5 MB |
| Events in quadrant A | 5,254,354 | 544,775 |
| Events in quadrant B | 5,980,039 | 526,161 |
| Events in quadrant C | 3,956,865 | 555,912 |
| Events in quadrant D | 7,735,925 | 502,002 |
| Mode M0 | |||
|---|---|---|---|
| Quadrant | BADHDUFLAG | Total packets | Discarded packets |
| A | 0 | 21084 | 4 |
| B | 0 | 23404 | 3 |
| C | 0 | 17677 | 3 |
| D | 0 | 28705 | 3 |
| Mode SS | |||
|---|---|---|---|
| Quadrant | BADHDUFLAG | Total packets | Discarded packets |
| A | 0 | 174 | 0 |
| B | 0 | 174 | 0 |
| C | 0 | 174 | 0 |
| D | 0 | 174 | 0 |
| Mode M9 | |||
|---|---|---|---|
| Quadrant | BADHDUFLAG | Total packets | Discarded packets |
| A | 0 | 2 | 0 |
| B | 0 | 2 | 0 |
| C | 0 | 2 | 0 |
| D | 0 | 2 | 0 |
| Quadrant | Total seconds | Saturated seconds | Saturation percentage |
|---|---|---|---|
| A | 8441 | 415 | 4.916479% |
| B | 8441 | 838 | 9.927734% |
| C | 8441 | 206 | 2.440469% |
| D | 8441 | 1279 | 15.152233% |
Noise dominated data is calculated using 1-second bins in cleaned event files. If a bin has >2000 counts, and if more than 50% of those come from <1% of pixels, then it is considered to be noise-dominated and hence unusable.
| Quadrant | # 1 sec bins | Bins with >0 counts | Bins with >2000 counts | High rate bins dominated by noise | Noise dominated (total time) | Noise dominated (detector-on time) | Marked lightcurve |
|---|---|---|---|---|---|---|---|
| A | 8696 | 8446 | 42 | 42 | 0.48% | 0.50% | 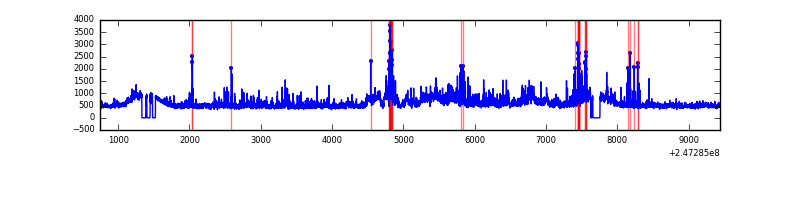 |
| B | 8696 | 8446 | 268 | 268 | 3.08% | 3.17% | 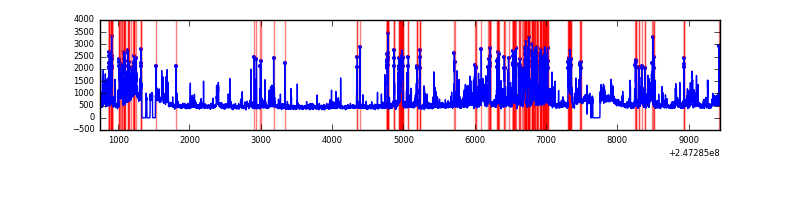 |
| C | 8696 | 8446 | 0 | 0 | 0.00% | 0.00% | 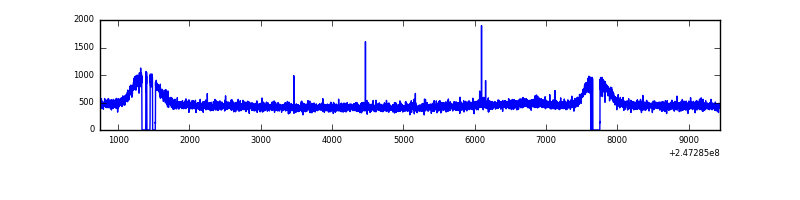 |
| D | 8696 | 8446 | 890 | 890 | 10.23% | 10.54% |  |
Top three noisy pixels from each quadrant. If the there are fewer than three noisy pixels in the level2.evt file, extra rows are filled as -1
| Pixel properties | Quadrant properties | ||||||
|---|---|---|---|---|---|---|---|
| Quadrant | DetID | PixID | Counts | Sigma | Mean | Median | Sigma |
| A | 13 | 251 | 815468 | 3863.3 | 1019 | 994 | 210.8 |
| A | 15 | 174 | 308204 | 1457.19 | 1019 | 994 | 210.8 |
| A | 8 | 15 | 82229 | 385.32 | 1019 | 994 | 210.8 |
| B | 4 | 239 | 1430670 | 7391.97 | 1003 | 978 | 193.4 |
| B | 3 | 64 | 354387 | 1827.24 | 1003 | 978 | 193.4 |
| B | 11 | 51 | 112938 | 578.87 | 1003 | 978 | 193.4 |
| C | 14 | 234 | 9260 | 34.81 | 1013 | 1018 | 236.7 |
| C | 13 | 61 | 7475 | 27.27 | 1013 | 1018 | 236.7 |
| C | 3 | 202 | 2393 | 5.81 | 1013 | 1018 | 236.7 |
| D | 10 | 253 | 1783834 | 7972.23 | 929 | 901 | 223.6 |
| D | 2 | 14 | 775034 | 3461.47 | 929 | 901 | 223.6 |
| D | 14 | 34 | 522140 | 2330.67 | 929 | 901 | 223.6 |
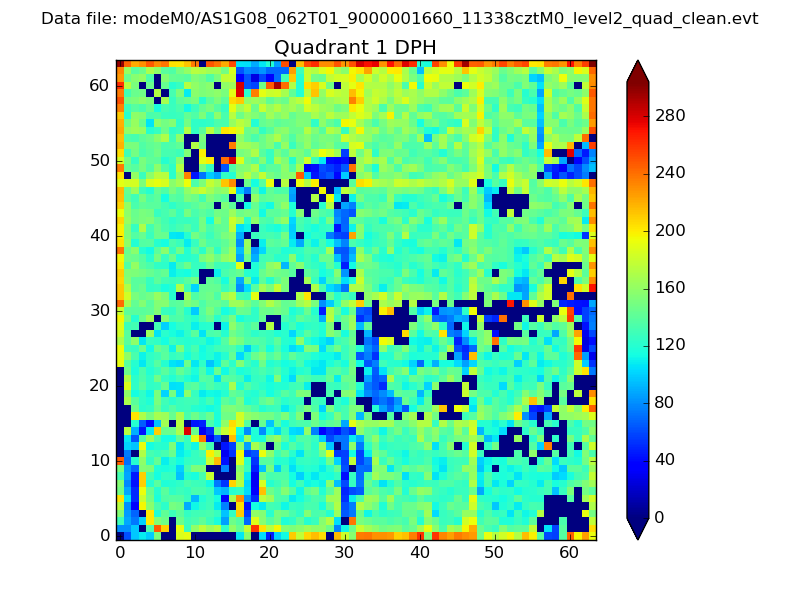
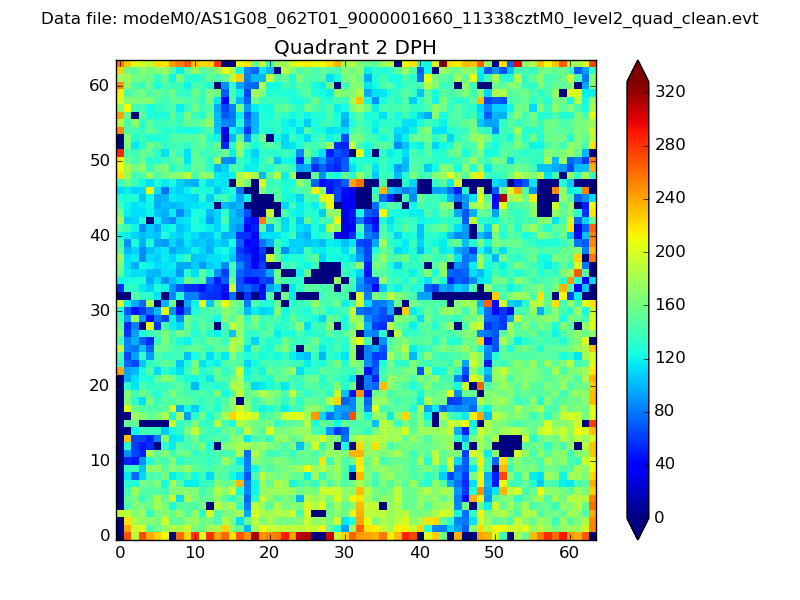
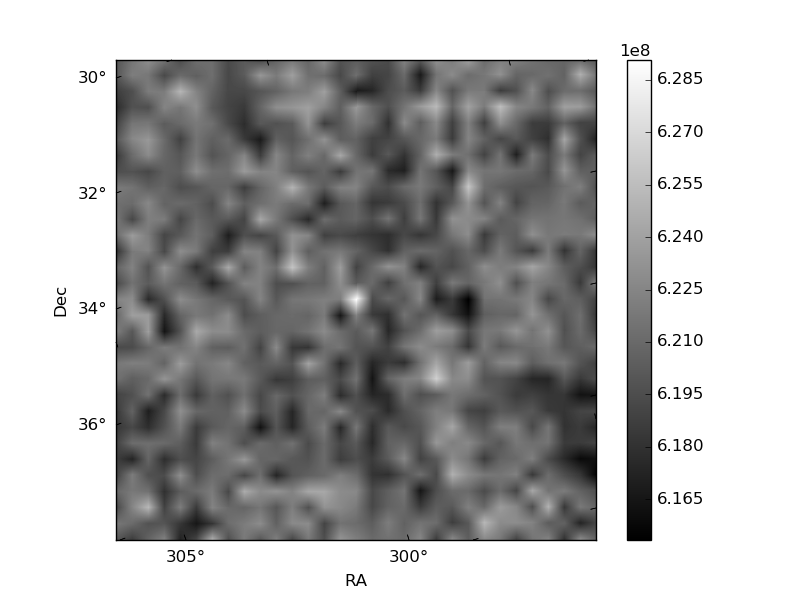
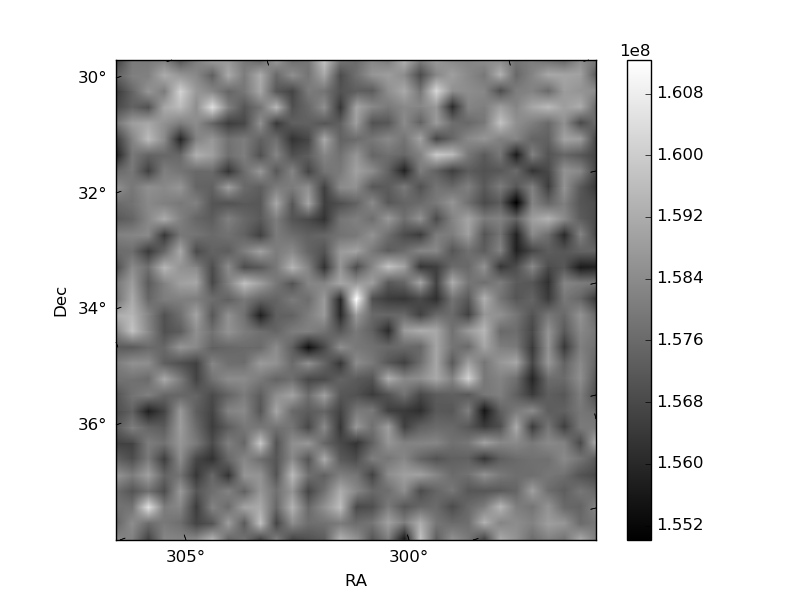
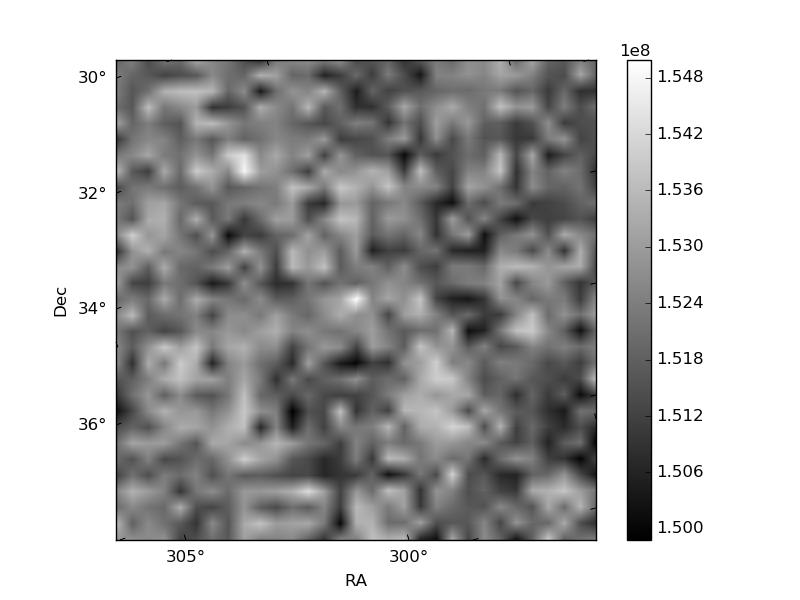
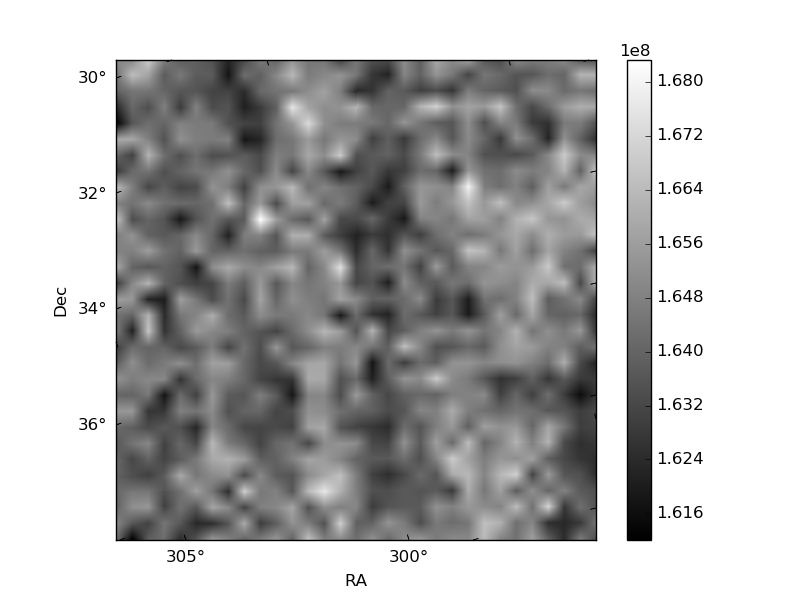
Histogram calculated using DETX and DETY for each event in the final _common_clean file
| Quadrant A | 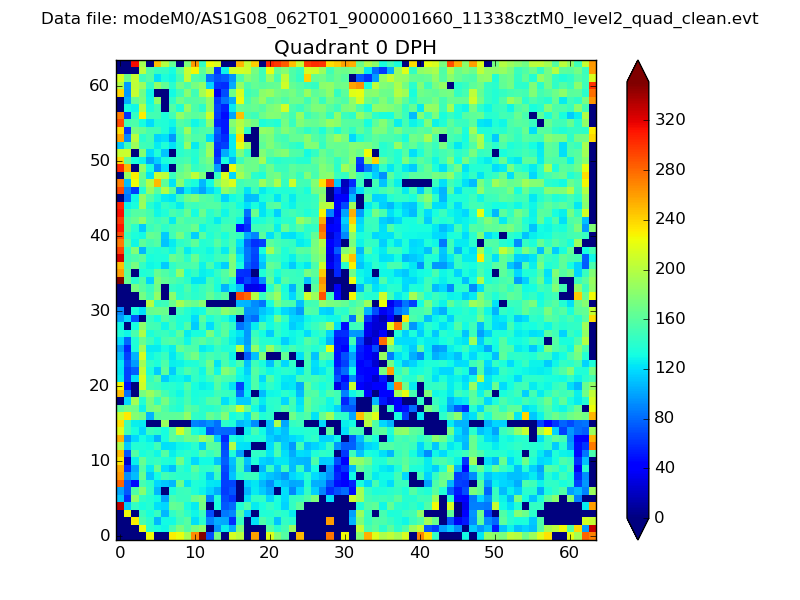 |
 |
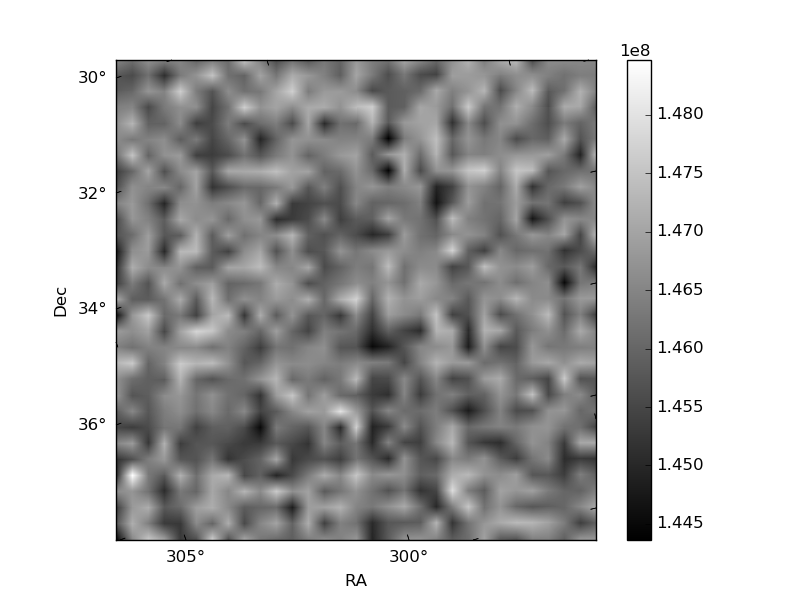
Quadrant B |
|---|---|---|---|
| Quadrant D | 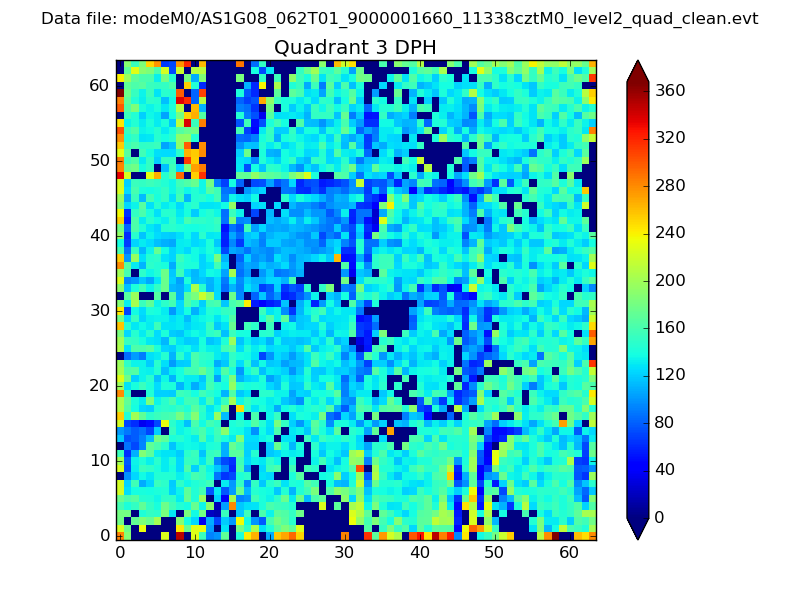 |
 |
Quadrant C |
| Plot type | Count rate plots | Images |
|---|---|---|
| Comparison with Poisson distribution Blue bars denote a histogram of data divided into 1 sec bins. Red curve is a Poisson curve with rate = median count rate of data. |
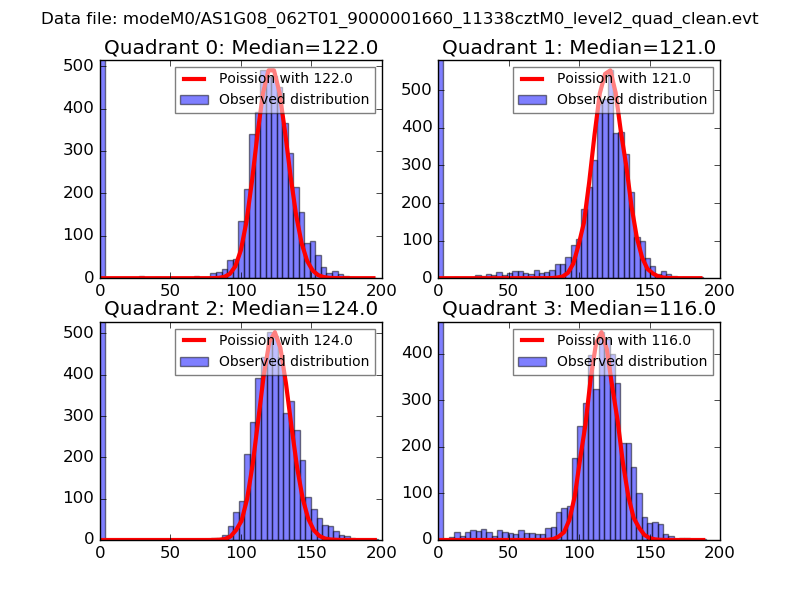 |
 |
| Quadrant-wise count rates Data is divided into 100 sec bins |
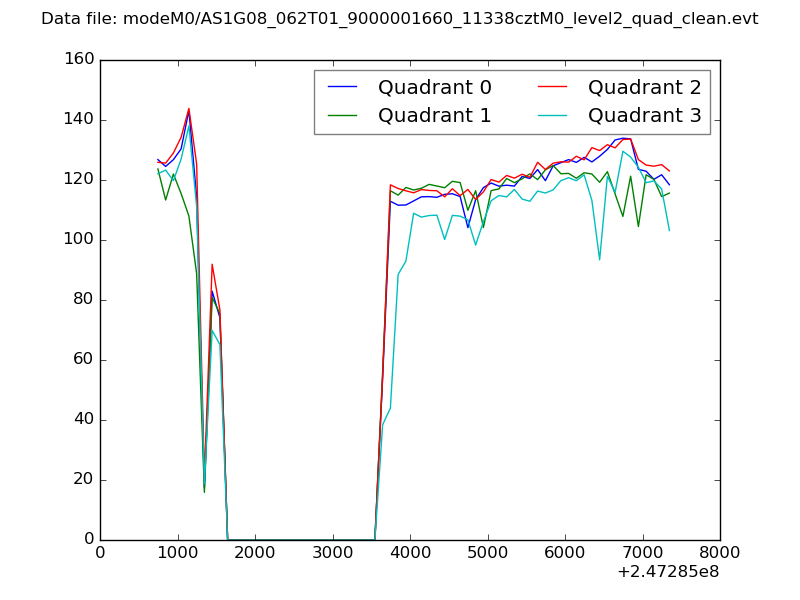 |
|
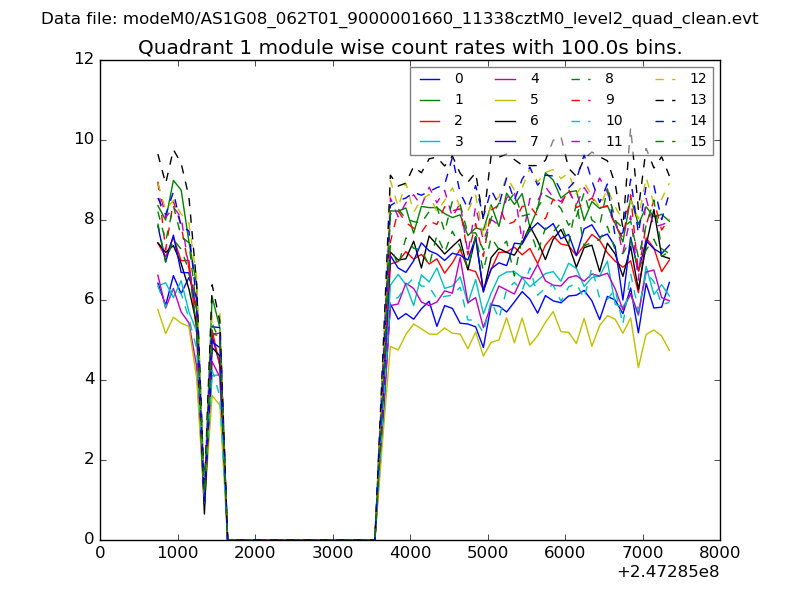
| Module-wise count rates for Quadrant A Data is divided into 100 sec bins |
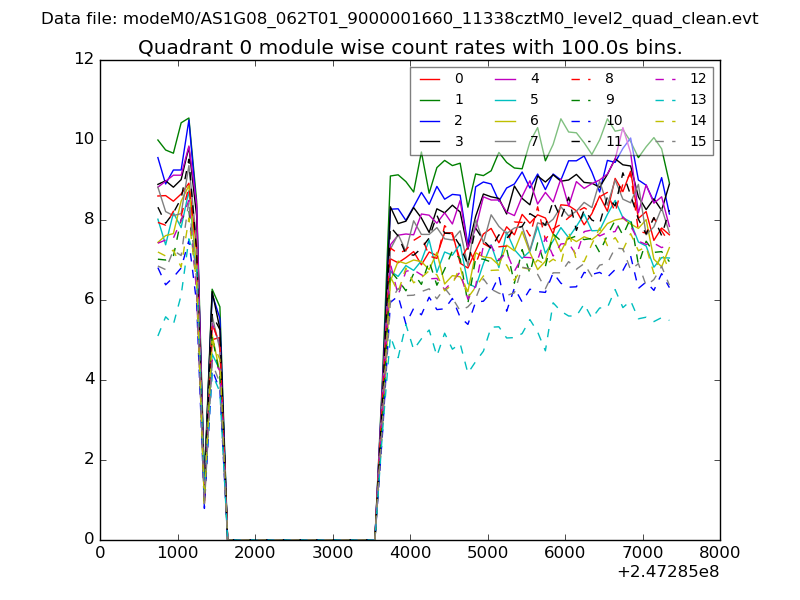 |
 |
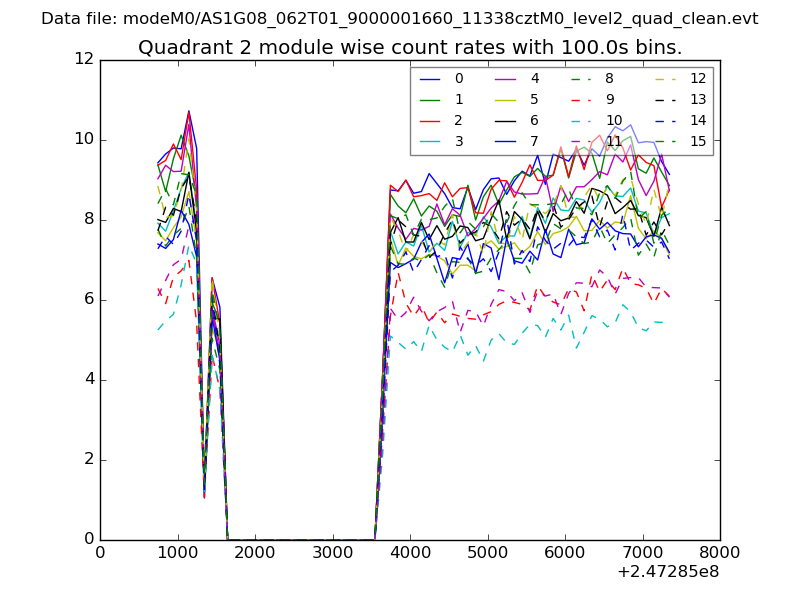
| Module-wise count rates for Quadrant B Data is divided into 100 sec bins |
 |
 |
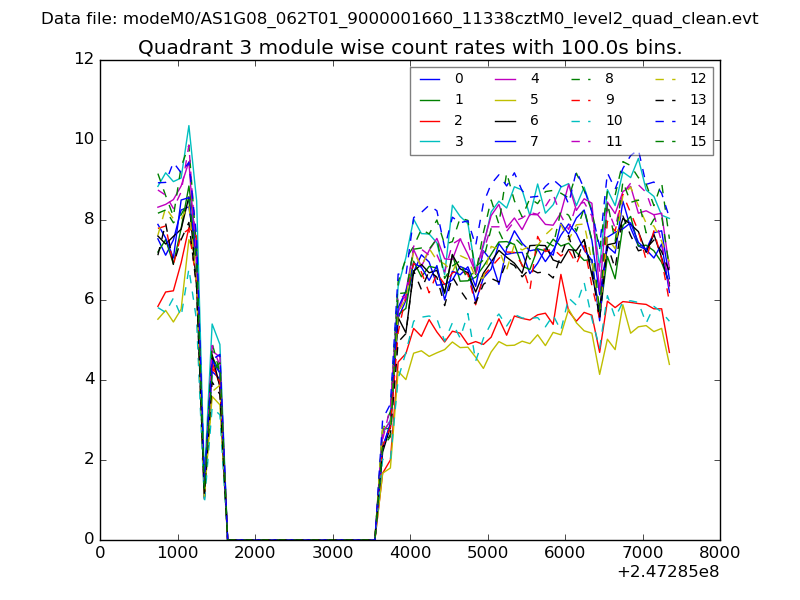
| Module-wise count rates for Quadrant C Data is divided into 100 sec bins |
 |
 |
| Module-wise count rates for Quadrant D Data is divided into 100 sec bins |
 |
 |
| Parameter | Plot |
|---|---|
| CZT HV Monitor | 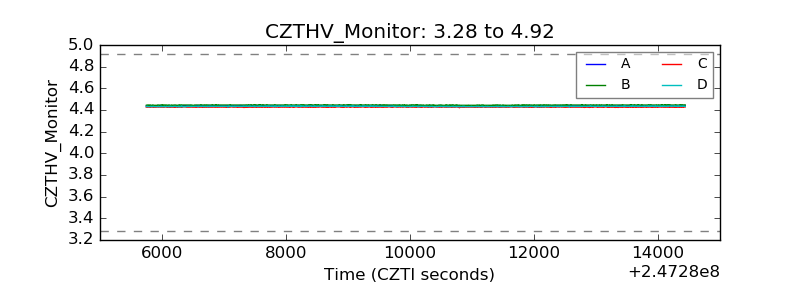 |
| D_VDD | 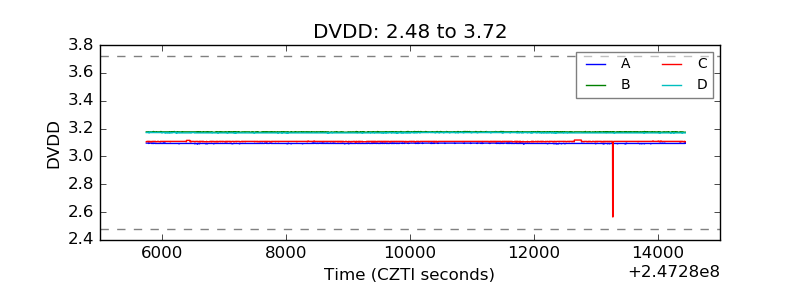 |
| Temperature 1 | 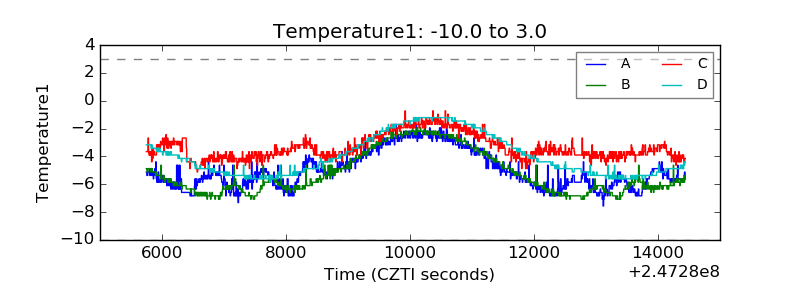 |
| Veto HV Monitor | 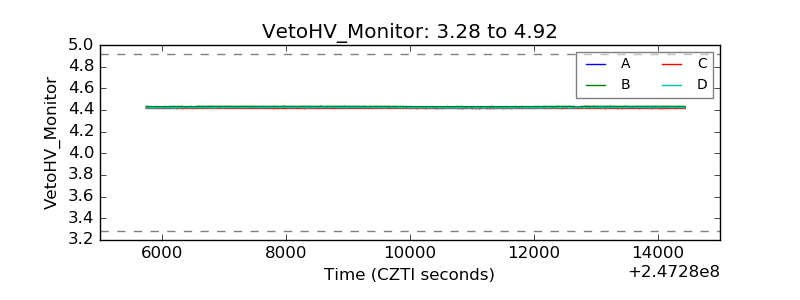 |
| Veto LLD | 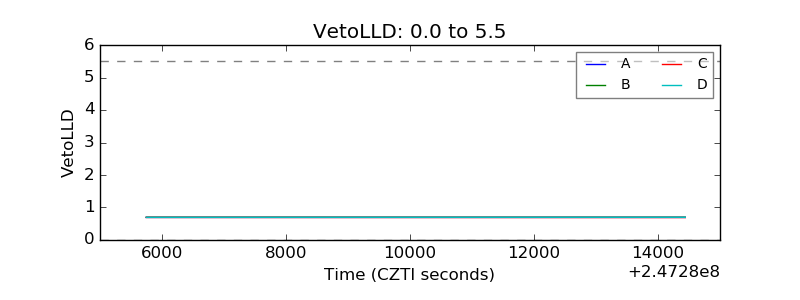 |
| Alpha Counter | 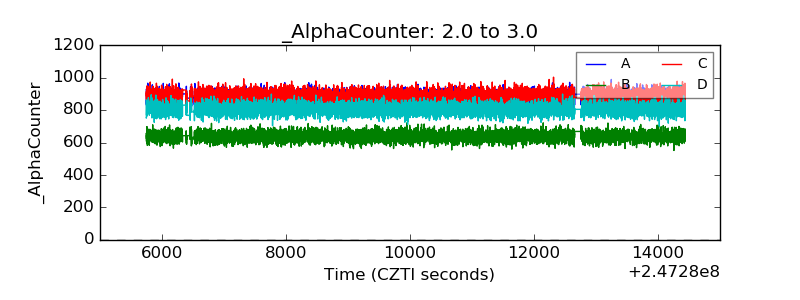 |
| _CPM_Rate | 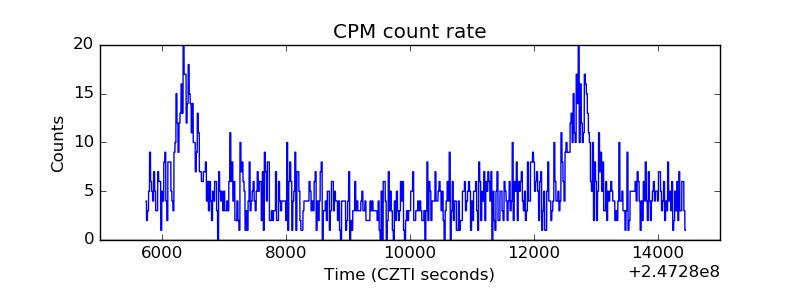 |
| CZT Counter | 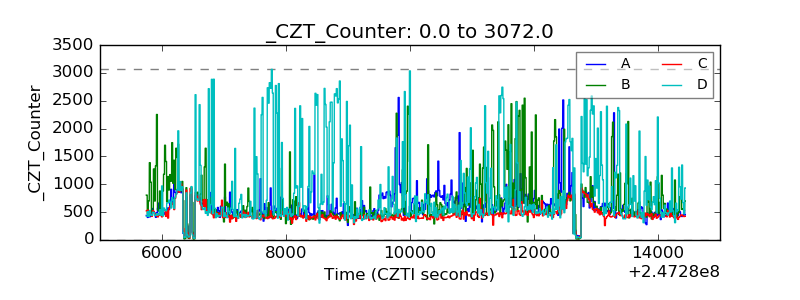 |
| +2.5 Volts monitor |  |
| +5 Volts monitor |  |
| _ROLL_ROT | 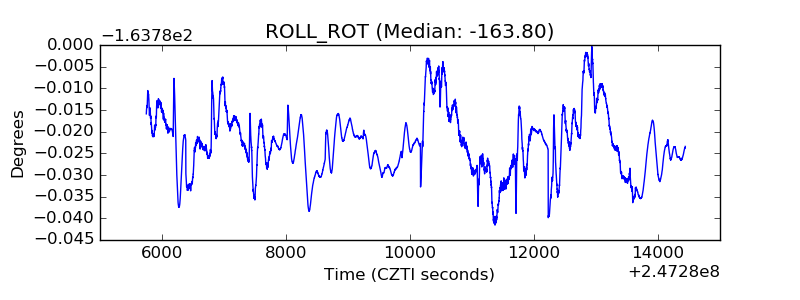 |
| _Roll_DEC | 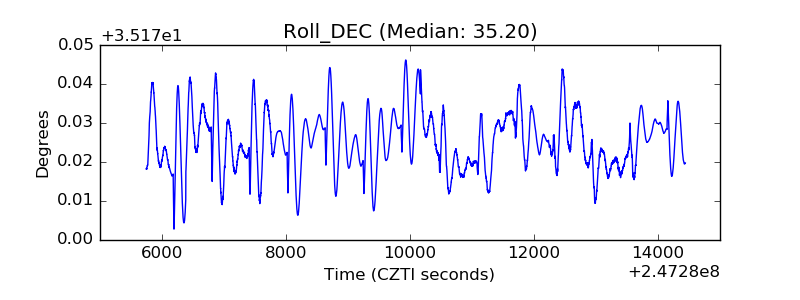 |
| _Roll_RA | 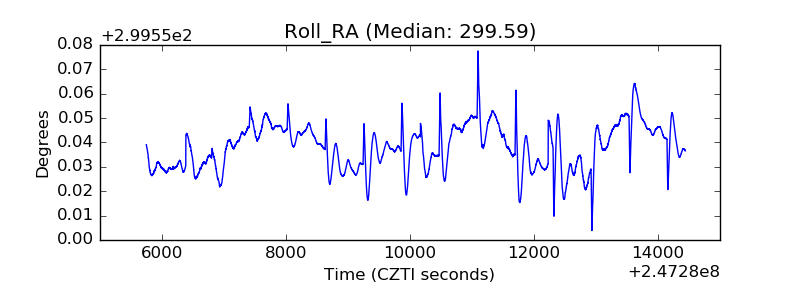 |
| Veto Counter | 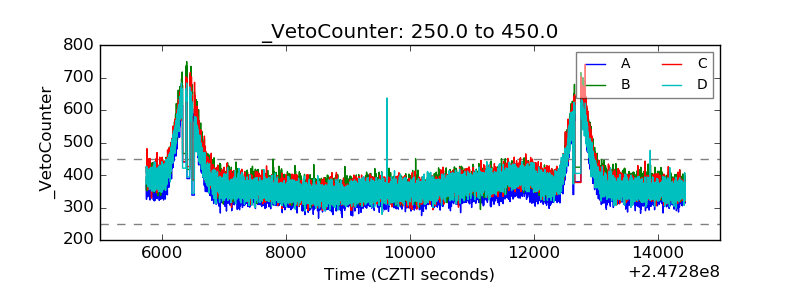 |