| Param | Original file | Final file |
|---|---|---|
| Filename | modeM0/AS1G08_062T01_9000001660_11339cztM0_level2.evt | modeM0/AS1G08_062T01_9000001660_11339cztM0_level2_quad_clean.evt |
| Size (bytes) | 633,939,840 | 80,478,720 |
| Size | 604.6 MB | 76.8 MB |
| Events in quadrant A | 4,594,662 | 490,199 |
| Events in quadrant B | 5,049,014 | 475,878 |
| Events in quadrant C | 3,301,748 | 497,429 |
| Events in quadrant D | 5,749,642 | 455,688 |
| Mode M0 | |||
|---|---|---|---|
| Quadrant | BADHDUFLAG | Total packets | Discarded packets |
| A | 0 | 18404 | 2 |
| B | 0 | 19813 | 1 |
| C | 0 | 15058 | 1 |
| D | 0 | 22126 | 1 |
| Mode SS | |||
|---|---|---|---|
| Quadrant | BADHDUFLAG | Total packets | Discarded packets |
| A | 0 | 152 | 0 |
| B | 0 | 152 | 0 |
| C | 0 | 152 | 0 |
| D | 0 | 152 | 0 |
| Mode M9 | |||
|---|---|---|---|
| Quadrant | BADHDUFLAG | Total packets | Discarded packets |
| A | 0 | 3 | 0 |
| B | 0 | 3 | 0 |
| C | 0 | 3 | 0 |
| D | 0 | 3 | 0 |
| Quadrant | Total seconds | Saturated seconds | Saturation percentage |
|---|---|---|---|
| A | 7432 | 163 | 2.193219% |
| B | 7432 | 530 | 7.131324% |
| C | 7432 | 59 | 0.793864% |
| D | 7432 | 663 | 8.920883% |
Noise dominated data is calculated using 1-second bins in cleaned event files. If a bin has >2000 counts, and if more than 50% of those come from <1% of pixels, then it is considered to be noise-dominated and hence unusable.
| Quadrant | # 1 sec bins | Bins with >0 counts | Bins with >2000 counts | High rate bins dominated by noise | Noise dominated (total time) | Noise dominated (detector-on time) | Marked lightcurve |
|---|---|---|---|---|---|---|---|
| A | 7797 | 7433 | 31 | 31 | 0.40% | 0.42% | 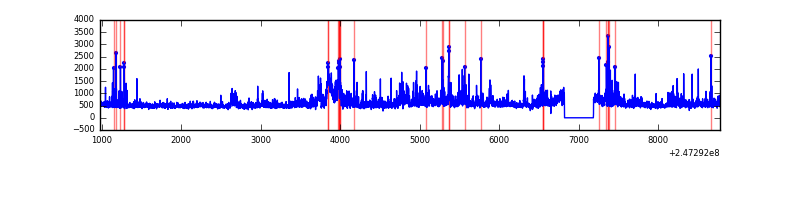 |
| B | 7797 | 7433 | 292 | 292 | 3.75% | 3.93% | 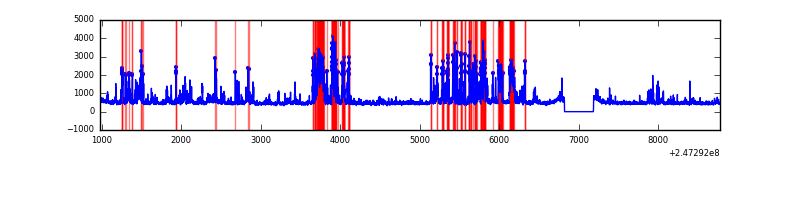 |
| C | 7797 | 7433 | 0 | 0 | 0.00% | 0.00% | 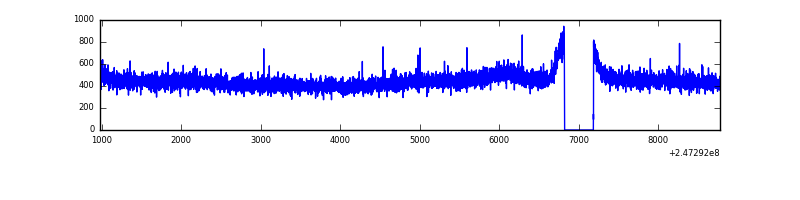 |
| D | 7797 | 7433 | 475 | 475 | 6.09% | 6.39% | 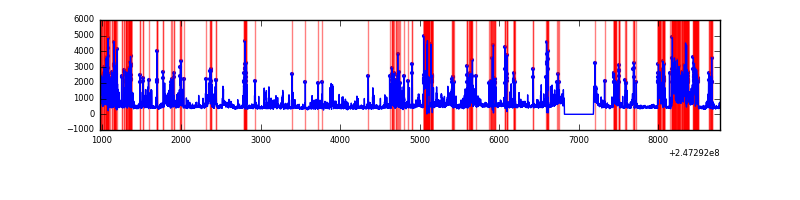 |
Top three noisy pixels from each quadrant. If the there are fewer than three noisy pixels in the level2.evt file, extra rows are filled as -1
| Pixel properties | Quadrant properties | ||||||
|---|---|---|---|---|---|---|---|
| Quadrant | DetID | PixID | Counts | Sigma | Mean | Median | Sigma |
| A | 13 | 251 | 931957 | 5280.76 | 858 | 840 | 176.3 |
| A | 15 | 174 | 155773 | 878.69 | 858 | 840 | 176.3 |
| A | 1 | 162 | 63460 | 355.14 | 858 | 840 | 176.3 |
| B | 4 | 239 | 1177151 | 7189.24 | 848 | 825 | 163.6 |
| B | 3 | 64 | 424146 | 2587.17 | 848 | 825 | 163.6 |
| B | 11 | 51 | 38194 | 228.38 | 848 | 825 | 163.6 |
| C | 13 | 61 | 6181 | 26.95 | 846 | 849 | 197.9 |
| C | 13 | 250 | 3221 | 11.99 | 846 | 849 | 197.9 |
| C | 3 | 202 | 2119 | 6.42 | 846 | 849 | 197.9 |
| D | 2 | 14 | 849361 | 4368.31 | 804 | 780 | 194.3 |
| D | 1 | 52 | 518931 | 2667.33 | 804 | 780 | 194.3 |
| D | 10 | 253 | 403025 | 2070.67 | 804 | 780 | 194.3 |
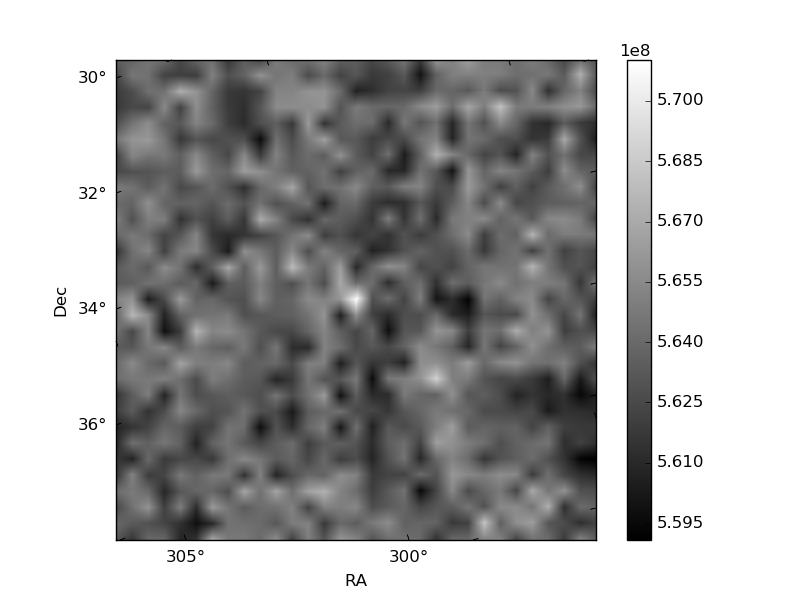
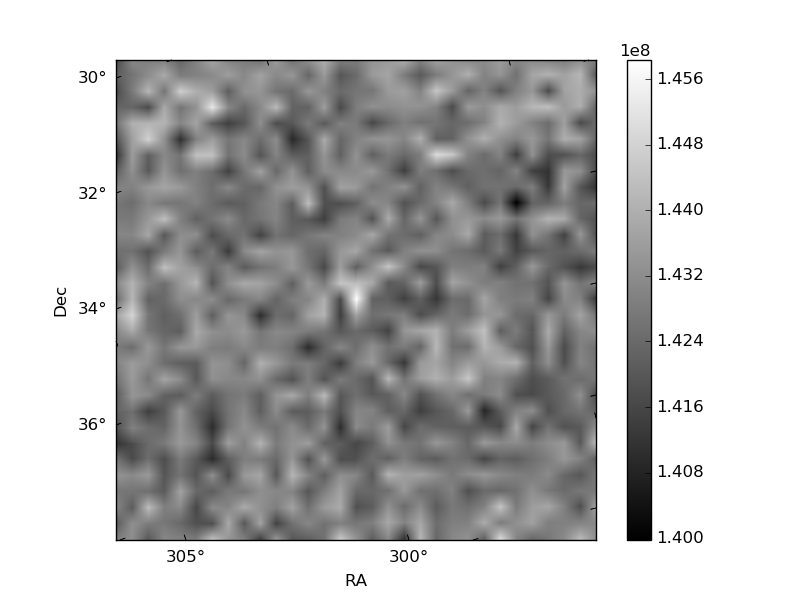
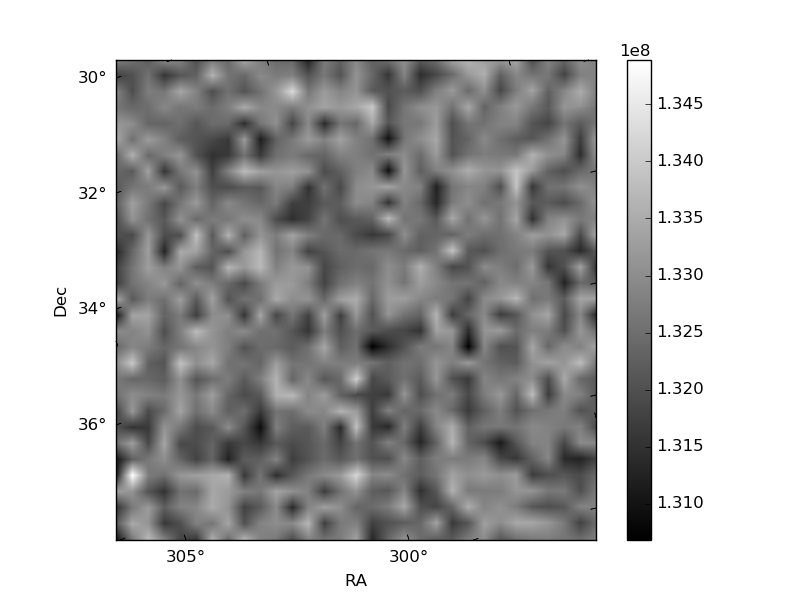
Histogram calculated using DETX and DETY for each event in the final _common_clean file
| Quadrant A | 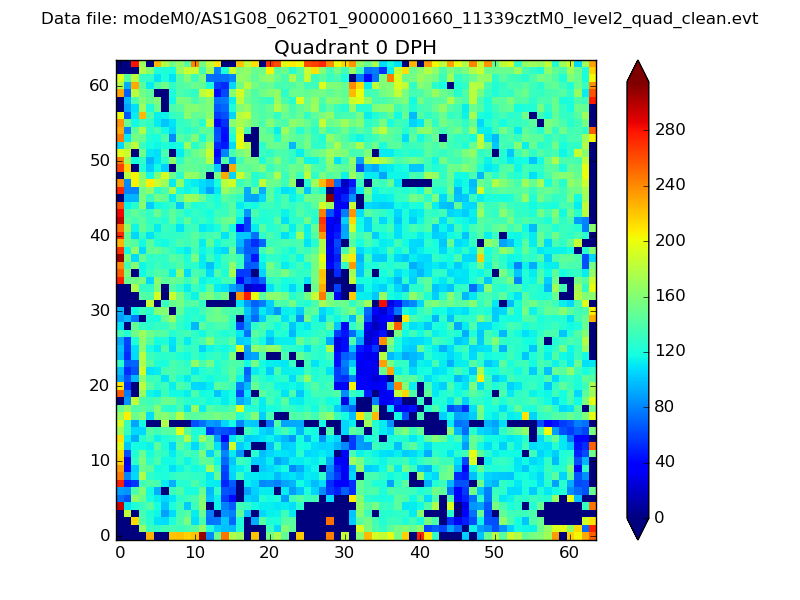 |
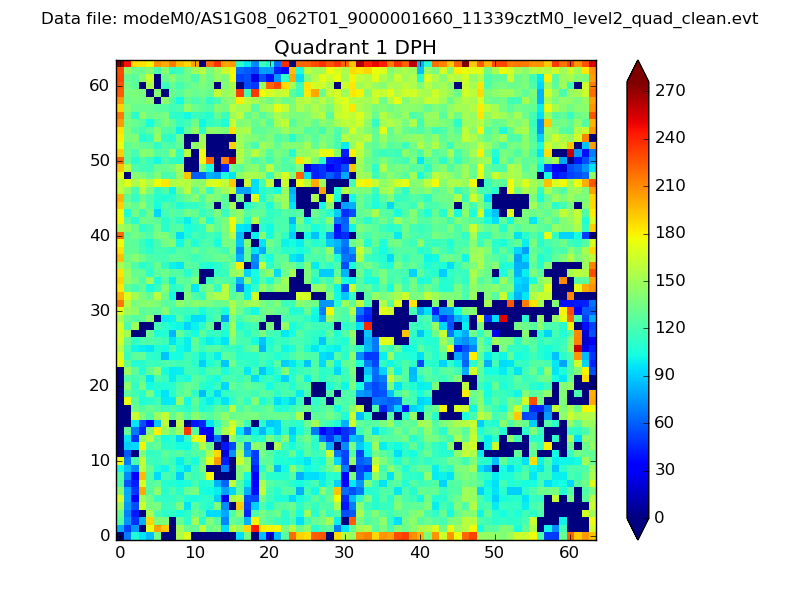 |
Quadrant B |
|---|---|---|---|
| Quadrant D | 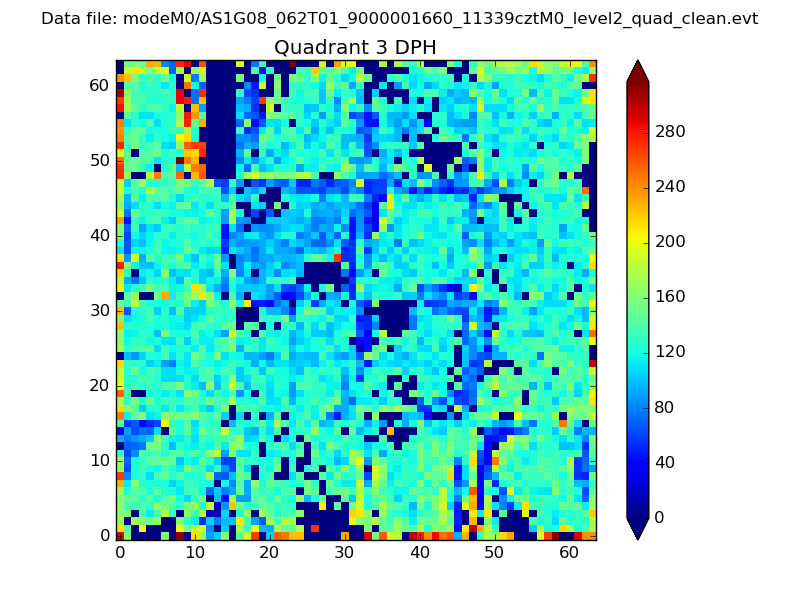 |
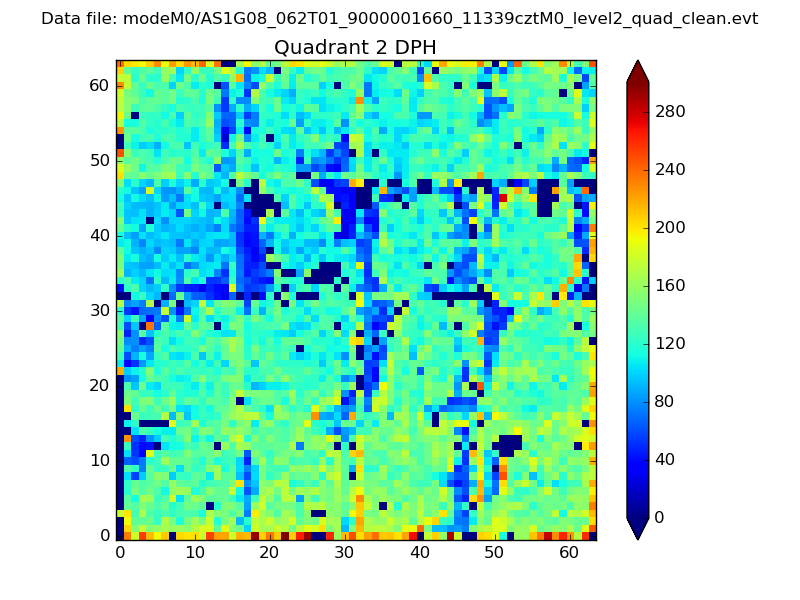 |
Quadrant C |
| Plot type | Count rate plots | Images |
|---|---|---|
| Comparison with Poisson distribution Blue bars denote a histogram of data divided into 1 sec bins. Red curve is a Poisson curve with rate = median count rate of data. |
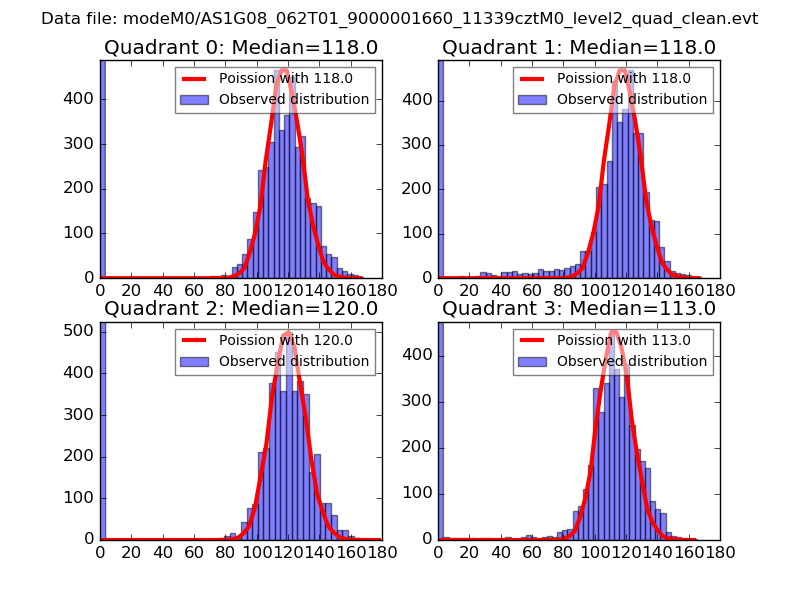 |
 |
| Quadrant-wise count rates Data is divided into 100 sec bins |
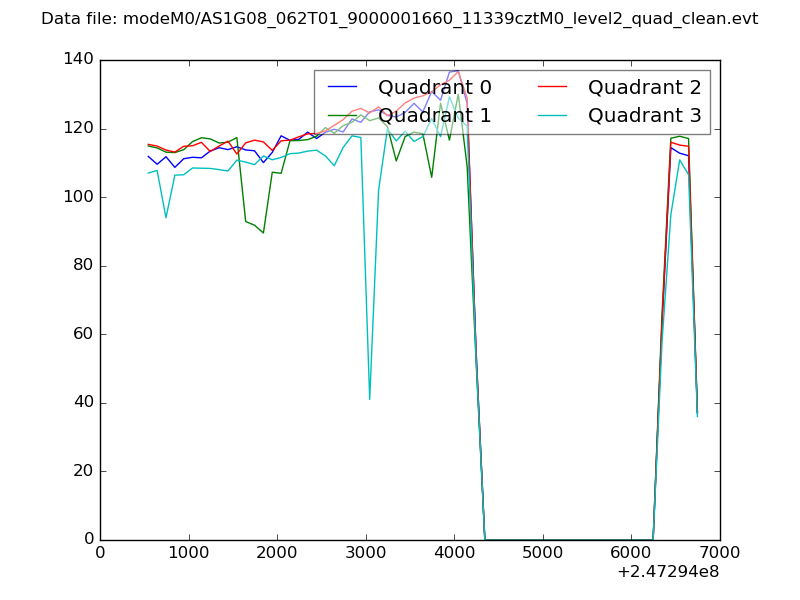 |
|
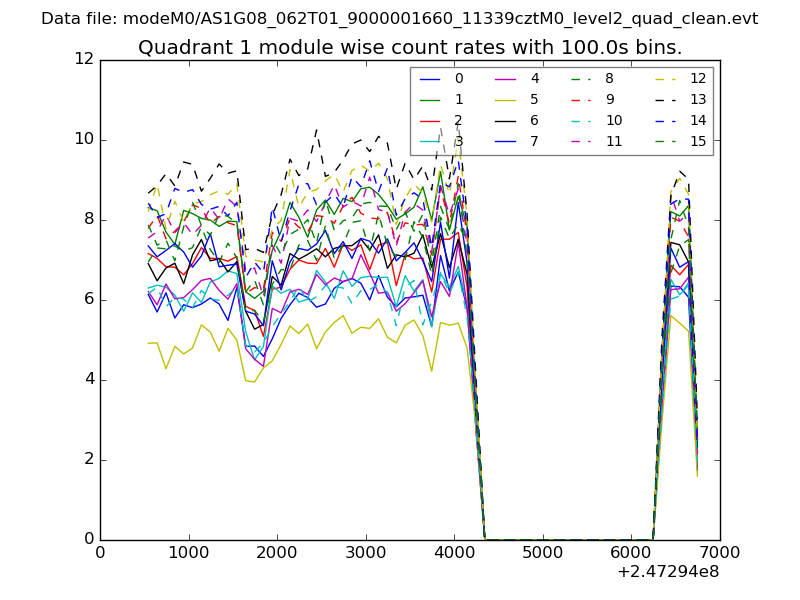
| Module-wise count rates for Quadrant A Data is divided into 100 sec bins |
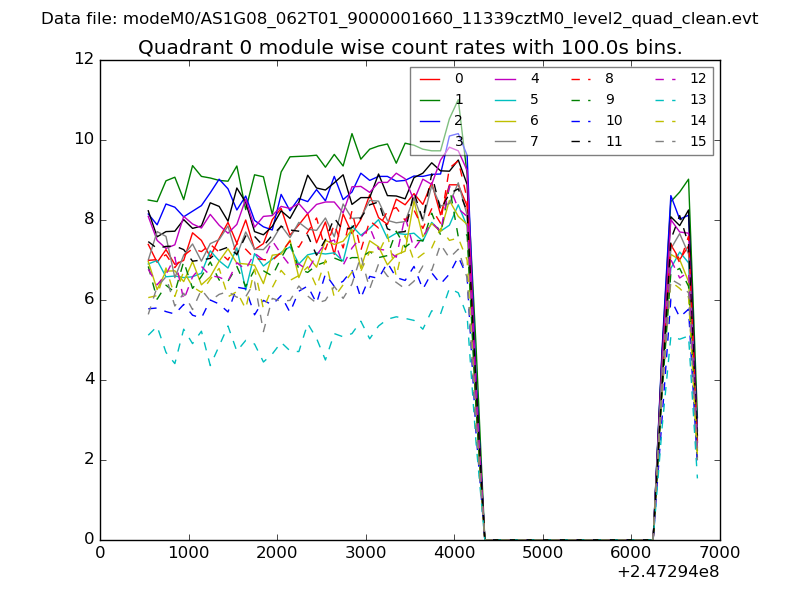 |
 |
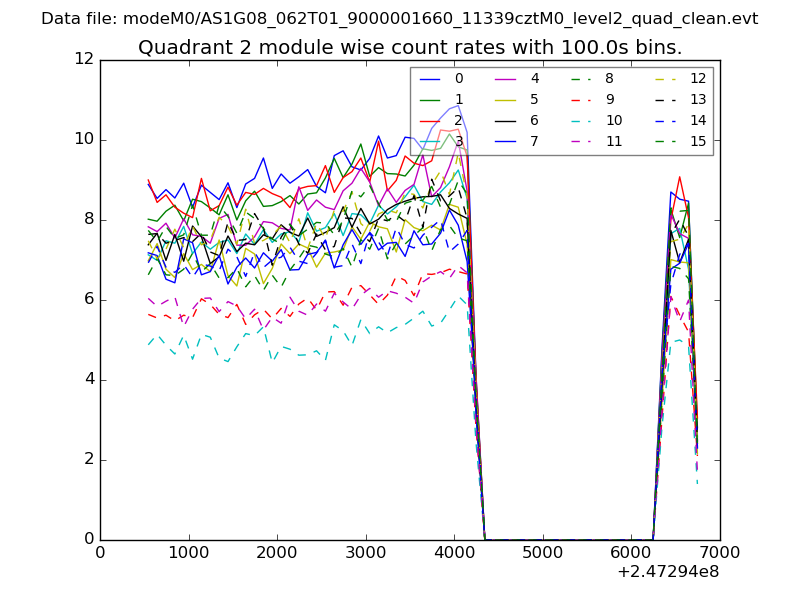
| Module-wise count rates for Quadrant B Data is divided into 100 sec bins |
 |
 |
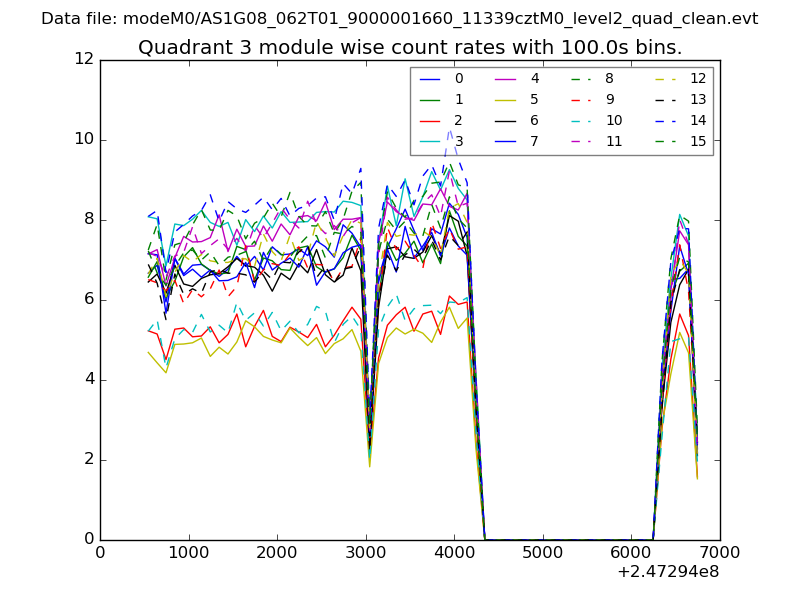
| Module-wise count rates for Quadrant C Data is divided into 100 sec bins |
 |
 |
| Module-wise count rates for Quadrant D Data is divided into 100 sec bins |
 |
 |
| Parameter | Plot |
|---|---|
| CZT HV Monitor | 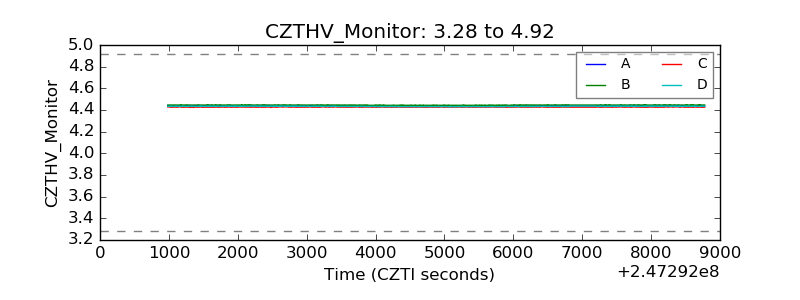 |
| D_VDD | 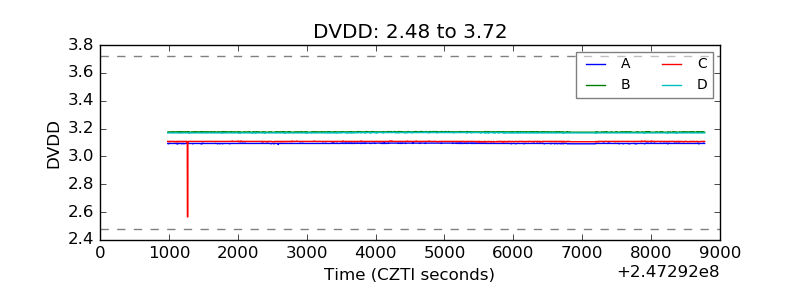 |
| Temperature 1 |  |
| Veto HV Monitor | 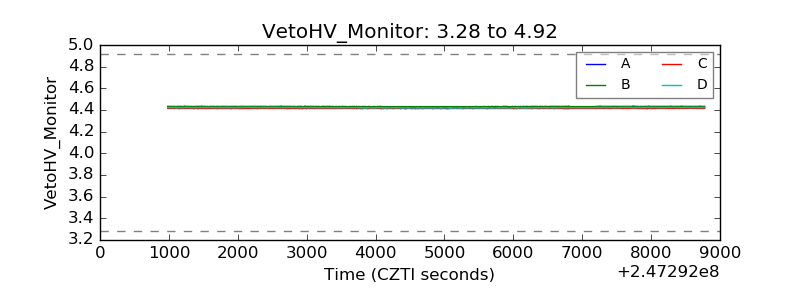 |
| Veto LLD |  |
| Alpha Counter | 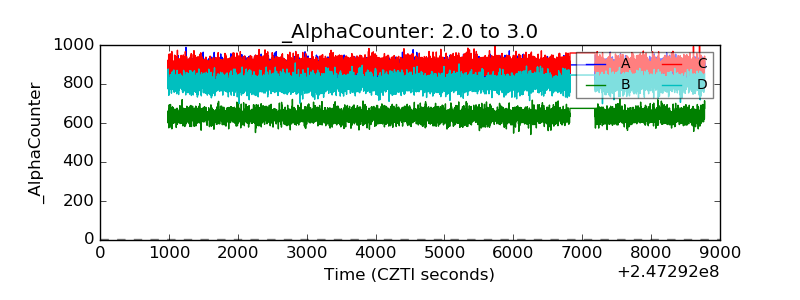 |
| _CPM_Rate | 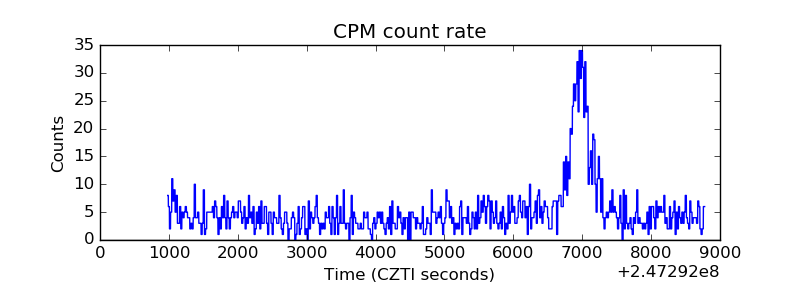 |
| CZT Counter | 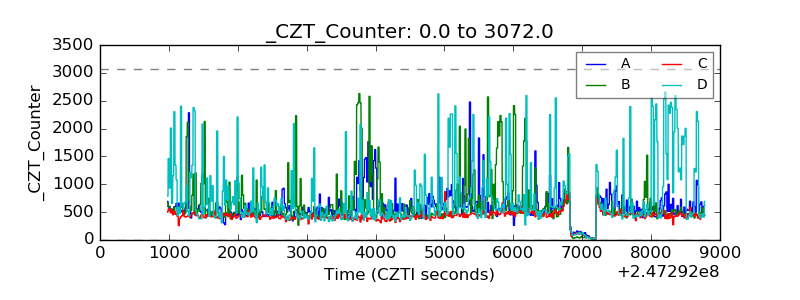 |
| +2.5 Volts monitor |  |
| +5 Volts monitor |  |
| _ROLL_ROT | 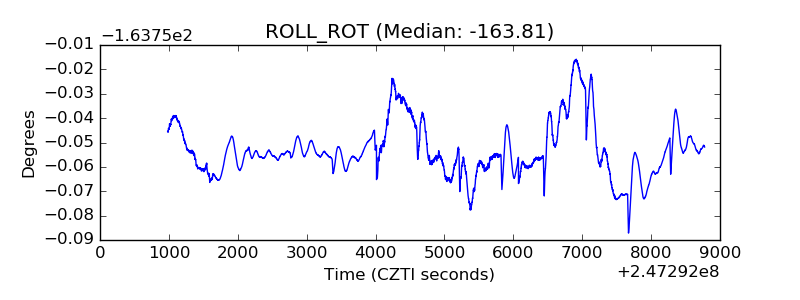 |
| _Roll_DEC | 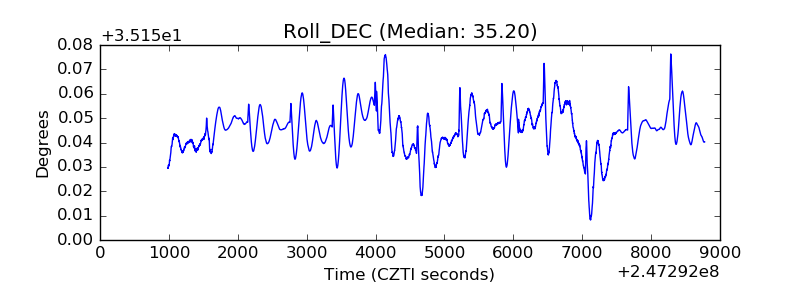 |
| _Roll_RA | 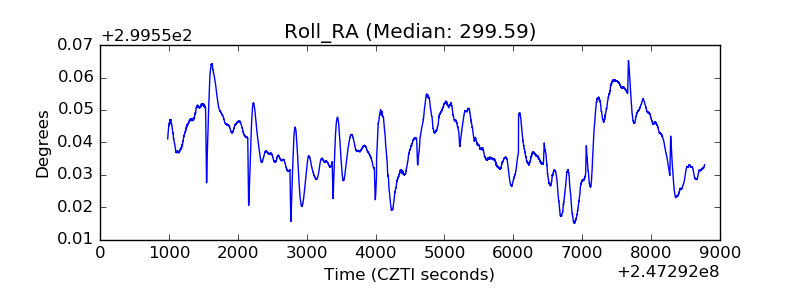 |
| Veto Counter | 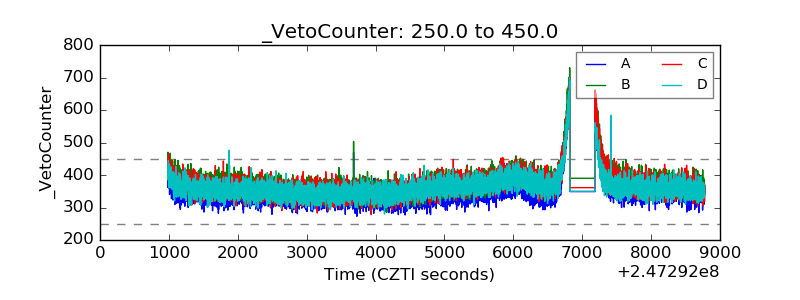 |