| Param | Original file | Final file |
|---|---|---|
| Filename | modeM0/AS1G08_062T01_9000001660_11341cztM0_level2.evt | modeM0/AS1G08_062T01_9000001660_11341cztM0_level2_quad_clean.evt |
| Size (bytes) | 1,107,915,840 | 161,550,720 |
| Size | 1.0 GB | 154.1 MB |
| Events in quadrant A | 7,713,331 | 1,024,264 |
| Events in quadrant B | 9,063,166 | 997,906 |
| Events in quadrant C | 5,725,619 | 1,028,949 |
| Events in quadrant D | 10,182,296 | 951,667 |
| Mode M0 | |||
|---|---|---|---|
| Quadrant | BADHDUFLAG | Total packets | Discarded packets |
| A | 0 | 31199 | 4 |
| B | 0 | 35305 | 3 |
| C | 0 | 26143 | 3 |
| D | 0 | 38944 | 3 |
| Mode SS | |||
|---|---|---|---|
| Quadrant | BADHDUFLAG | Total packets | Discarded packets |
| A | 0 | 262 | 0 |
| B | 0 | 262 | 0 |
| C | 0 | 262 | 0 |
| D | 0 | 262 | 0 |
| Mode M9 | |||
|---|---|---|---|
| Quadrant | BADHDUFLAG | Total packets | Discarded packets |
| A | 0 | 13 | 0 |
| B | 0 | 13 | 0 |
| C | 0 | 13 | 0 |
| D | 0 | 13 | 0 |
| Quadrant | Total seconds | Saturated seconds | Saturation percentage |
|---|---|---|---|
| A | 12867 | 345 | 2.681278% |
| B | 12867 | 915 | 7.111215% |
| C | 12867 | 94 | 0.730551% |
| D | 12868 | 1139 | 8.851414% |
Noise dominated data is calculated using 1-second bins in cleaned event files. If a bin has >2000 counts, and if more than 50% of those come from <1% of pixels, then it is considered to be noise-dominated and hence unusable.
| Quadrant | # 1 sec bins | Bins with >0 counts | Bins with >2000 counts | High rate bins dominated by noise | Noise dominated (total time) | Noise dominated (detector-on time) | Marked lightcurve |
|---|---|---|---|---|---|---|---|
| A | 14117 | 12869 | 112 | 112 | 0.79% | 0.87% |  |
| B | 14117 | 12869 | 534 | 534 | 3.78% | 4.15% | 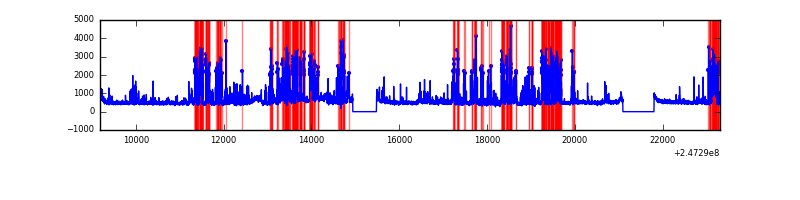 |
| C | 14117 | 12869 | 0 | 0 | 0.00% | 0.00% | 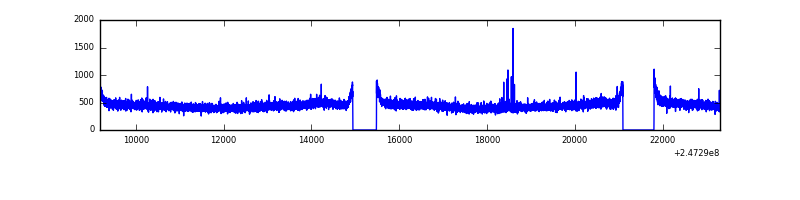 |
| D | 14118 | 12870 | 885 | 885 | 6.27% | 6.88% | 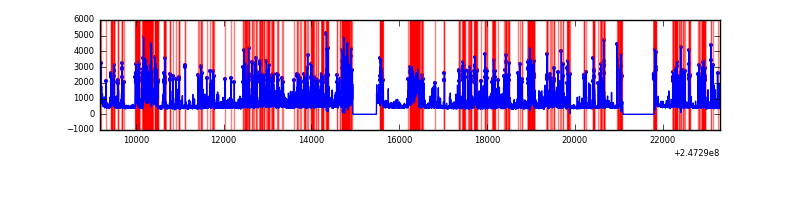 |
Top three noisy pixels from each quadrant. If the there are fewer than three noisy pixels in the level2.evt file, extra rows are filled as -1
| Pixel properties | Quadrant properties | ||||||
|---|---|---|---|---|---|---|---|
| Quadrant | DetID | PixID | Counts | Sigma | Mean | Median | Sigma |
| A | 13 | 251 | 1778347 | 5820.96 | 1499 | 1465 | 305.3 |
| A | 1 | 162 | 56017 | 178.71 | 1499 | 1465 | 305.3 |
| A | 1 | 178 | 33473 | 104.86 | 1499 | 1465 | 305.3 |
| B | 4 | 239 | 2468211 | 8712.5 | 1474 | 1433 | 283.1 |
| B | 4 | 81 | 363326 | 1278.18 | 1474 | 1433 | 283.1 |
| B | 3 | 64 | 348873 | 1227.13 | 1474 | 1433 | 283.1 |
| C | 13 | 61 | 10801 | 27.43 | 1463 | 1468 | 340.2 |
| C | 13 | 250 | 10466 | 26.45 | 1463 | 1468 | 340.2 |
| C | 14 | 234 | 10041 | 25.2 | 1463 | 1468 | 340.2 |
| D | 10 | 253 | 1191507 | 3527.17 | 1403 | 1366 | 337.4 |
| D | 2 | 14 | 1097951 | 3249.9 | 1403 | 1366 | 337.4 |
| D | 1 | 52 | 858418 | 2540.01 | 1403 | 1366 | 337.4 |
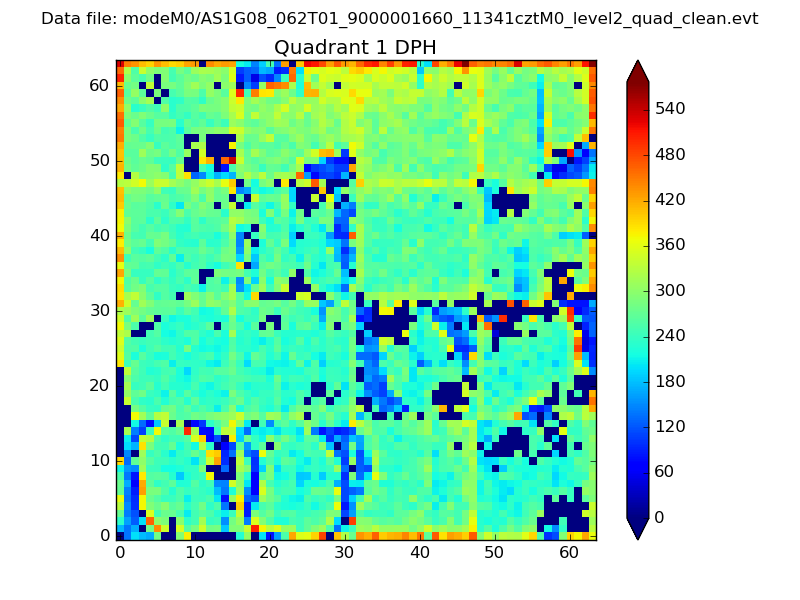
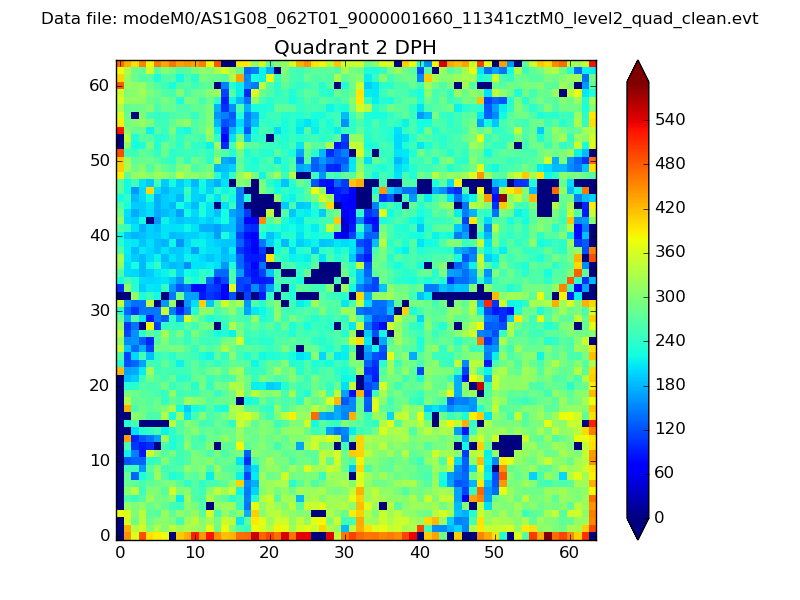
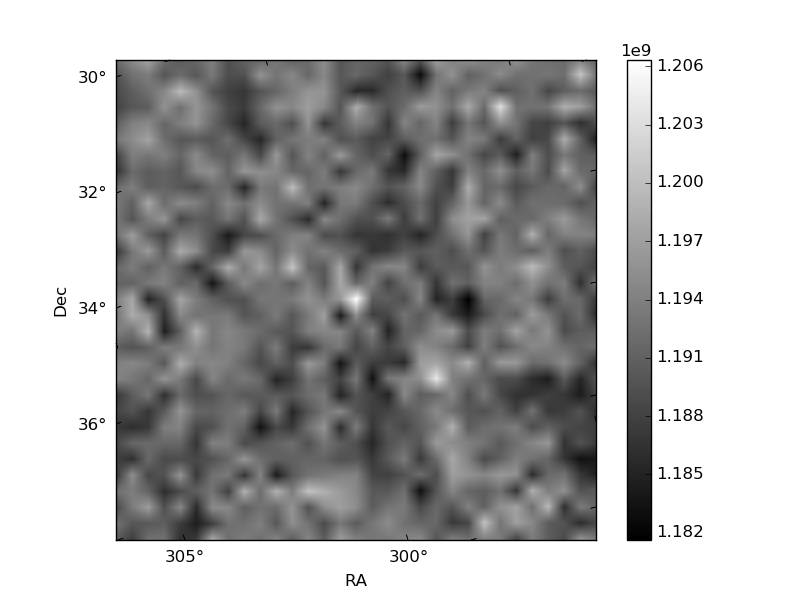
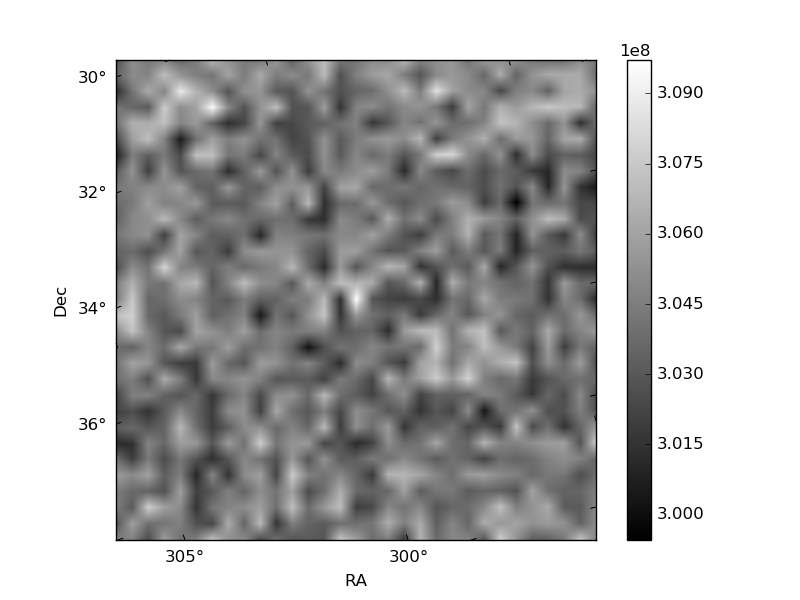
Histogram calculated using DETX and DETY for each event in the final _common_clean file
| Quadrant A | 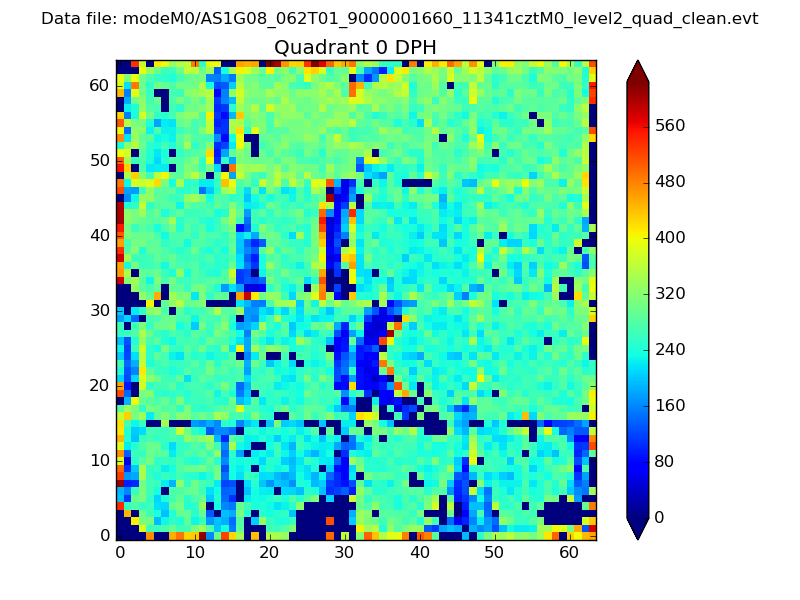 |
 |
Quadrant B |
|---|---|---|---|
| Quadrant D | 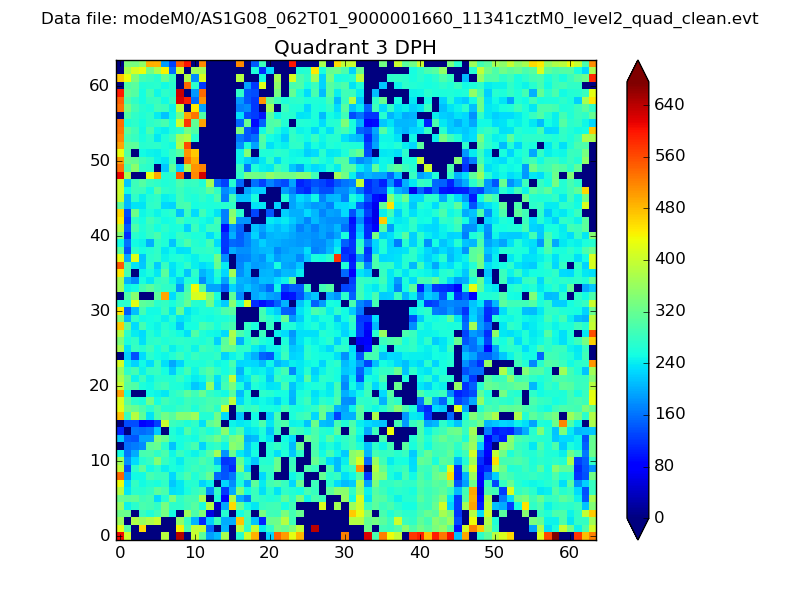 |
 |
Quadrant C |
| Plot type | Count rate plots | Images |
|---|---|---|
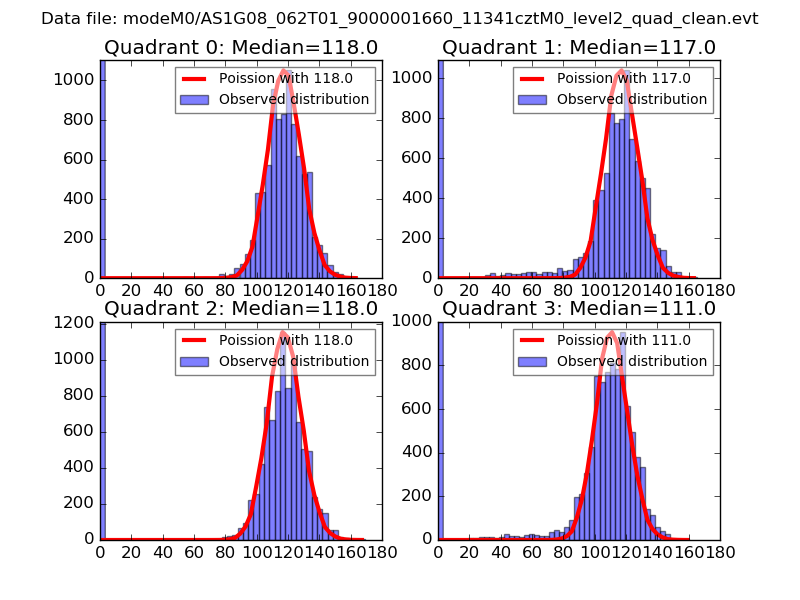
| Comparison with Poisson distribution Blue bars denote a histogram of data divided into 1 sec bins. Red curve is a Poisson curve with rate = median count rate of data. |
 |
 |
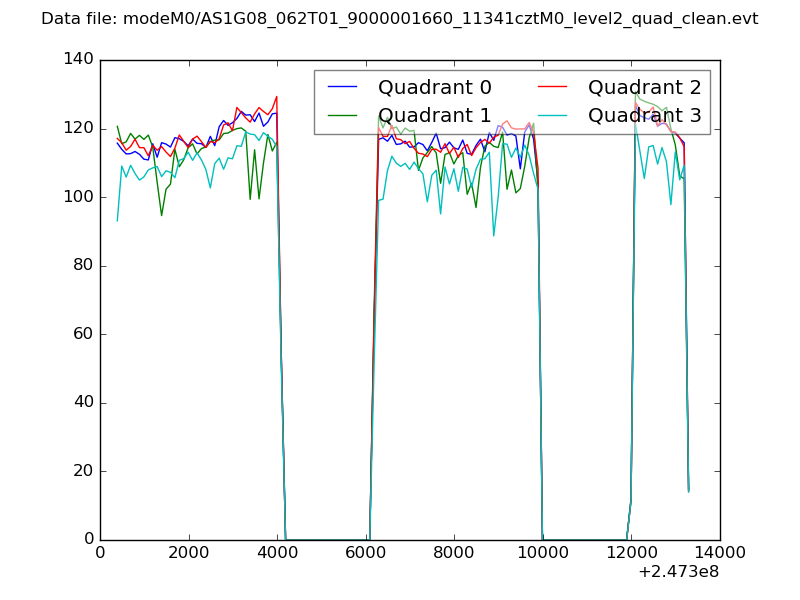
| Quadrant-wise count rates Data is divided into 100 sec bins |
 |
|
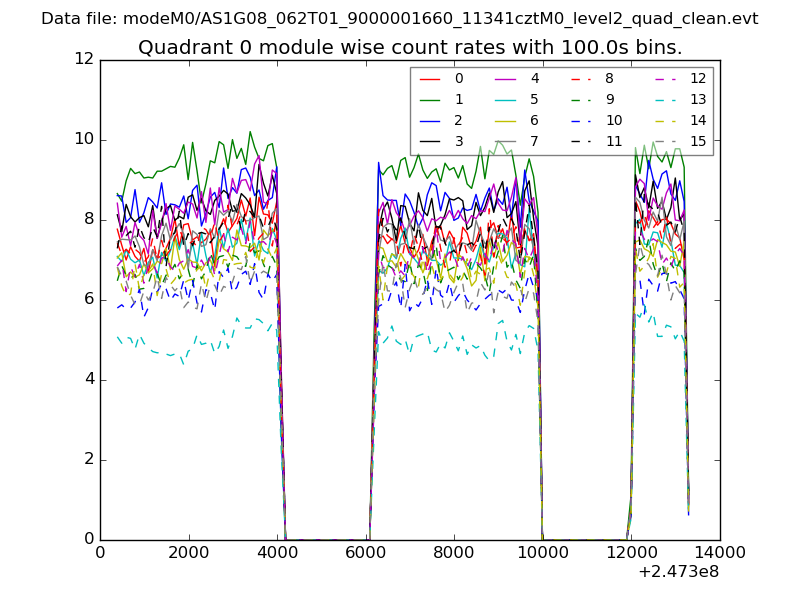
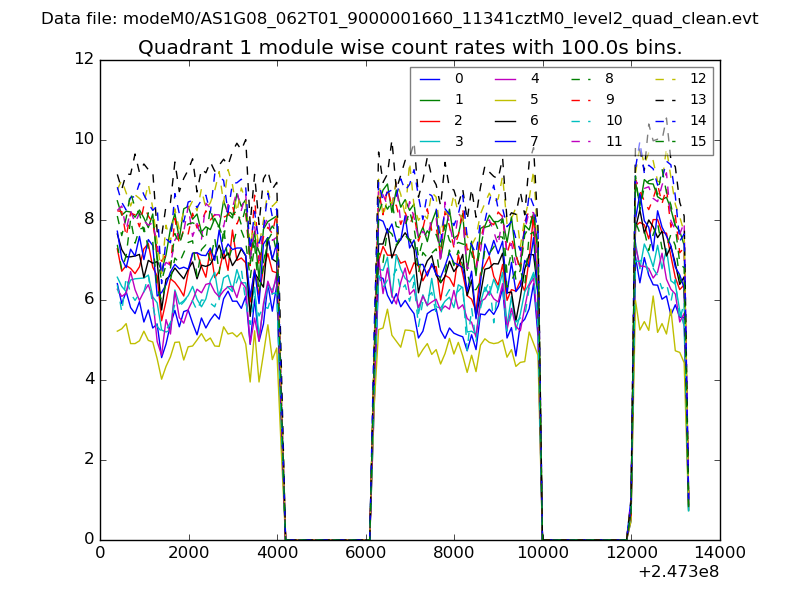
| Module-wise count rates for Quadrant A Data is divided into 100 sec bins |
 |
 |
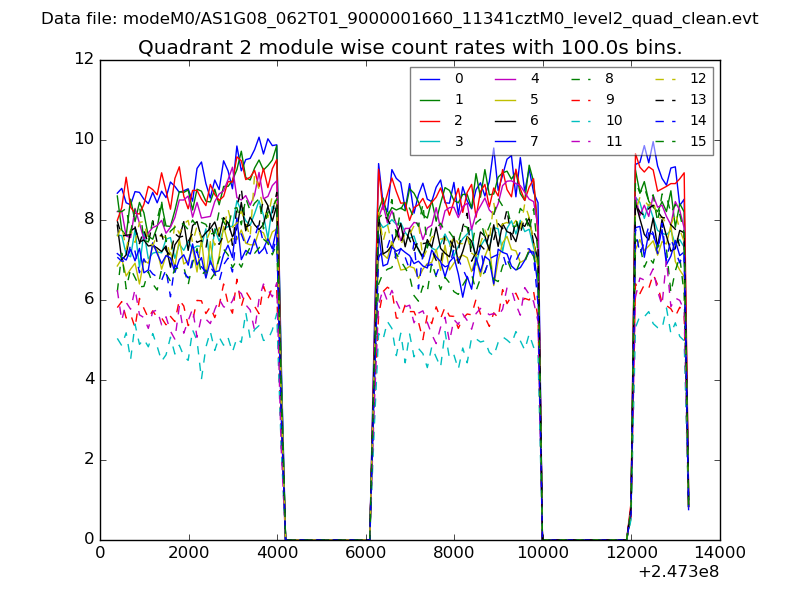
| Module-wise count rates for Quadrant B Data is divided into 100 sec bins |
 |
 |
| Module-wise count rates for Quadrant C Data is divided into 100 sec bins |
 |
 |
| Module-wise count rates for Quadrant D Data is divided into 100 sec bins |
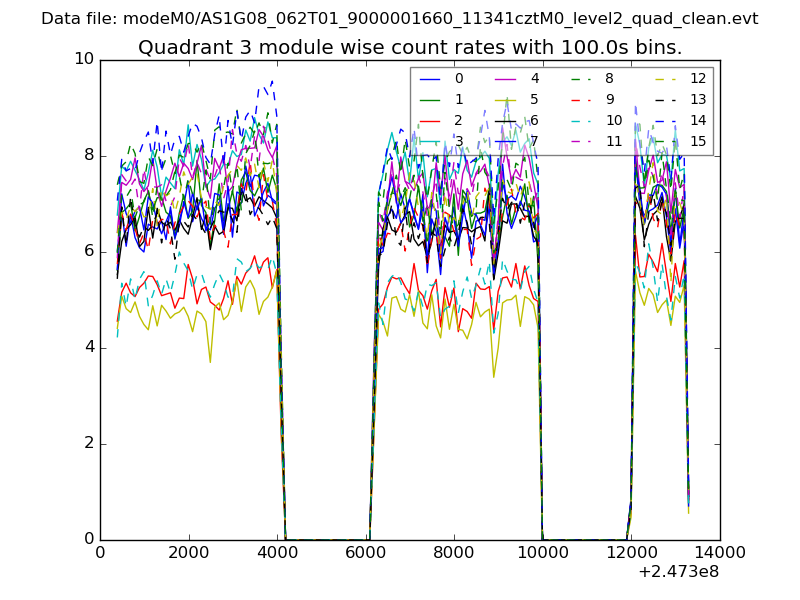 |
 |
| Parameter | Plot |
|---|---|
| CZT HV Monitor | 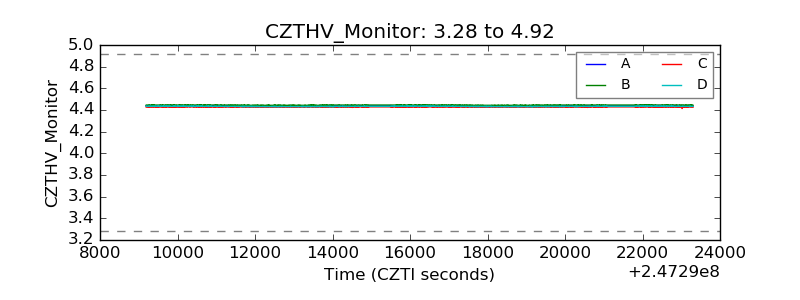 |
| D_VDD | 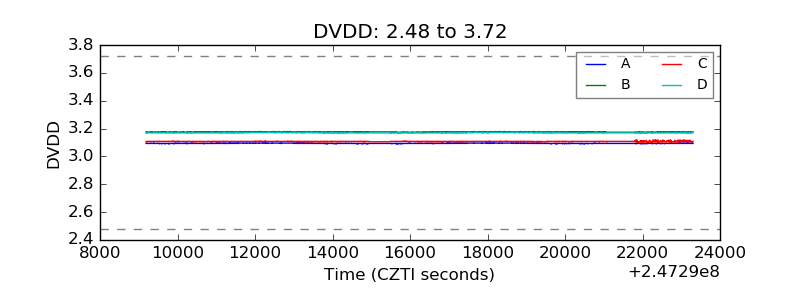 |
| Temperature 1 | 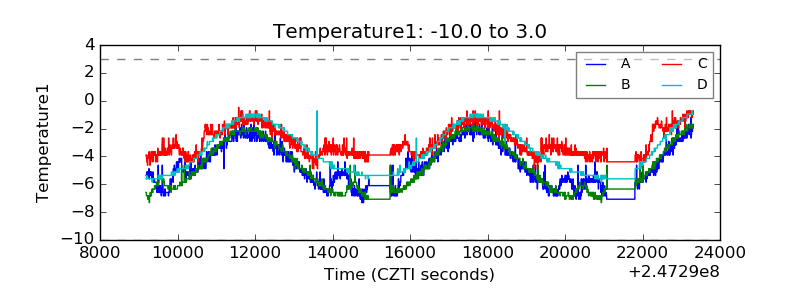 |
| Veto HV Monitor | 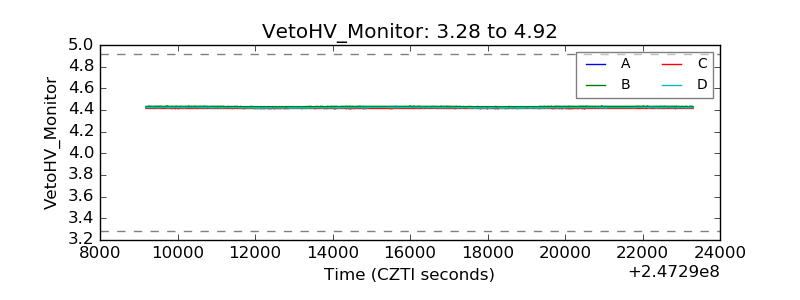 |
| Veto LLD | 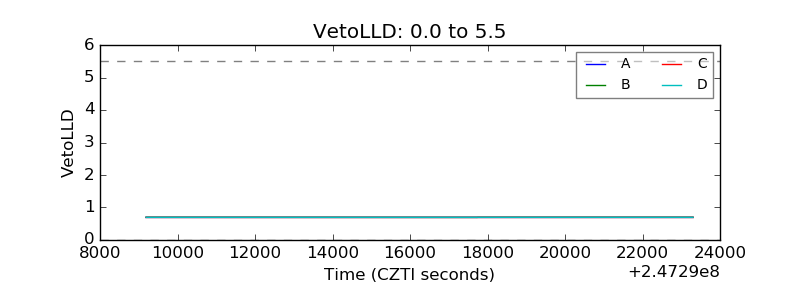 |
| Alpha Counter | 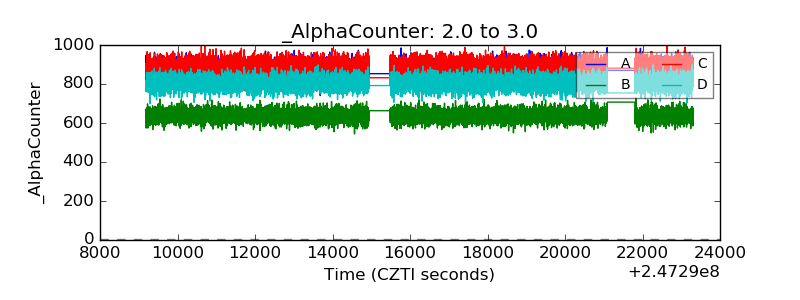 |
| _CPM_Rate | 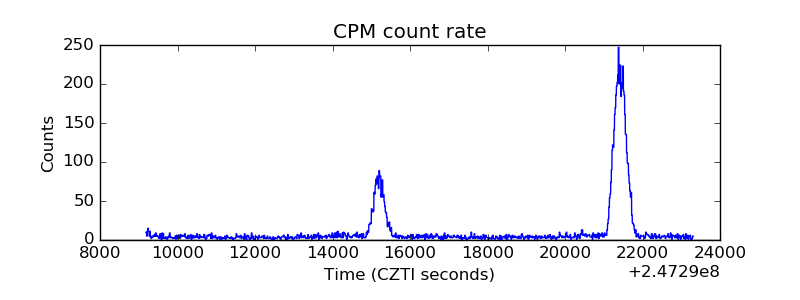 |
| CZT Counter | 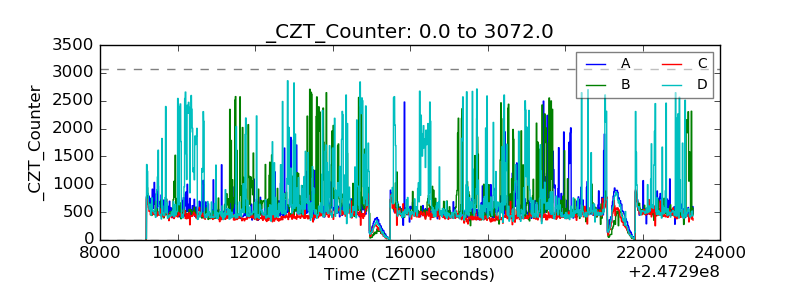 |
| +2.5 Volts monitor | 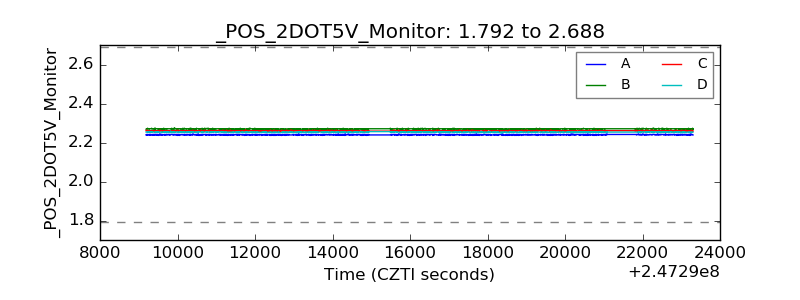 |
| +5 Volts monitor |  |
| _ROLL_ROT |  |
| _Roll_DEC | 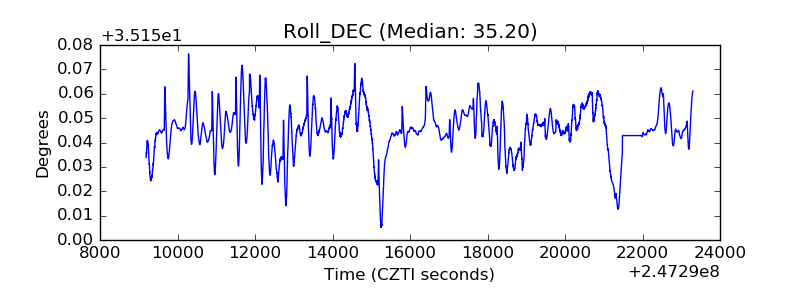 |
| _Roll_RA | 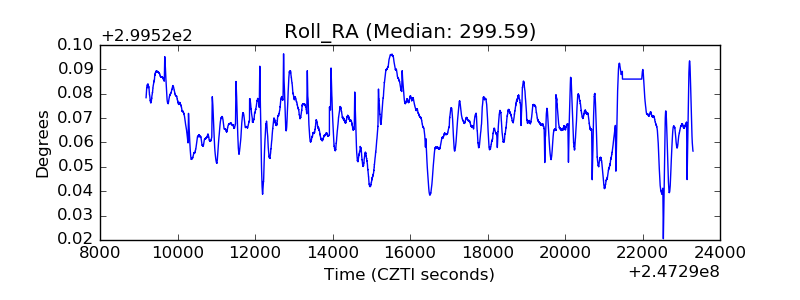 |
| Veto Counter | 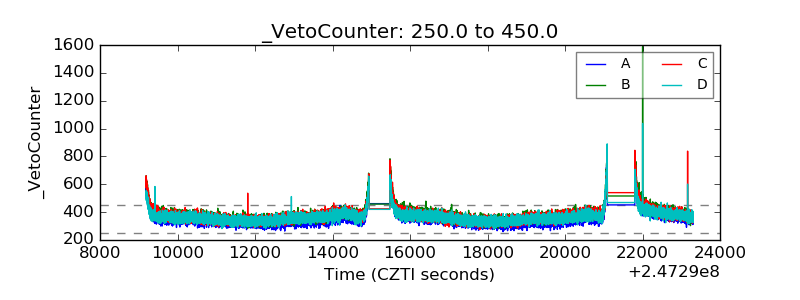 |