| Param | Original file | Final file |
|---|---|---|
| Filename | modeM0/AS1G08_062T01_9000001660_11342cztM0_level2.evt | modeM0/AS1G08_062T01_9000001660_11342cztM0_level2_quad_clean.evt |
| Size (bytes) | 584,196,480 | 81,973,440 |
| Size | 557.1 MB | 78.2 MB |
| Events in quadrant A | 3,946,242 | 544,630 |
| Events in quadrant B | 4,352,661 | 527,842 |
| Events in quadrant C | 2,608,951 | 545,512 |
| Events in quadrant D | 6,381,889 | 448,737 |
| Mode M0 | |||
|---|---|---|---|
| Quadrant | BADHDUFLAG | Total packets | Discarded packets |
| A | 0 | 15681 | 2 |
| B | 0 | 16832 | 1 |
| C | 0 | 12009 | 1 |
| D | 0 | 22984 | 1 |
| Mode SS | |||
|---|---|---|---|
| Quadrant | BADHDUFLAG | Total packets | Discarded packets |
| A | 0 | 122 | 0 |
| B | 0 | 122 | 0 |
| C | 0 | 122 | 0 |
| D | 0 | 122 | 0 |
| Mode M9 | |||
|---|---|---|---|
| Quadrant | BADHDUFLAG | Total packets | Discarded packets |
| A | 0 | 9 | 0 |
| B | 0 | 9 | 0 |
| C | 0 | 9 | 0 |
| D | 0 | 9 | 0 |
| Quadrant | Total seconds | Saturated seconds | Saturation percentage |
|---|---|---|---|
| A | 5936 | 137 | 2.307951% |
| B | 5936 | 503 | 8.473720% |
| C | 5936 | 37 | 0.623315% |
| D | 5936 | 1309 | 22.051887% |
Noise dominated data is calculated using 1-second bins in cleaned event files. If a bin has >2000 counts, and if more than 50% of those come from <1% of pixels, then it is considered to be noise-dominated and hence unusable.
| Quadrant | # 1 sec bins | Bins with >0 counts | Bins with >2000 counts | High rate bins dominated by noise | Noise dominated (total time) | Noise dominated (detector-on time) | Marked lightcurve |
|---|---|---|---|---|---|---|---|
| A | 6866 | 5937 | 48 | 48 | 0.70% | 0.81% | 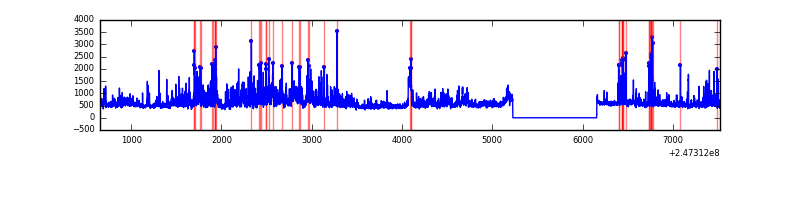 |
| B | 6866 | 5937 | 323 | 323 | 4.70% | 5.44% | 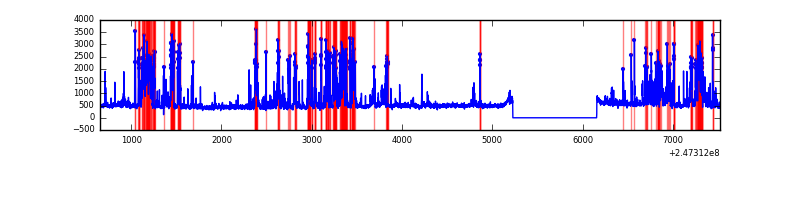 |
| C | 6866 | 5937 | 0 | 0 | 0.00% | 0.00% | 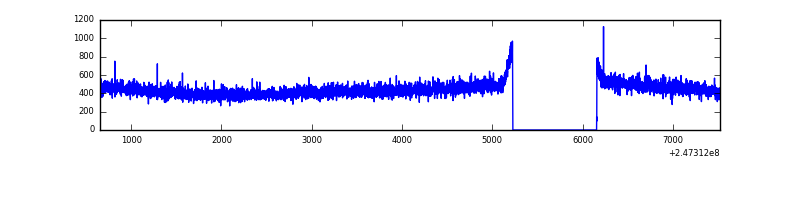 |
| D | 6866 | 5937 | 1015 | 1015 | 14.78% | 17.10% | 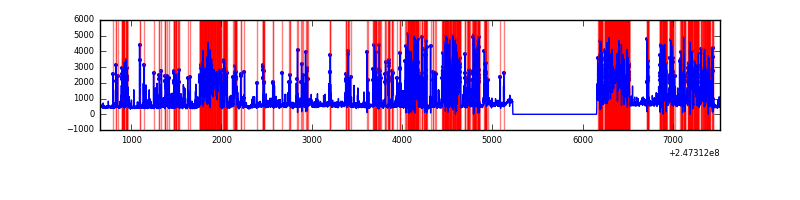 |
Top three noisy pixels from each quadrant. If the there are fewer than three noisy pixels in the level2.evt file, extra rows are filled as -1
| Pixel properties | Quadrant properties | ||||||
|---|---|---|---|---|---|---|---|
| Quadrant | DetID | PixID | Counts | Sigma | Mean | Median | Sigma |
| A | 13 | 251 | 1194717 | 8431.62 | 687 | 672 | 141.6 |
| A | 13 | 210 | 36828 | 255.31 | 687 | 672 | 141.6 |
| A | 1 | 162 | 23166 | 158.84 | 687 | 672 | 141.6 |
| B | 4 | 239 | 1484744 | 11320.18 | 669 | 651 | 131.1 |
| B | 3 | 64 | 107545 | 815.35 | 669 | 651 | 131.1 |
| B | 4 | 81 | 47708 | 358.94 | 669 | 651 | 131.1 |
| C | 13 | 61 | 5005 | 27.87 | 668 | 670 | 155.5 |
| C | 13 | 250 | 2104 | 9.22 | 668 | 670 | 155.5 |
| C | 14 | 234 | 1998 | 8.54 | 668 | 670 | 155.5 |
| D | 1 | 52 | 1509376 | 10785.58 | 582 | 565 | 139.9 |
| D | 13 | 152 | 926239 | 6617.09 | 582 | 565 | 139.9 |
| D | 10 | 253 | 897712 | 6413.17 | 582 | 565 | 139.9 |
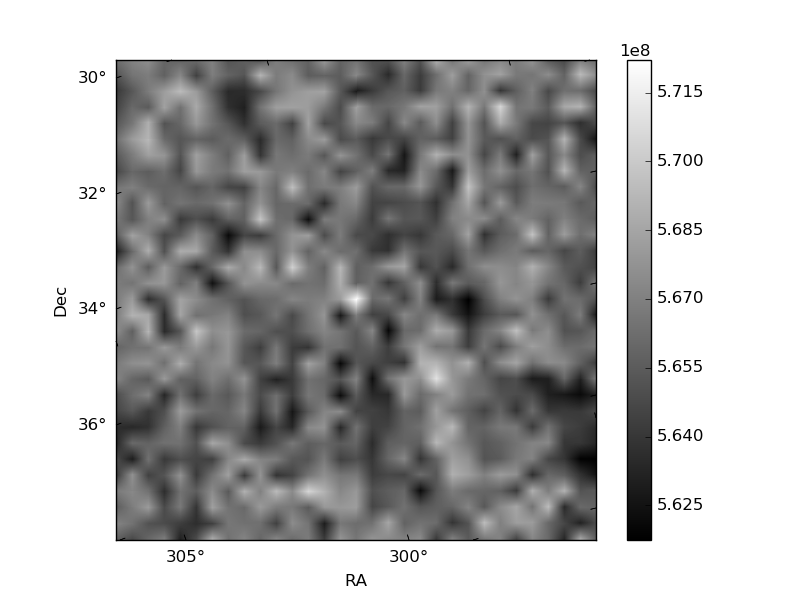
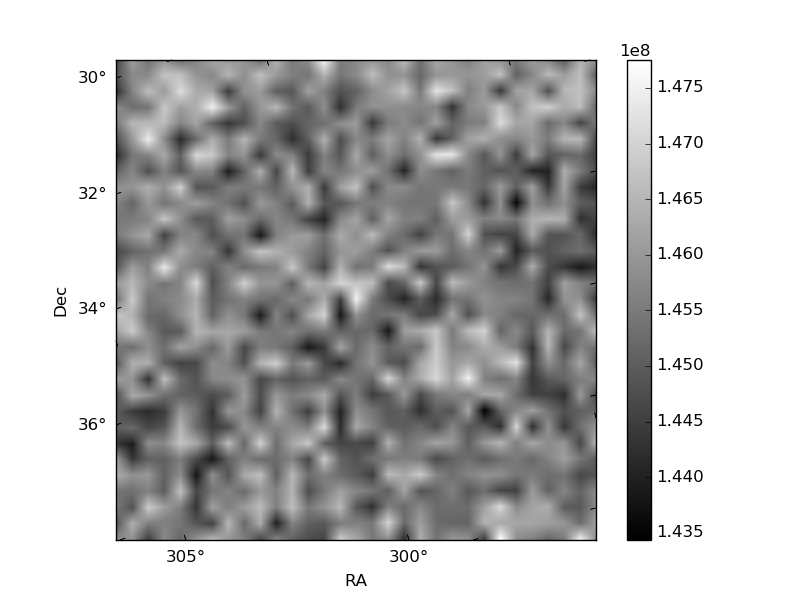
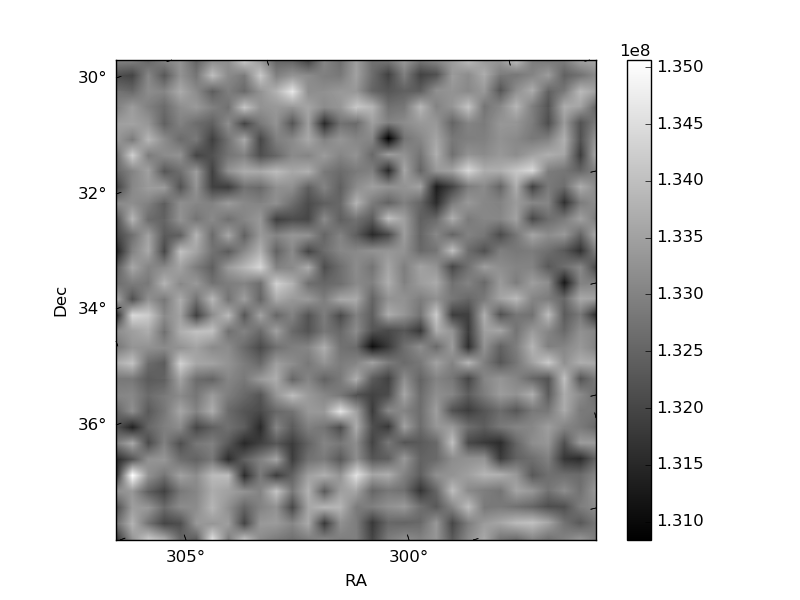
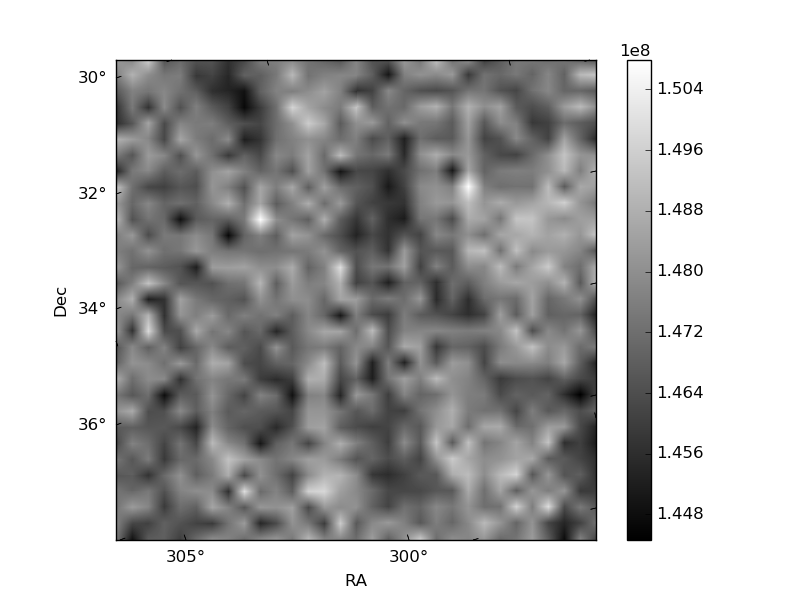
Histogram calculated using DETX and DETY for each event in the final _common_clean file
| Quadrant A | 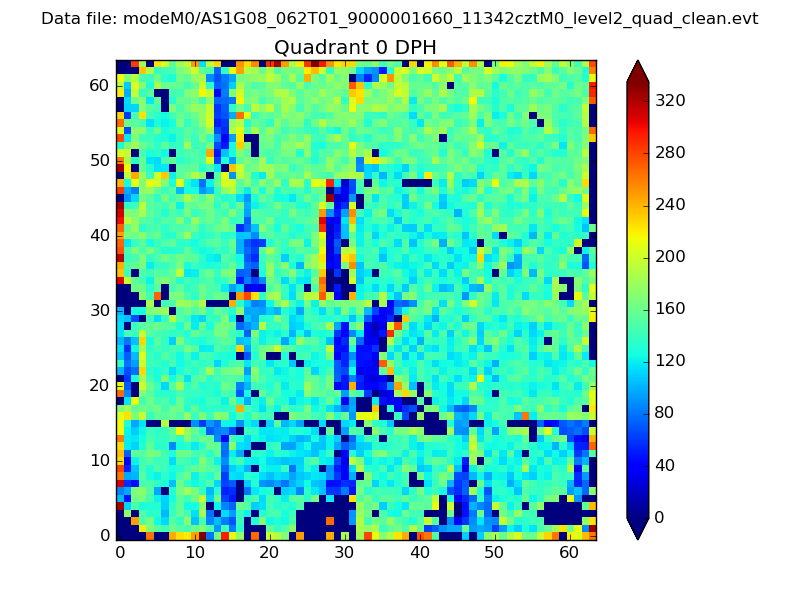 |
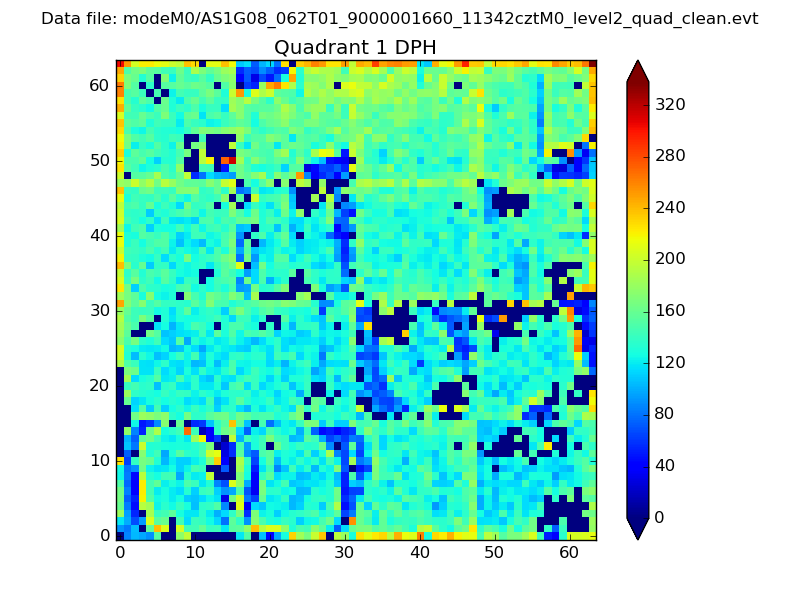 |
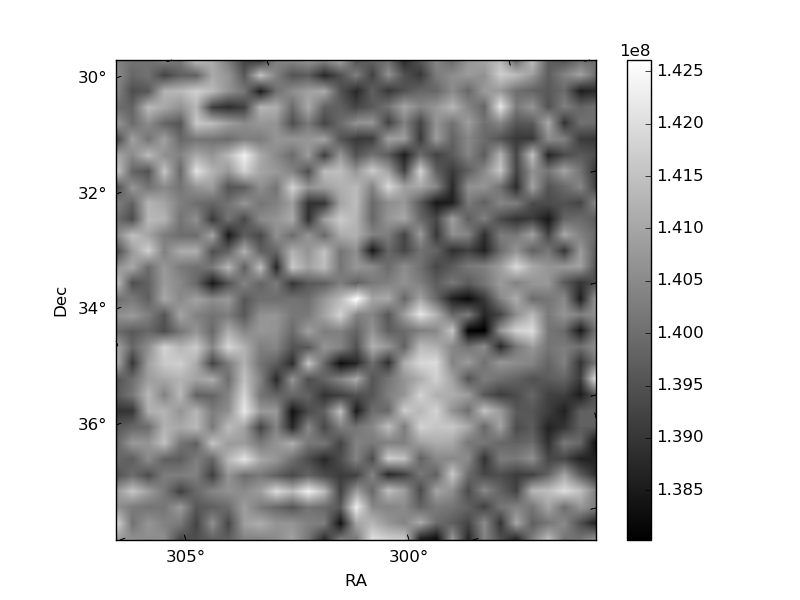
Quadrant B |
|---|---|---|---|
| Quadrant D | 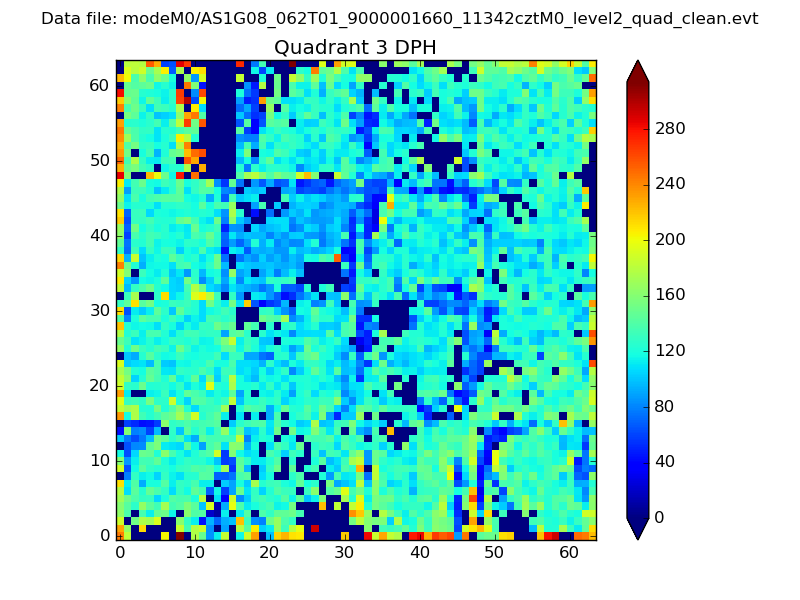 |
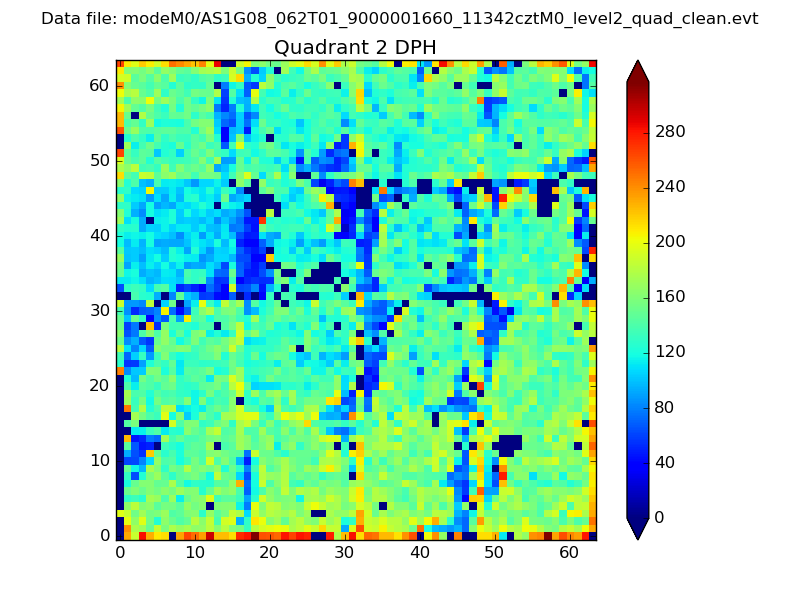 |
Quadrant C |
| Plot type | Count rate plots | Images |
|---|---|---|
| Comparison with Poisson distribution Blue bars denote a histogram of data divided into 1 sec bins. Red curve is a Poisson curve with rate = median count rate of data. |
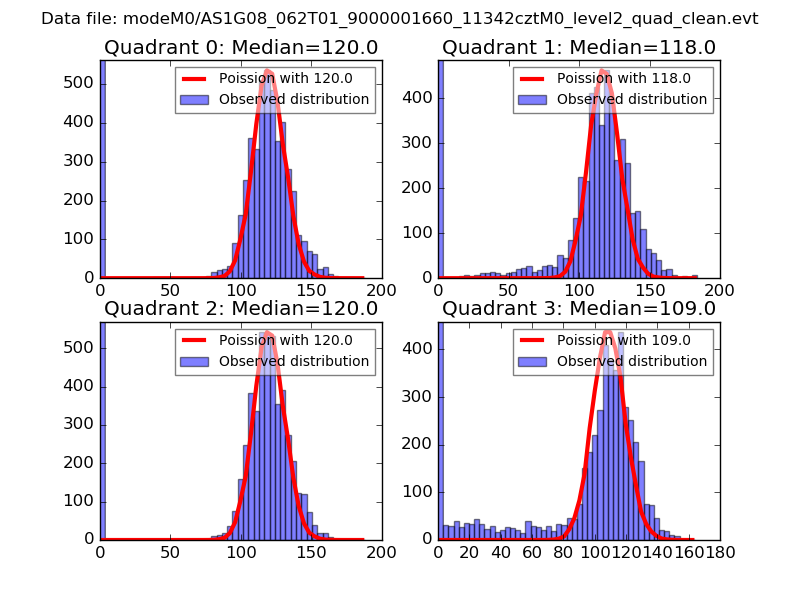 |
 |
| Quadrant-wise count rates Data is divided into 100 sec bins |
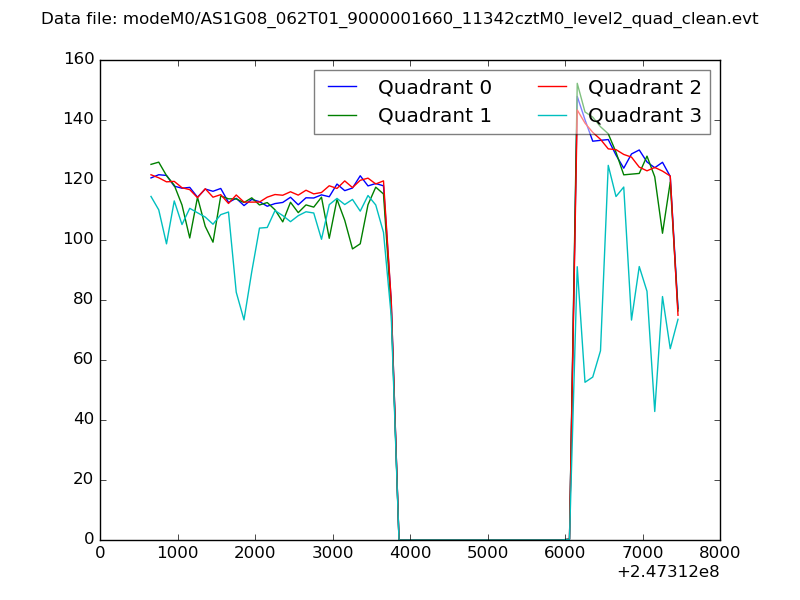 |
|
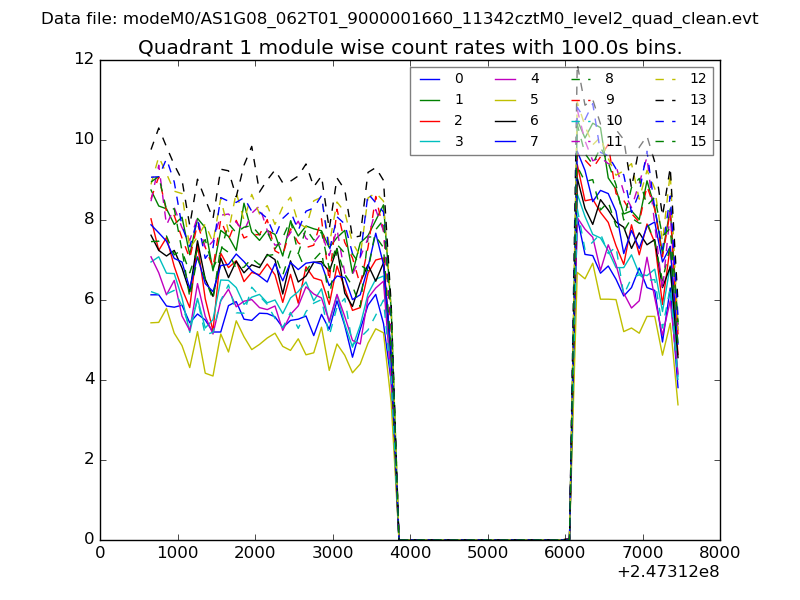
| Module-wise count rates for Quadrant A Data is divided into 100 sec bins |
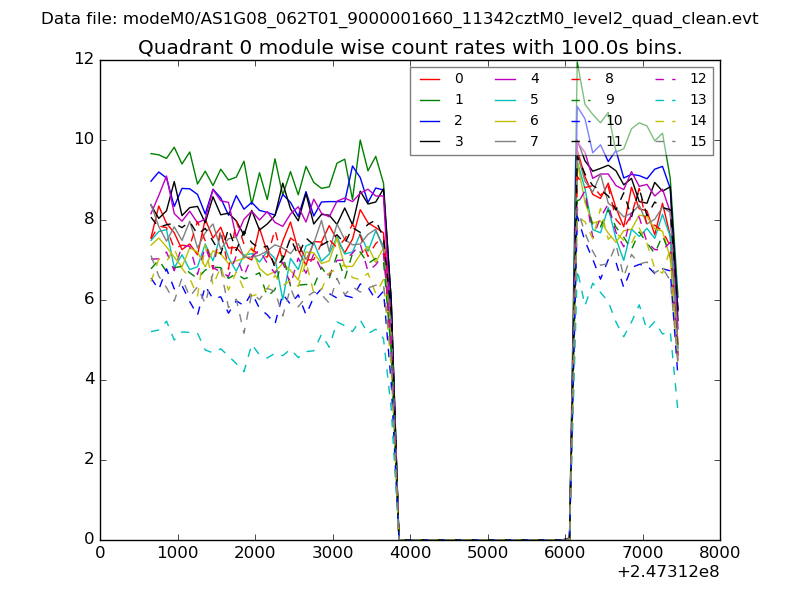 |
 |
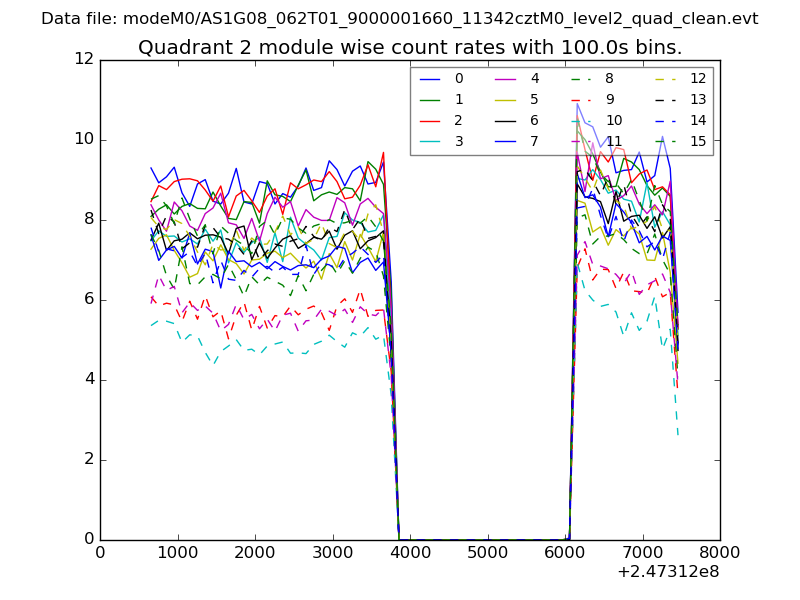
| Module-wise count rates for Quadrant B Data is divided into 100 sec bins |
 |
 |
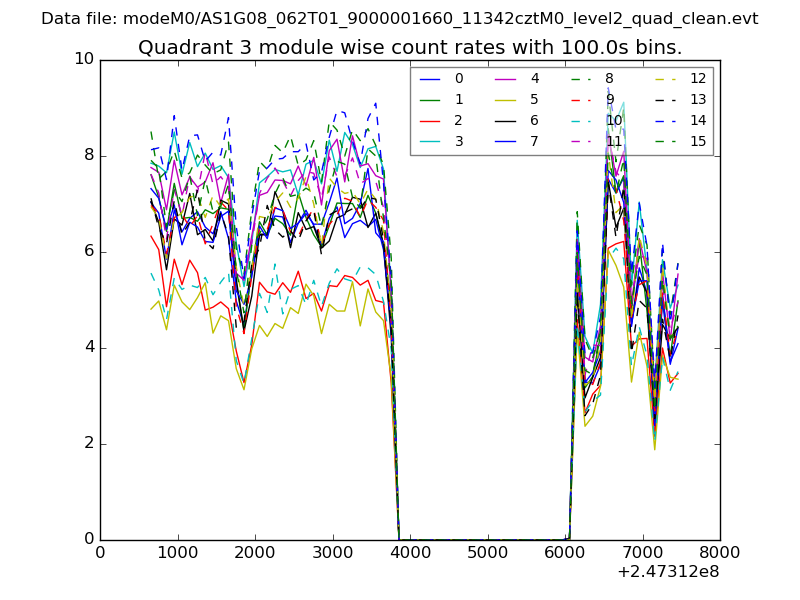
| Module-wise count rates for Quadrant C Data is divided into 100 sec bins |
 |
 |
| Module-wise count rates for Quadrant D Data is divided into 100 sec bins |
 |
 |
| Parameter | Plot |
|---|---|
| CZT HV Monitor | 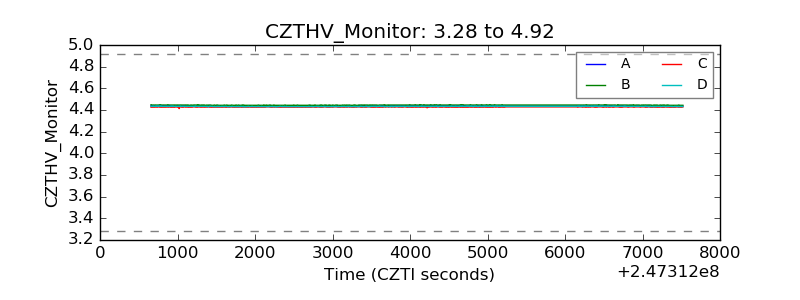 |
| D_VDD | 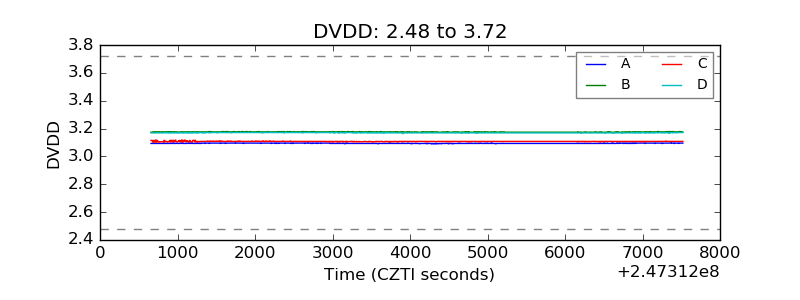 |
| Temperature 1 | 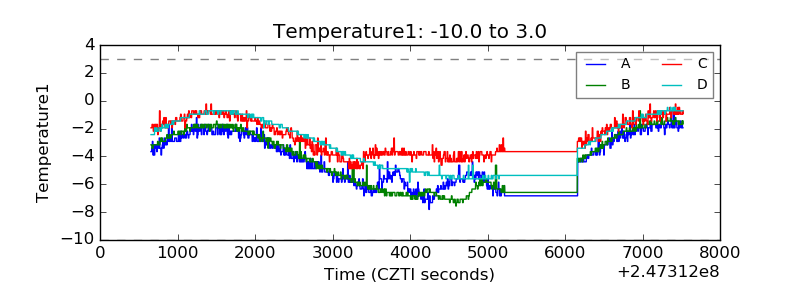 |
| Veto HV Monitor | 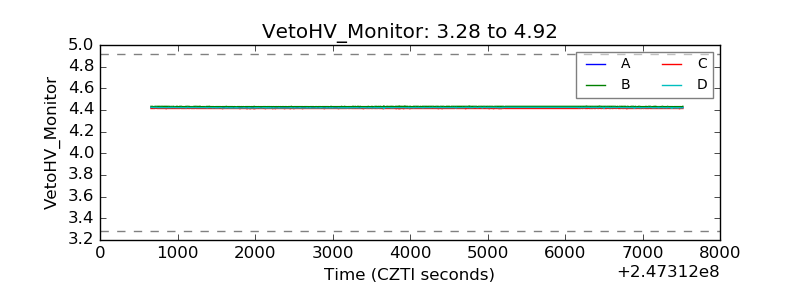 |
| Veto LLD | 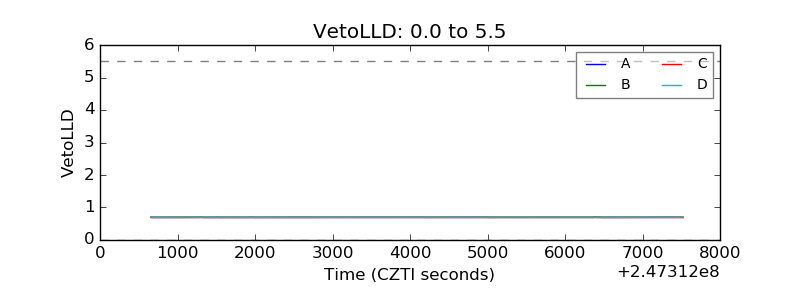 |
| Alpha Counter | 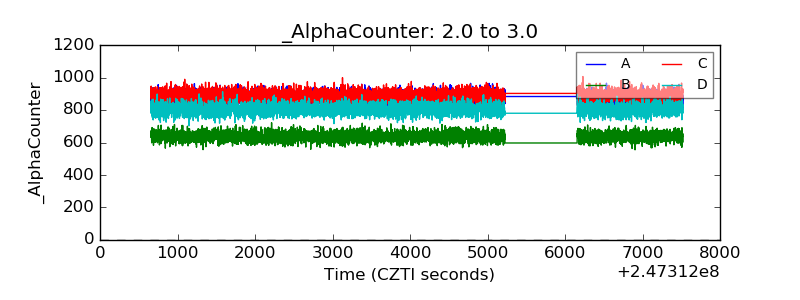 |
| _CPM_Rate | 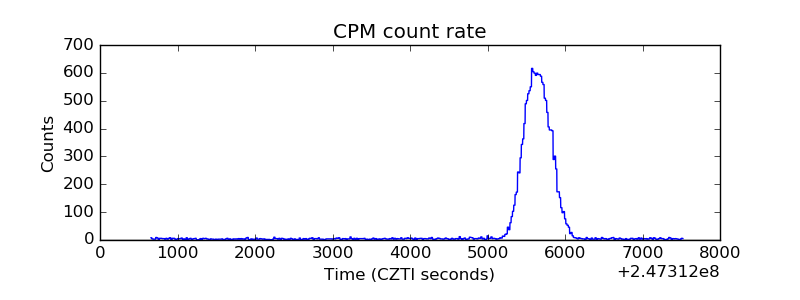 |
| CZT Counter | 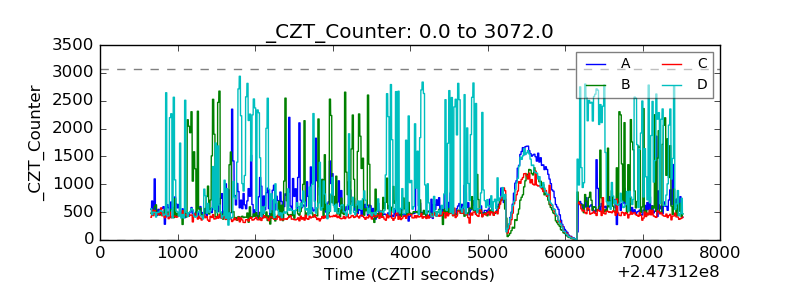 |
| +2.5 Volts monitor |  |
| +5 Volts monitor | 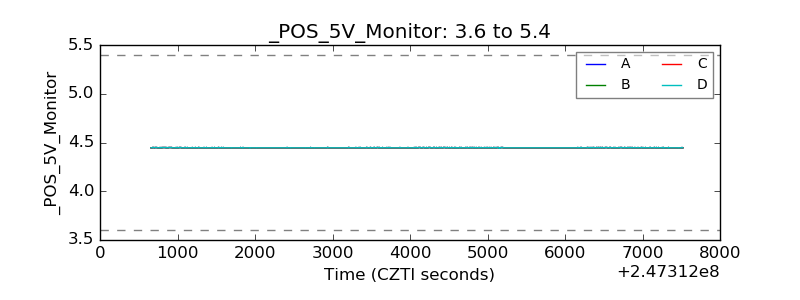 |
| _ROLL_ROT | 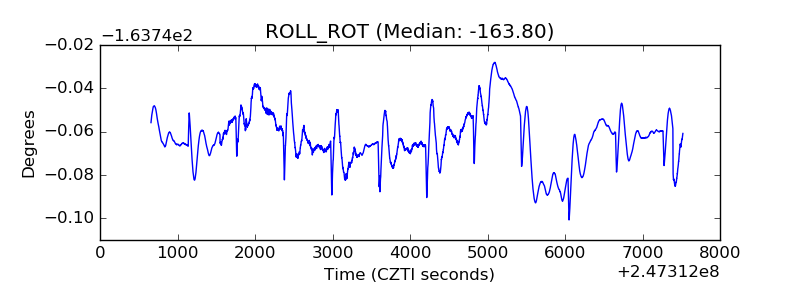 |
| _Roll_DEC | 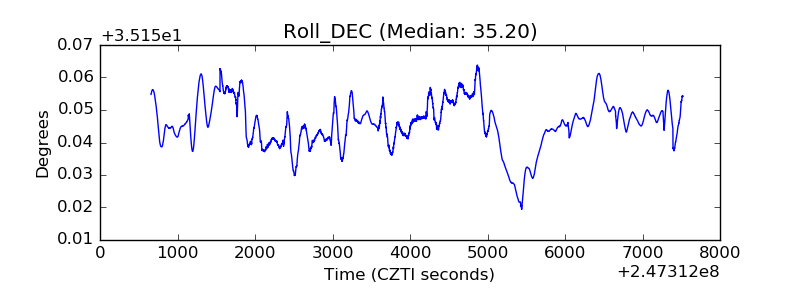 |
| _Roll_RA | 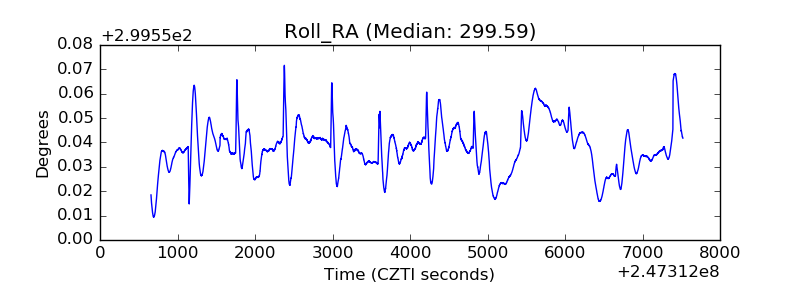 |
| Veto Counter | 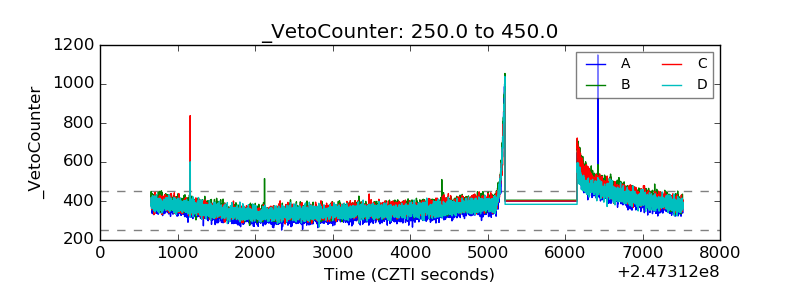 |