| Param | Original file | Final file |
|---|---|---|
| Filename | modeM0/AS1G08_062T01_9000001660_11343cztM0_level2.evt | modeM0/AS1G08_062T01_9000001660_11343cztM0_level2_quad_clean.evt |
| Size (bytes) | 622,906,560 | 90,552,960 |
| Size | 594.0 MB | 86.4 MB |
| Events in quadrant A | 4,575,174 | 592,883 |
| Events in quadrant B | 4,790,945 | 581,054 |
| Events in quadrant C | 2,885,634 | 598,655 |
| Events in quadrant D | 6,177,340 | 520,194 |
| Mode M0 | |||
|---|---|---|---|
| Quadrant | BADHDUFLAG | Total packets | Discarded packets |
| A | 0 | 17877 | 2 |
| B | 0 | 18529 | 1 |
| C | 0 | 13100 | 1 |
| D | 0 | 22710 | 1 |
| Mode SS | |||
|---|---|---|---|
| Quadrant | BADHDUFLAG | Total packets | Discarded packets |
| A | 0 | 130 | 0 |
| B | 0 | 130 | 0 |
| C | 0 | 130 | 0 |
| D | 0 | 130 | 0 |
| Mode M9 | |||
|---|---|---|---|
| Quadrant | BADHDUFLAG | Total packets | Discarded packets |
| A | 0 | 11 | 0 |
| B | 0 | 11 | 0 |
| C | 0 | 11 | 0 |
| D | 0 | 11 | 0 |
| Quadrant | Total seconds | Saturated seconds | Saturation percentage |
|---|---|---|---|
| A | 6438 | 264 | 4.100652% |
| B | 6438 | 500 | 7.766387% |
| C | 6438 | 43 | 0.667909% |
| D | 6438 | 868 | 13.482448% |
Noise dominated data is calculated using 1-second bins in cleaned event files. If a bin has >2000 counts, and if more than 50% of those come from <1% of pixels, then it is considered to be noise-dominated and hence unusable.
| Quadrant | # 1 sec bins | Bins with >0 counts | Bins with >2000 counts | High rate bins dominated by noise | Noise dominated (total time) | Noise dominated (detector-on time) | Marked lightcurve |
|---|---|---|---|---|---|---|---|
| A | 7503 | 6439 | 146 | 146 | 1.95% | 2.27% | 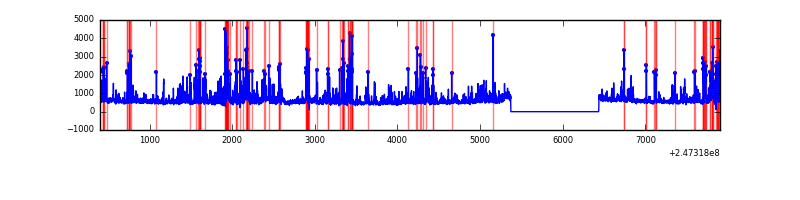 |
| B | 7503 | 6439 | 298 | 298 | 3.97% | 4.63% | 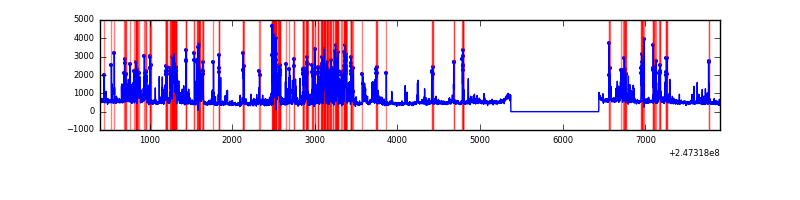 |
| C | 7503 | 6439 | 0 | 0 | 0.00% | 0.00% | 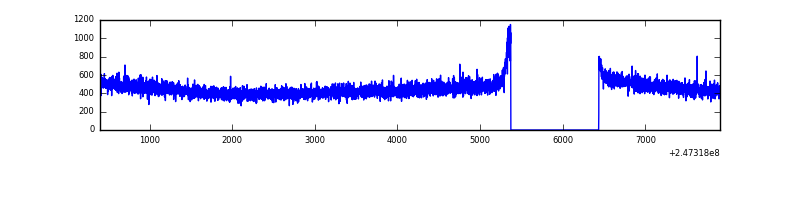 |
| D | 7503 | 6439 | 647 | 647 | 8.62% | 10.05% | 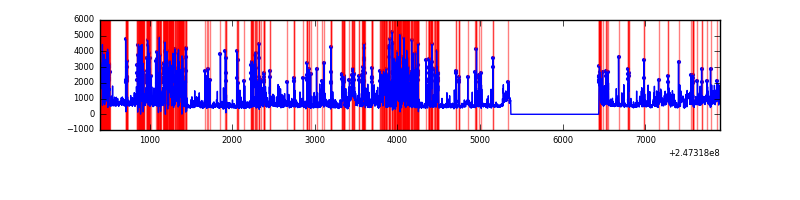 |
Top three noisy pixels from each quadrant. If the there are fewer than three noisy pixels in the level2.evt file, extra rows are filled as -1
| Pixel properties | Quadrant properties | ||||||
|---|---|---|---|---|---|---|---|
| Quadrant | DetID | PixID | Counts | Sigma | Mean | Median | Sigma |
| A | 13 | 251 | 1451905 | 9505.45 | 753 | 738 | 152.7 |
| A | 8 | 5 | 133928 | 872.42 | 753 | 738 | 152.7 |
| A | 15 | 174 | 26603 | 169.42 | 753 | 738 | 152.7 |
| B | 4 | 239 | 1439148 | 10151.52 | 739 | 722 | 141.7 |
| B | 3 | 64 | 285296 | 2008.34 | 739 | 722 | 141.7 |
| B | 0 | 214 | 49247 | 342.46 | 739 | 722 | 141.7 |
| C | 13 | 250 | 12040 | 66.38 | 737 | 739 | 170.3 |
| C | 13 | 61 | 5255 | 26.52 | 737 | 739 | 170.3 |
| C | 3 | 202 | 1844 | 6.49 | 737 | 739 | 170.3 |
| D | 1 | 52 | 1593399 | 9721.02 | 681 | 663 | 163.8 |
| D | 13 | 152 | 634294 | 3867.27 | 681 | 663 | 163.8 |
| D | 10 | 253 | 486992 | 2968.23 | 681 | 663 | 163.8 |
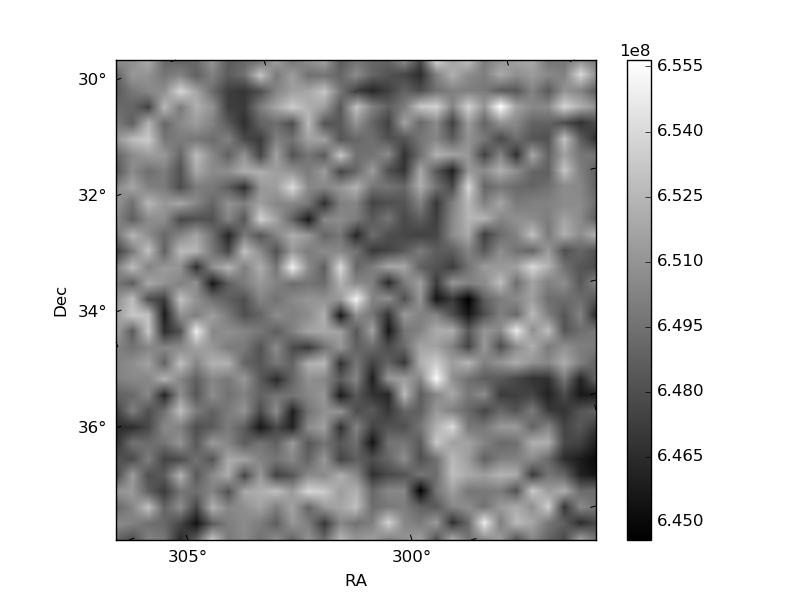
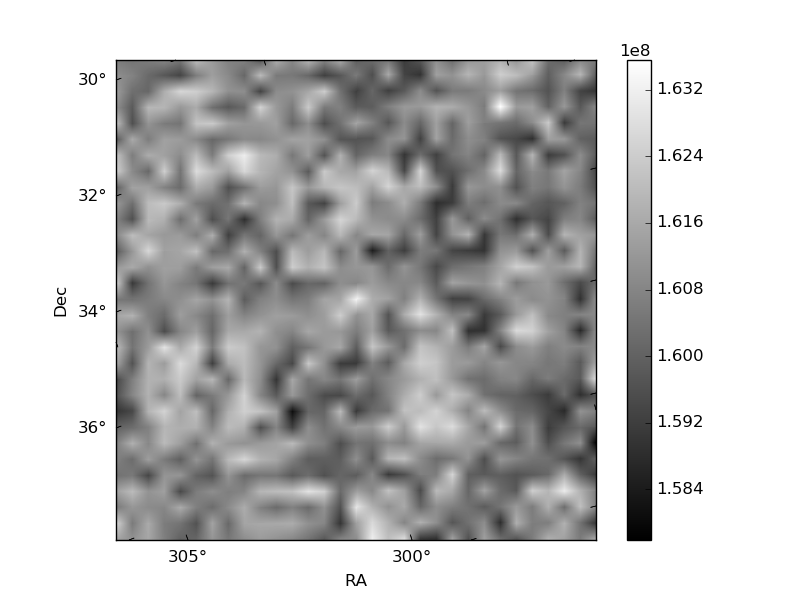
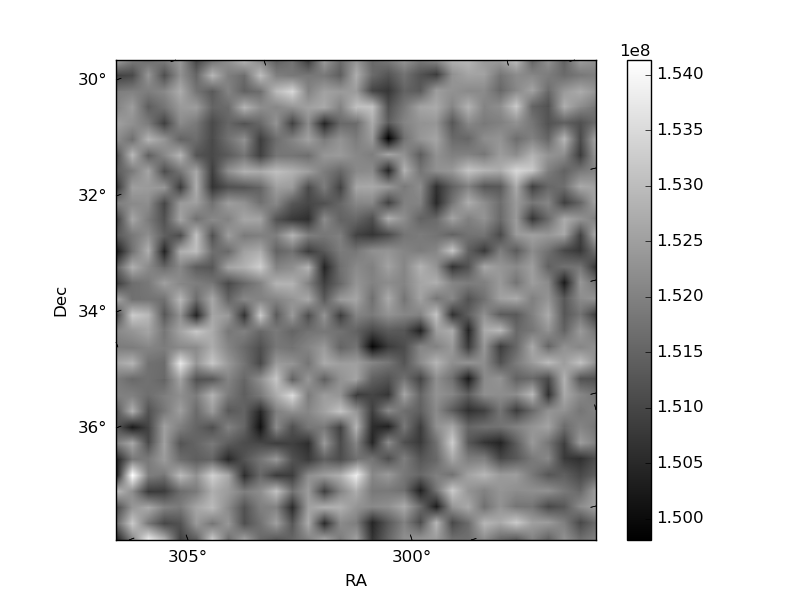
Histogram calculated using DETX and DETY for each event in the final _common_clean file
| Quadrant A | 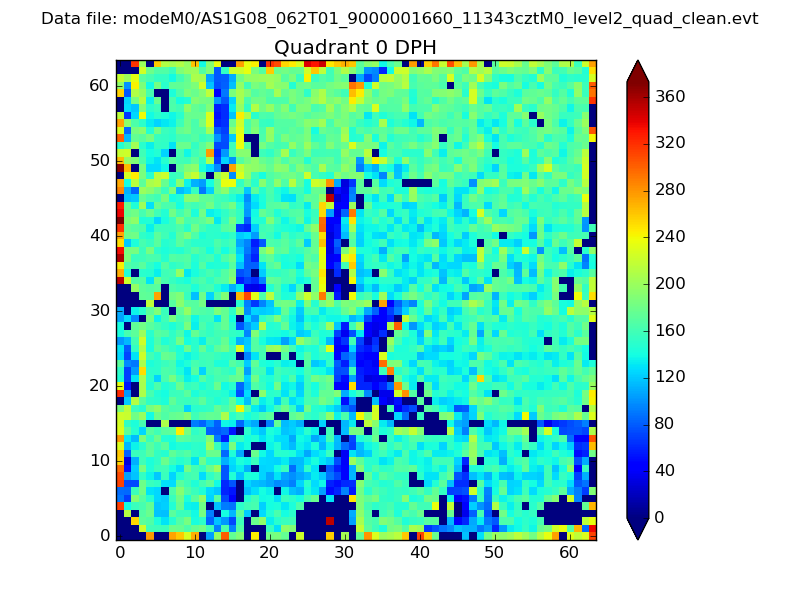 |
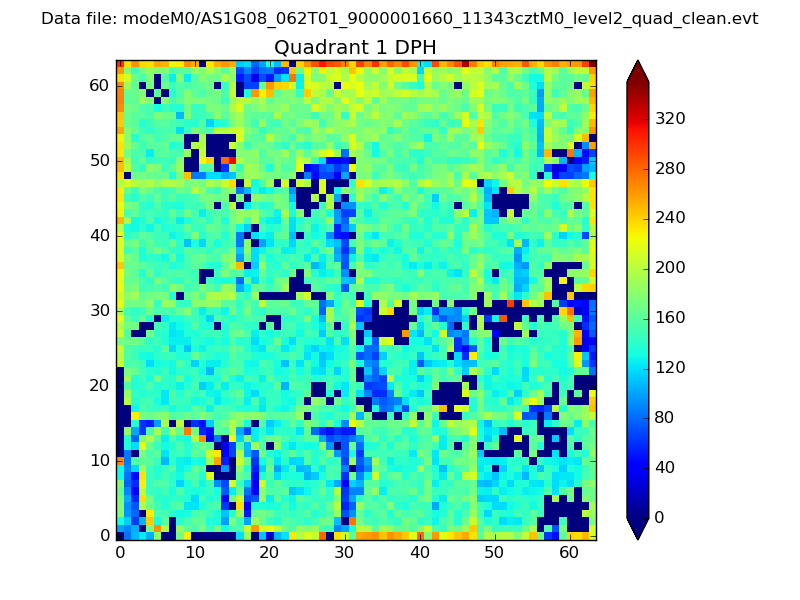 |
Quadrant B |
|---|---|---|---|
| Quadrant D | 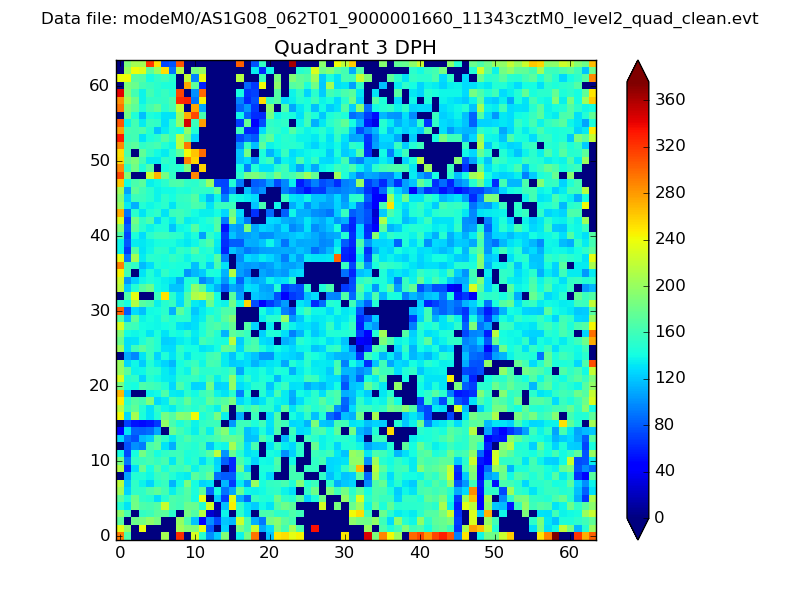 |
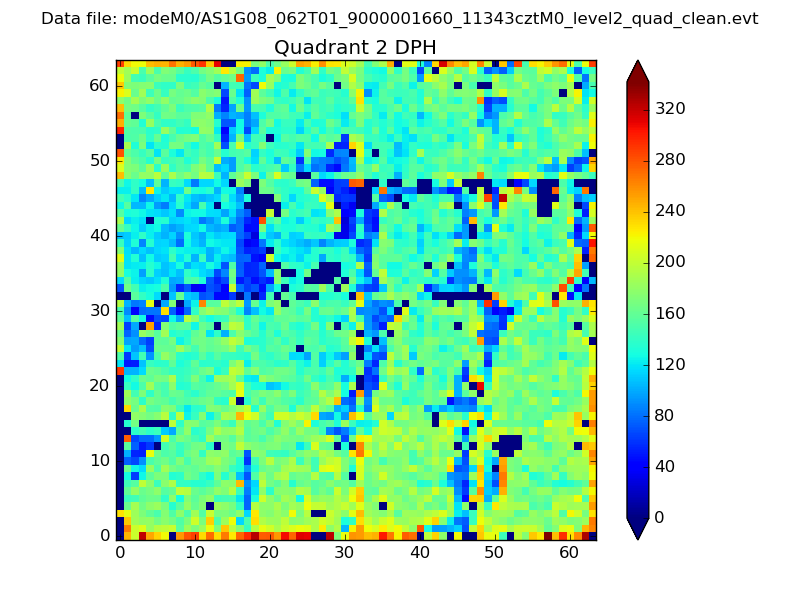 |
Quadrant C |
| Plot type | Count rate plots | Images |
|---|---|---|
| Comparison with Poisson distribution Blue bars denote a histogram of data divided into 1 sec bins. Red curve is a Poisson curve with rate = median count rate of data. |
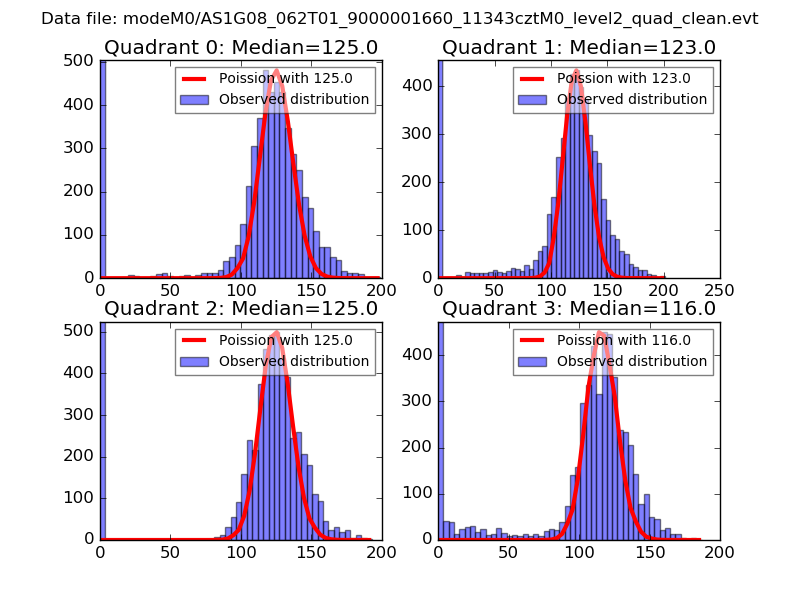 |
 |
| Quadrant-wise count rates Data is divided into 100 sec bins |
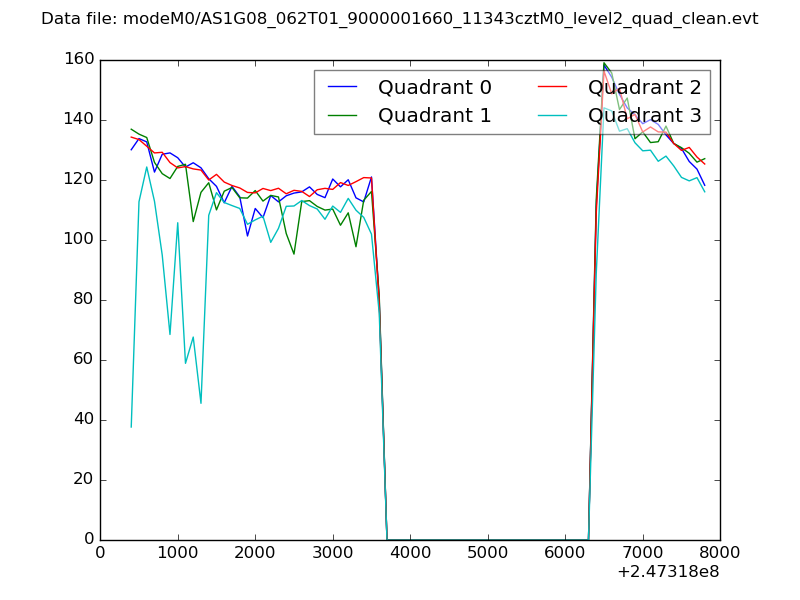 |
|
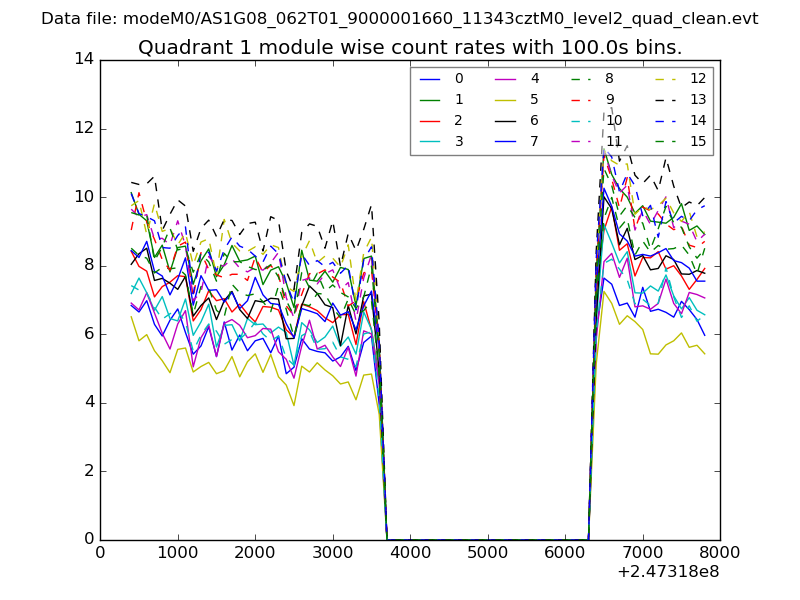
| Module-wise count rates for Quadrant A Data is divided into 100 sec bins |
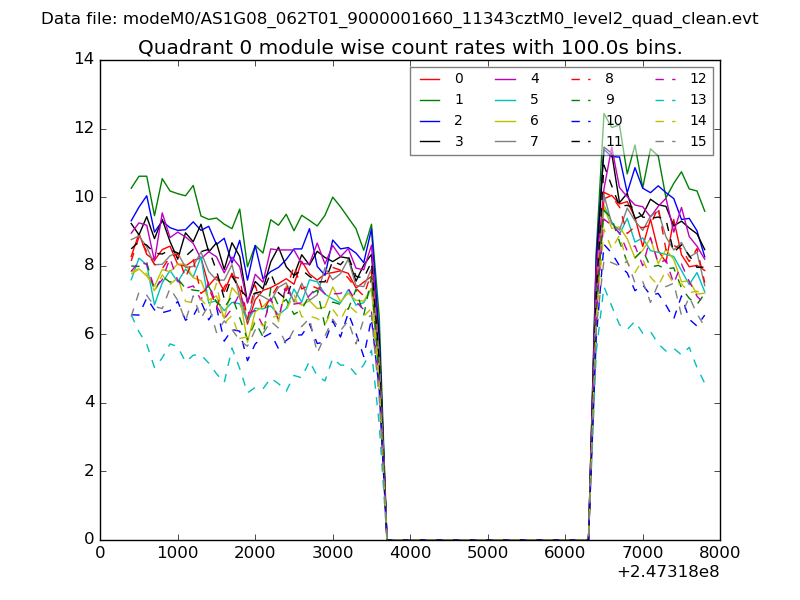 |
 |
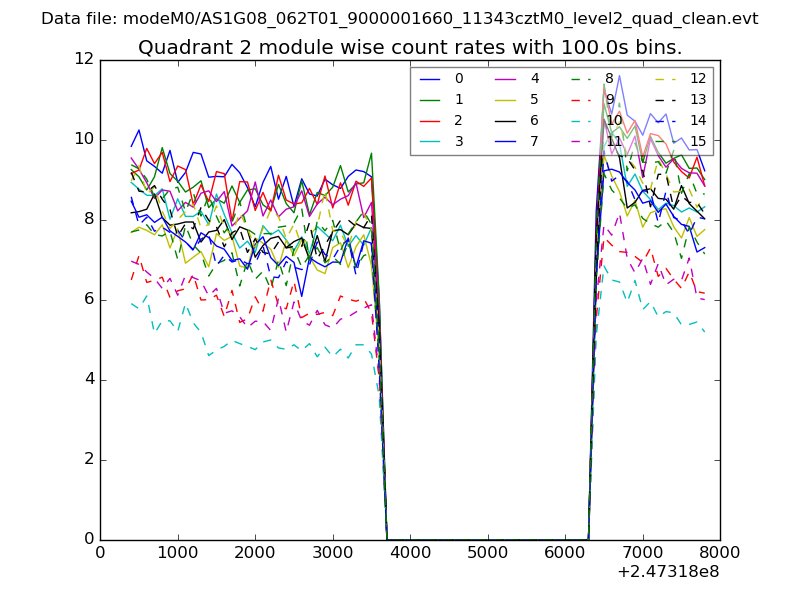
| Module-wise count rates for Quadrant B Data is divided into 100 sec bins |
 |
 |
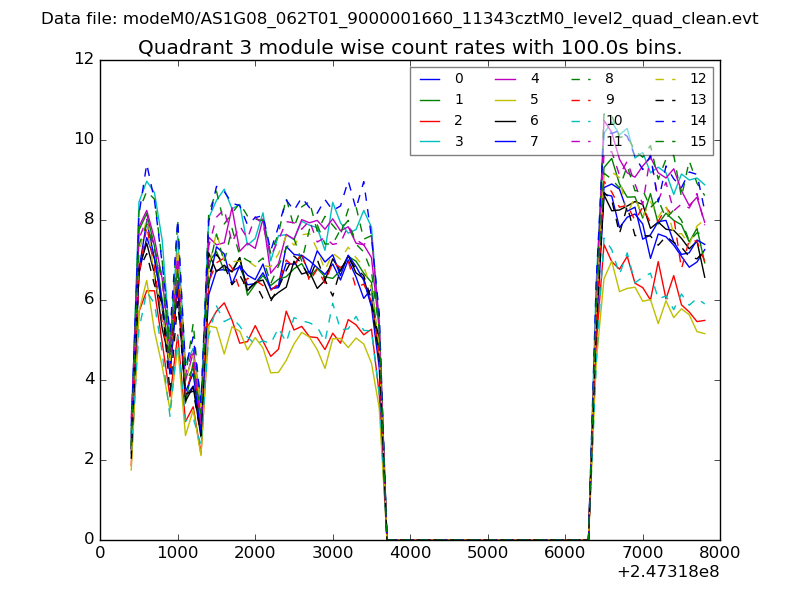
| Module-wise count rates for Quadrant C Data is divided into 100 sec bins |
 |
 |
| Module-wise count rates for Quadrant D Data is divided into 100 sec bins |
 |
 |
| Parameter | Plot |
|---|---|
| CZT HV Monitor | 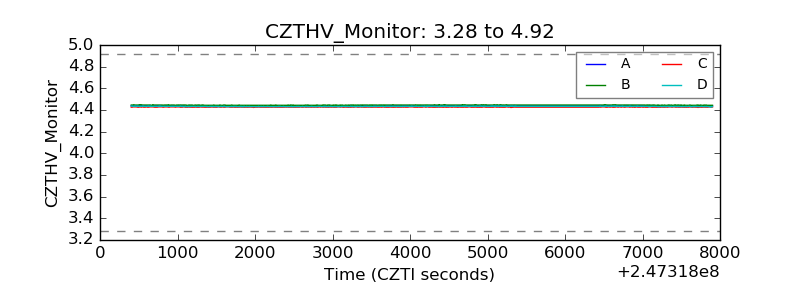 |
| D_VDD | 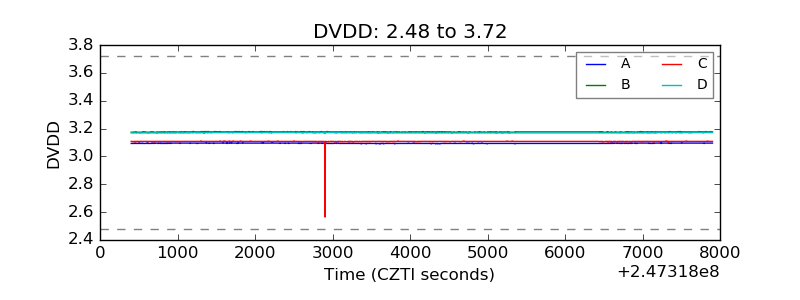 |
| Temperature 1 | 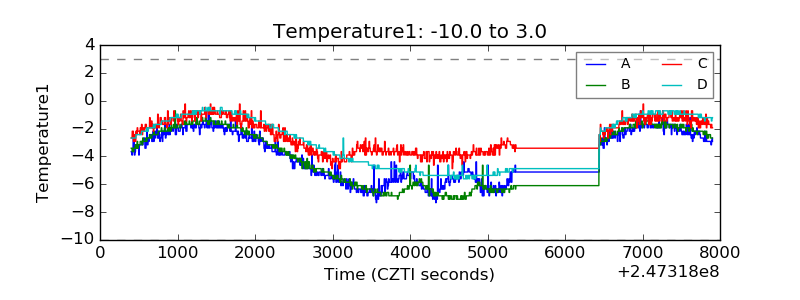 |
| Veto HV Monitor | 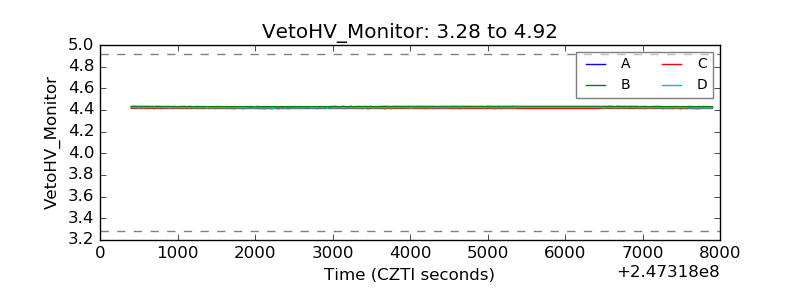 |
| Veto LLD | 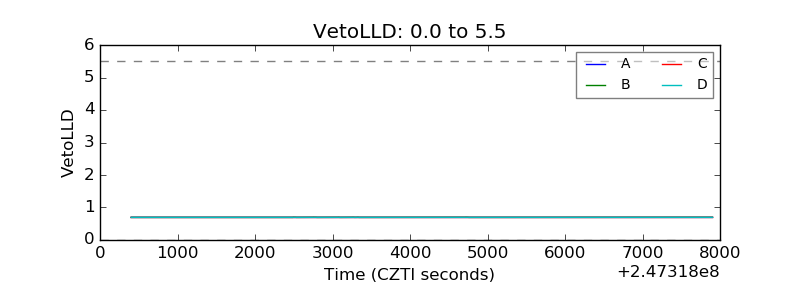 |
| Alpha Counter | 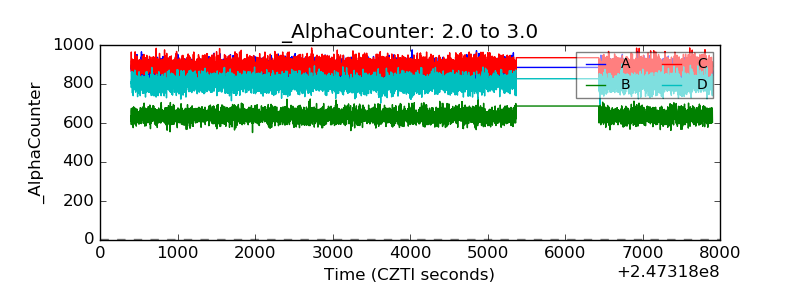 |
| _CPM_Rate | 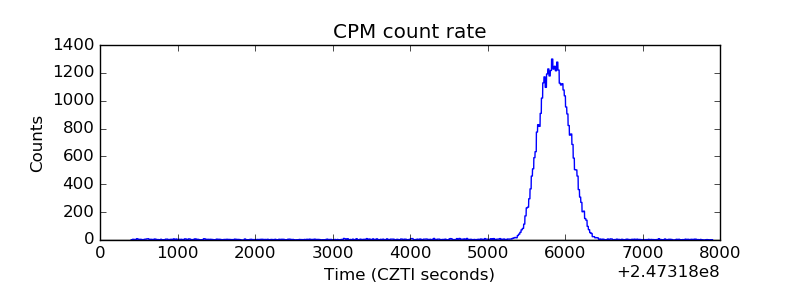 |
| CZT Counter | 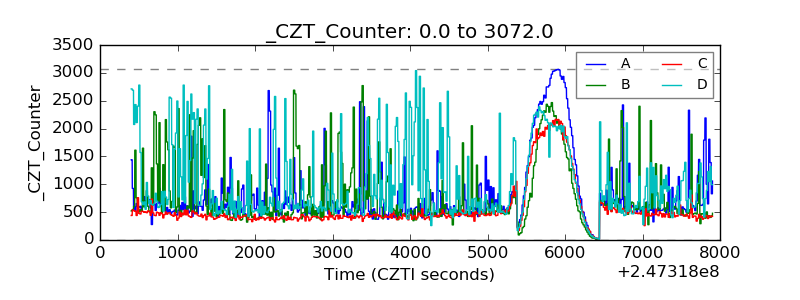 |
| +2.5 Volts monitor |  |
| +5 Volts monitor |  |
| _ROLL_ROT | 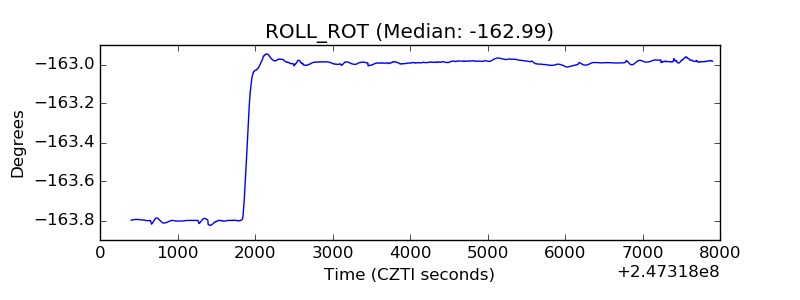 |
| _Roll_DEC | 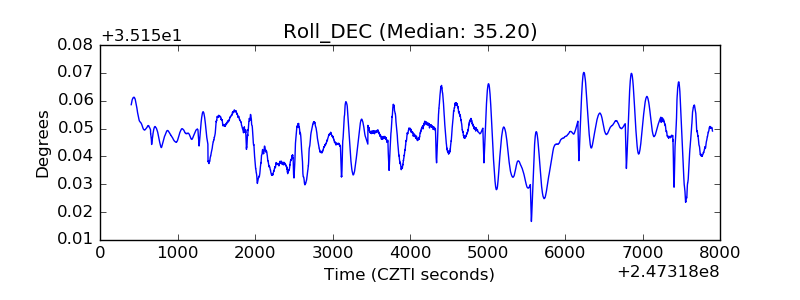 |
| _Roll_RA | 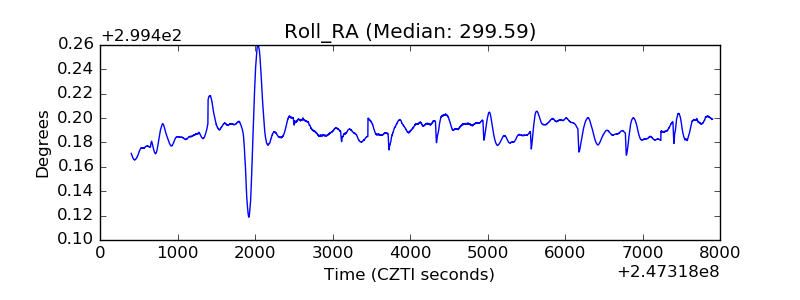 |
| Veto Counter |  |