| Param | Original file | Final file |
|---|---|---|
| Filename | modeM0/AS1G08_062T01_9000001660_11345cztM0_level2.evt | modeM0/AS1G08_062T01_9000001660_11345cztM0_level2_quad_clean.evt |
| Size (bytes) | 576,080,640 | 84,882,240 |
| Size | 549.4 MB | 81.0 MB |
| Events in quadrant A | 4,358,401 | 552,347 |
| Events in quadrant B | 4,365,726 | 535,283 |
| Events in quadrant C | 2,796,192 | 551,256 |
| Events in quadrant D | 5,513,863 | 505,738 |
| Mode M0 | |||
|---|---|---|---|
| Quadrant | BADHDUFLAG | Total packets | Discarded packets |
| A | 0 | 17068 | 2 |
| B | 0 | 17057 | 1 |
| C | 0 | 12484 | 1 |
| D | 0 | 20576 | 1 |
| Mode SS | |||
|---|---|---|---|
| Quadrant | BADHDUFLAG | Total packets | Discarded packets |
| A | 0 | 126 | 0 |
| B | 0 | 126 | 0 |
| C | 0 | 126 | 0 |
| D | 0 | 126 | 0 |
| Mode M9 | |||
|---|---|---|---|
| Quadrant | BADHDUFLAG | Total packets | Discarded packets |
| A | 0 | 11 | 0 |
| B | 0 | 11 | 0 |
| C | 0 | 11 | 0 |
| D | 0 | 11 | 0 |
| Quadrant | Total seconds | Saturated seconds | Saturation percentage |
|---|---|---|---|
| A | 6088 | 165 | 2.710250% |
| B | 6088 | 409 | 6.718134% |
| C | 6088 | 32 | 0.525624% |
| D | 6088 | 570 | 9.362681% |
Noise dominated data is calculated using 1-second bins in cleaned event files. If a bin has >2000 counts, and if more than 50% of those come from <1% of pixels, then it is considered to be noise-dominated and hence unusable.
| Quadrant | # 1 sec bins | Bins with >0 counts | Bins with >2000 counts | High rate bins dominated by noise | Noise dominated (total time) | Noise dominated (detector-on time) | Marked lightcurve |
|---|---|---|---|---|---|---|---|
| A | 7263 | 6089 | 76 | 76 | 1.05% | 1.25% |  |
| B | 7263 | 6089 | 265 | 265 | 3.65% | 4.35% |  |
| C | 7263 | 6089 | 1 | 1 | 0.01% | 0.02% | 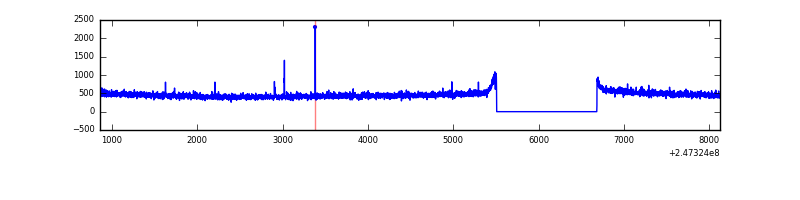 |
| D | 7263 | 6089 | 455 | 455 | 6.26% | 7.47% | 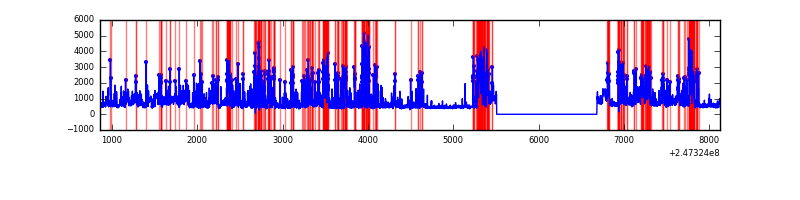 |
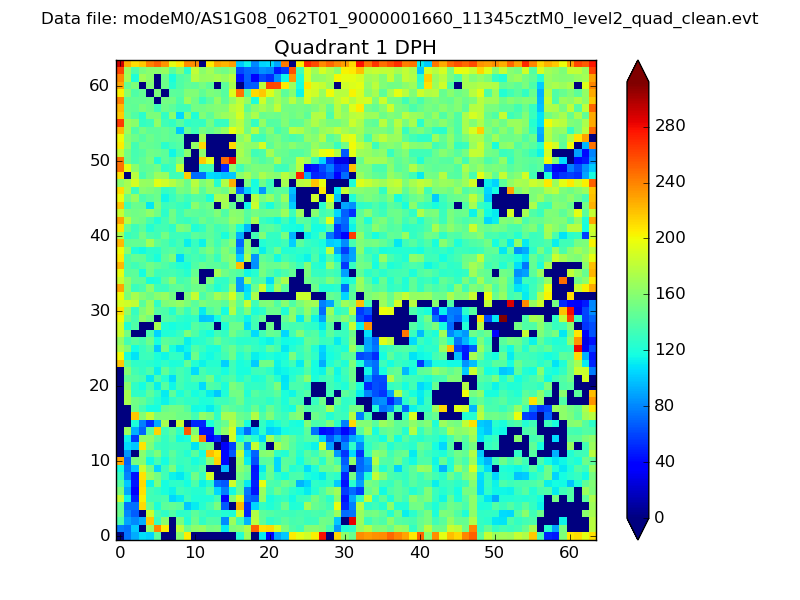
Top three noisy pixels from each quadrant. If the there are fewer than three noisy pixels in the level2.evt file, extra rows are filled as -1
| Pixel properties | Quadrant properties | ||||||
|---|---|---|---|---|---|---|---|
| Quadrant | DetID | PixID | Counts | Sigma | Mean | Median | Sigma |
| A | 13 | 251 | 1412422 | 9733.12 | 726 | 713 | 145.0 |
| A | 8 | 5 | 81493 | 556.94 | 726 | 713 | 145.0 |
| A | 15 | 174 | 22636 | 151.15 | 726 | 713 | 145.0 |
| B | 4 | 239 | 946787 | 7073.48 | 712 | 696 | 133.8 |
| B | 3 | 64 | 503457 | 3758.91 | 712 | 696 | 133.8 |
| B | 15 | 204 | 43609 | 320.84 | 712 | 696 | 133.8 |
| C | 13 | 250 | 18010 | 105.6 | 711 | 716 | 163.8 |
| C | 13 | 61 | 5107 | 26.81 | 711 | 716 | 163.8 |
| C | 12 | 4 | 4745 | 24.6 | 711 | 716 | 163.8 |
| D | 1 | 52 | 1345954 | 8247.09 | 683 | 664 | 163.1 |
| D | 10 | 253 | 500857 | 3066.35 | 683 | 664 | 163.1 |
| D | 13 | 152 | 346838 | 2122.16 | 683 | 664 | 163.1 |
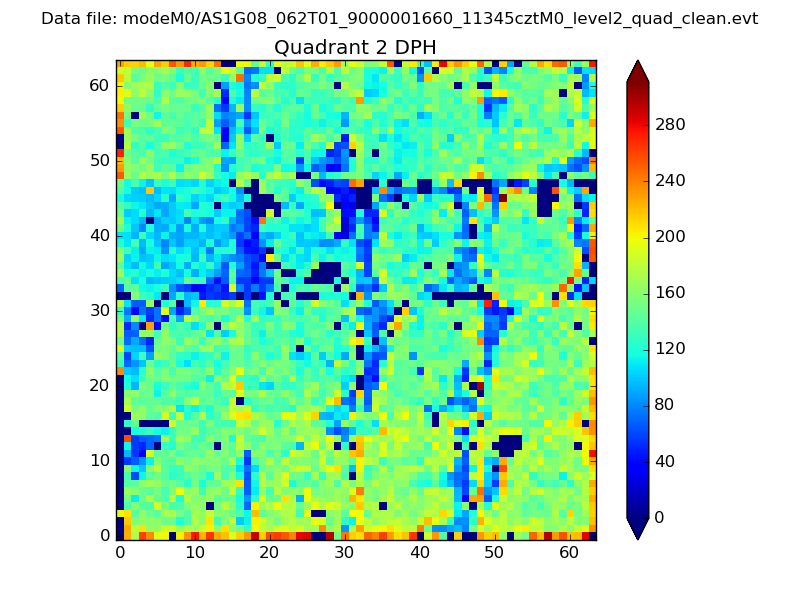
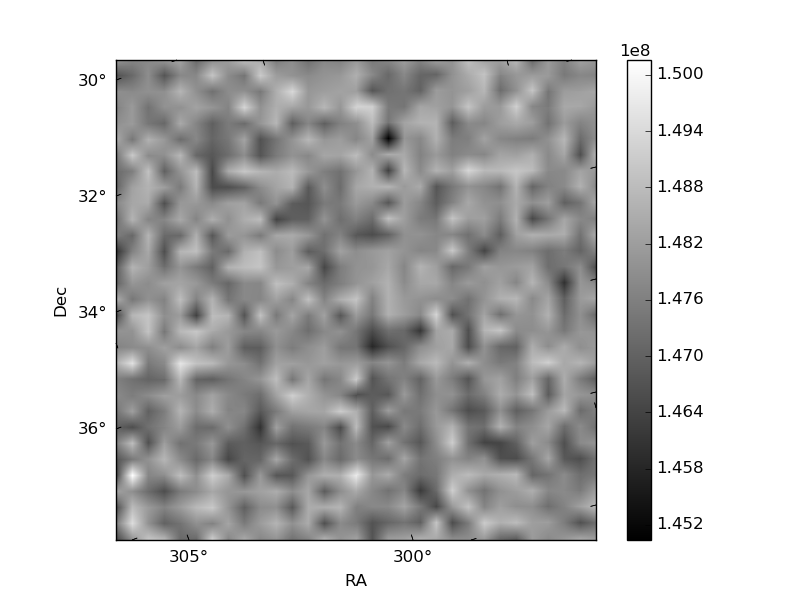
Histogram calculated using DETX and DETY for each event in the final _common_clean file
| Quadrant A | 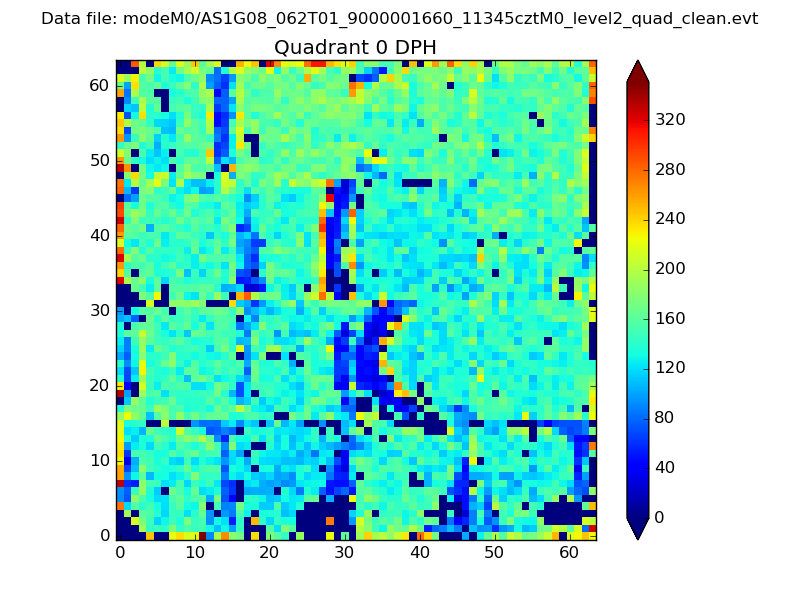 |
 |
Quadrant B |
|---|---|---|---|
| Quadrant D | 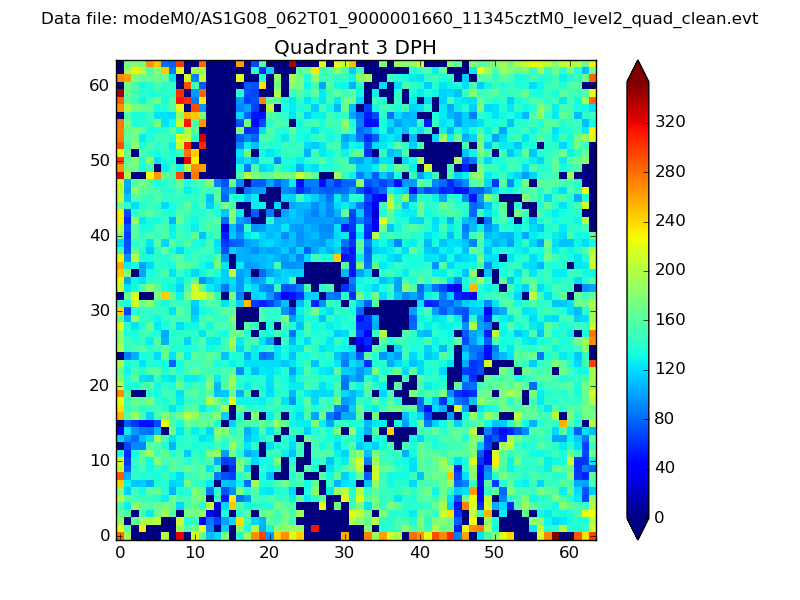 |
 |
Quadrant C |
| Plot type | Count rate plots | Images |
|---|---|---|
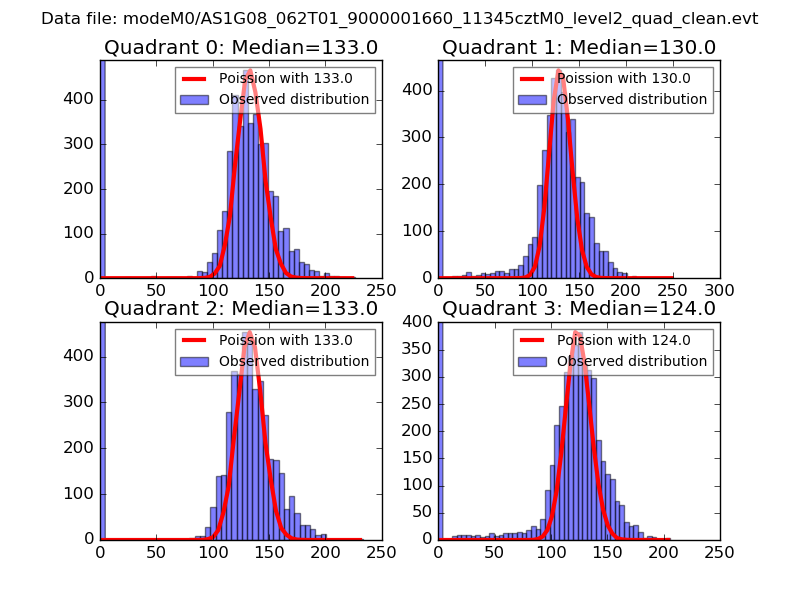
| Comparison with Poisson distribution Blue bars denote a histogram of data divided into 1 sec bins. Red curve is a Poisson curve with rate = median count rate of data. |
 |
 |
| Quadrant-wise count rates Data is divided into 100 sec bins |
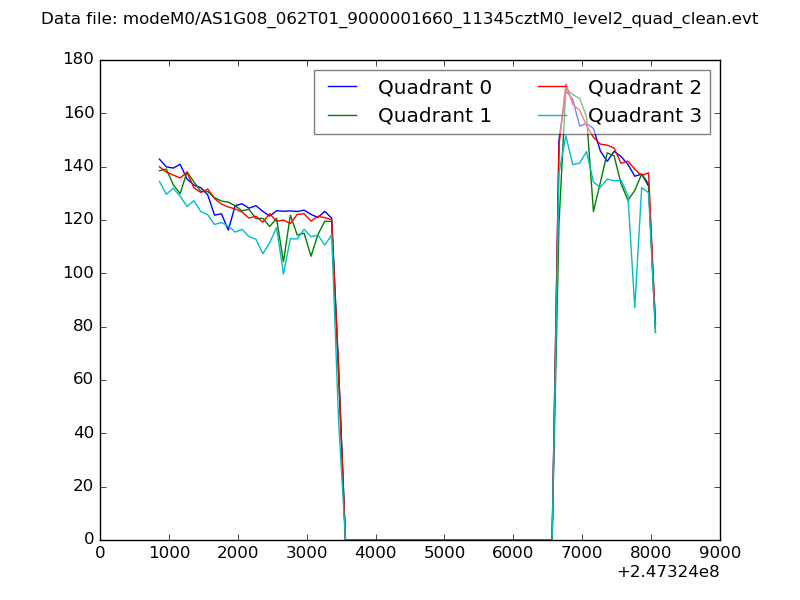 |
|
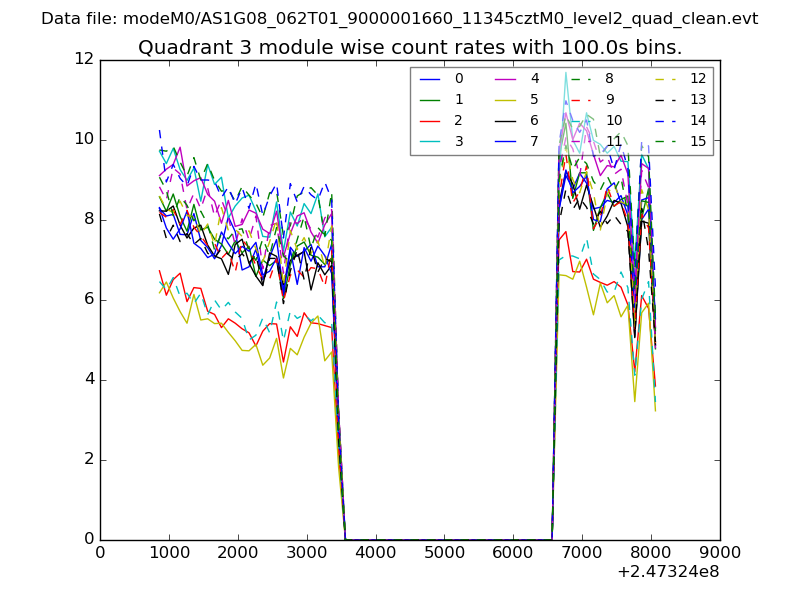
| Module-wise count rates for Quadrant A Data is divided into 100 sec bins |
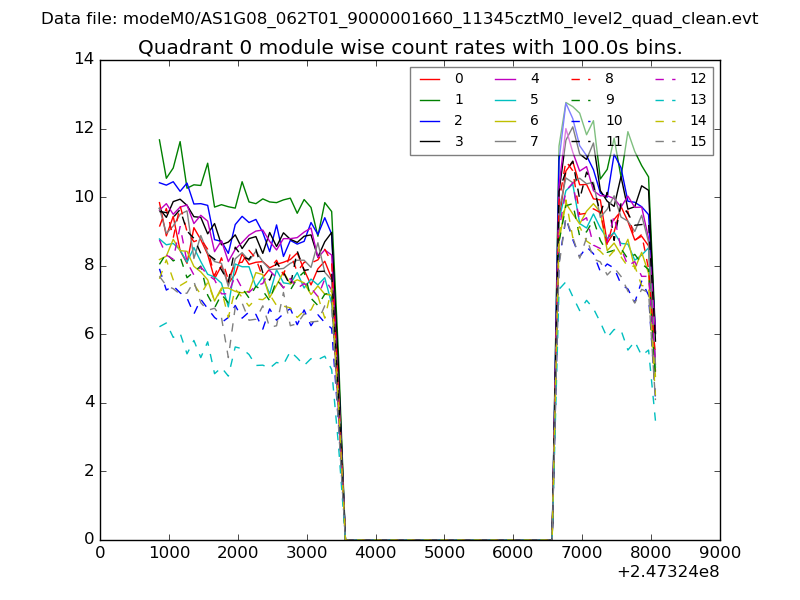 |
 |
| Module-wise count rates for Quadrant B Data is divided into 100 sec bins |
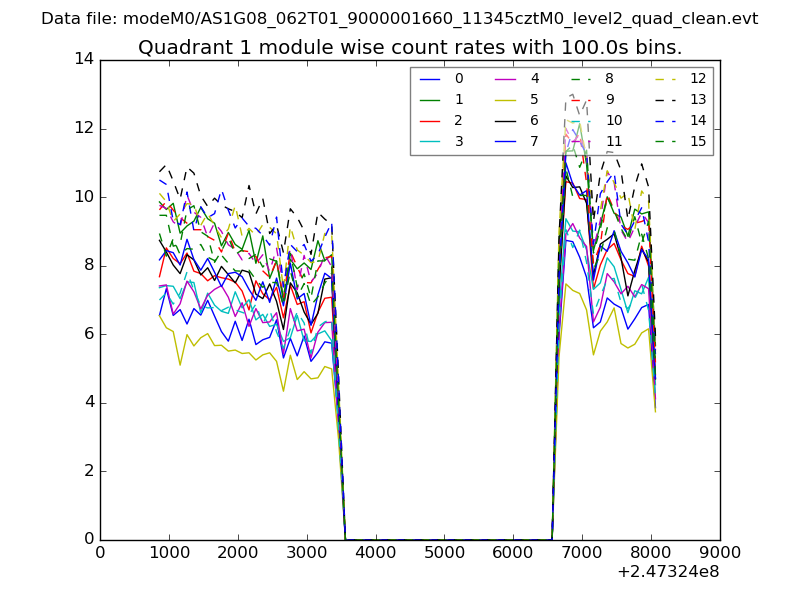 |
 |
| Module-wise count rates for Quadrant C Data is divided into 100 sec bins |
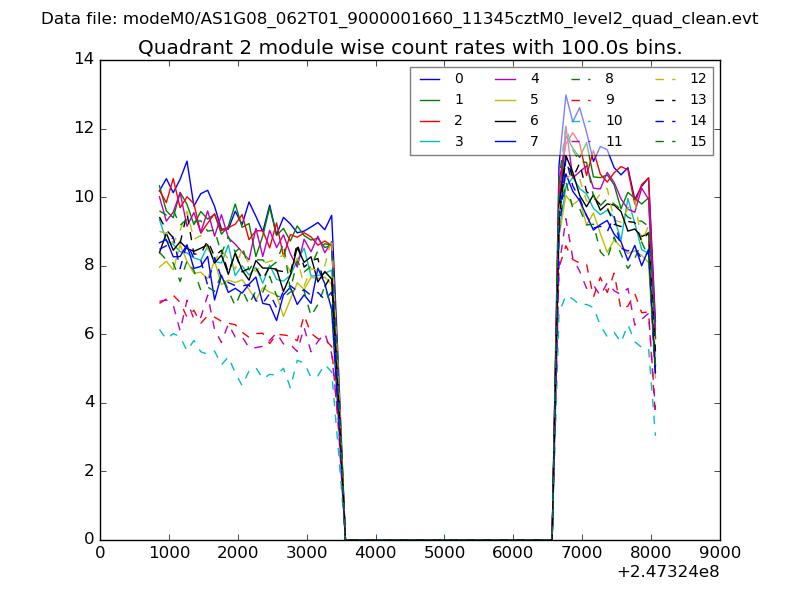 |
 |
| Module-wise count rates for Quadrant D Data is divided into 100 sec bins |
 |
 |
| Parameter | Plot |
|---|---|
| CZT HV Monitor | 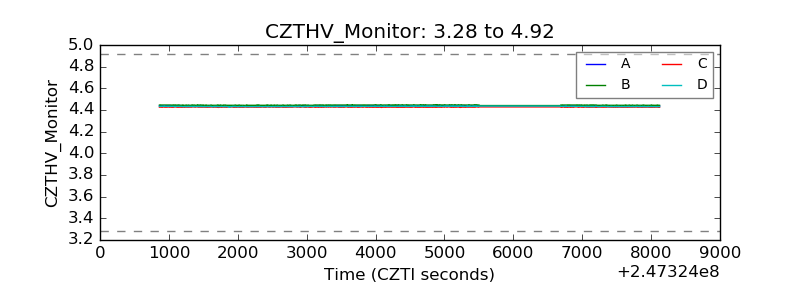 |
| D_VDD | 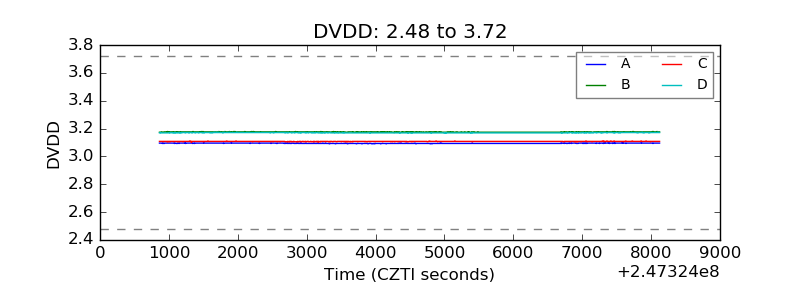 |
| Temperature 1 | 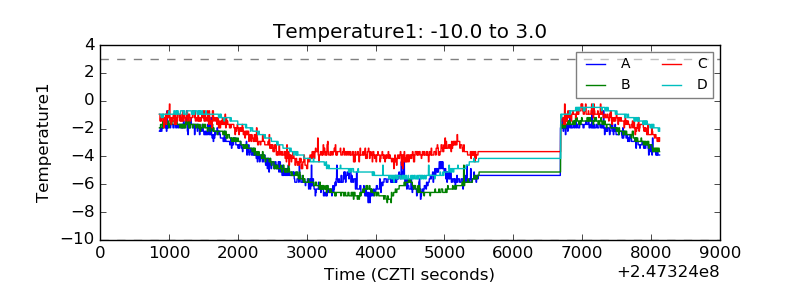 |
| Veto HV Monitor | 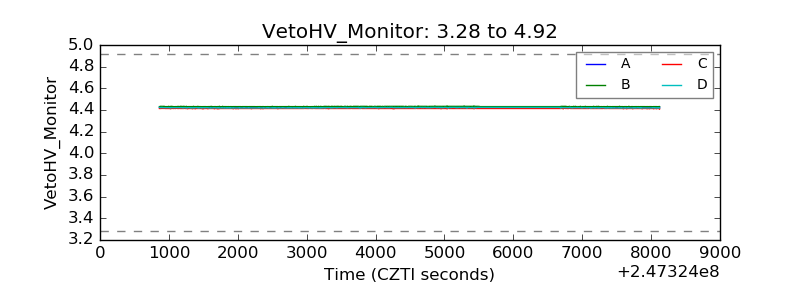 |
| Veto LLD | 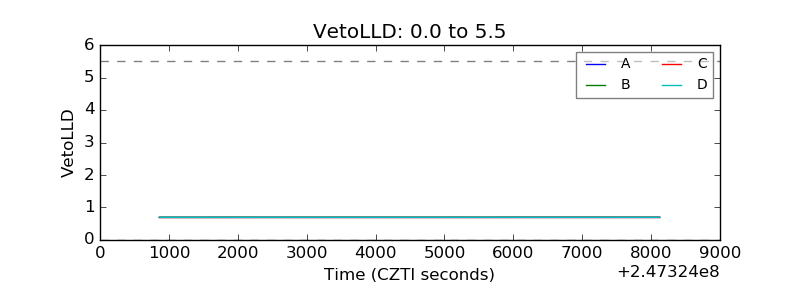 |
| Alpha Counter | 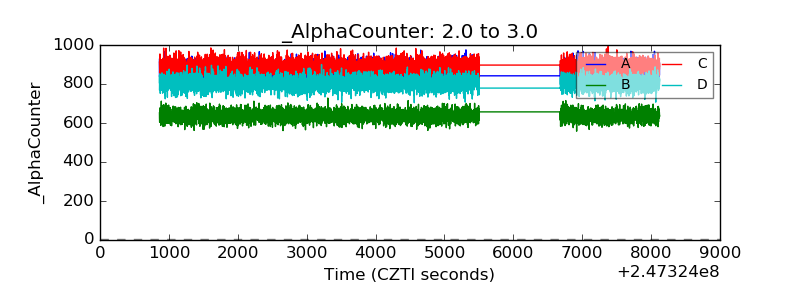 |
| _CPM_Rate | 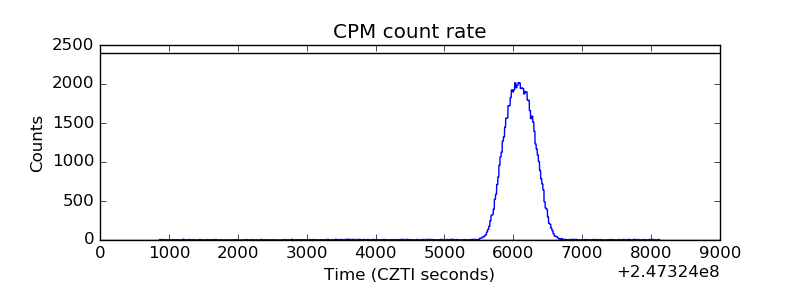 |
| CZT Counter | 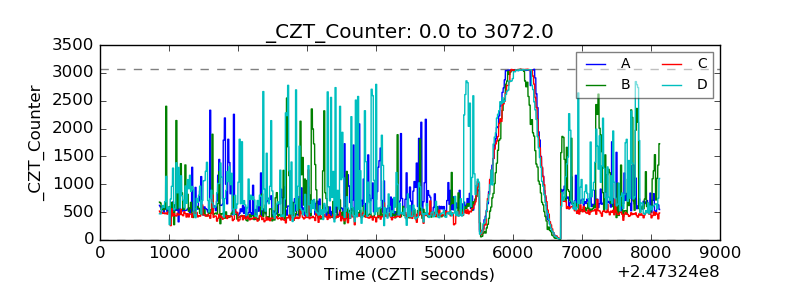 |
| +2.5 Volts monitor |  |
| +5 Volts monitor | 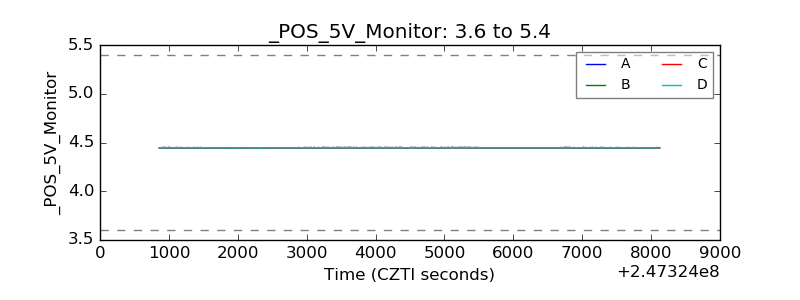 |
| _ROLL_ROT | 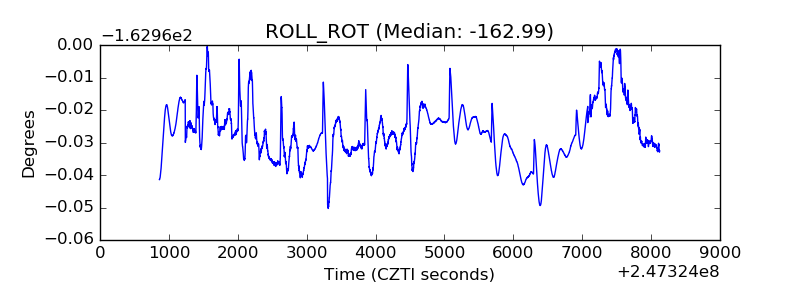 |
| _Roll_DEC | 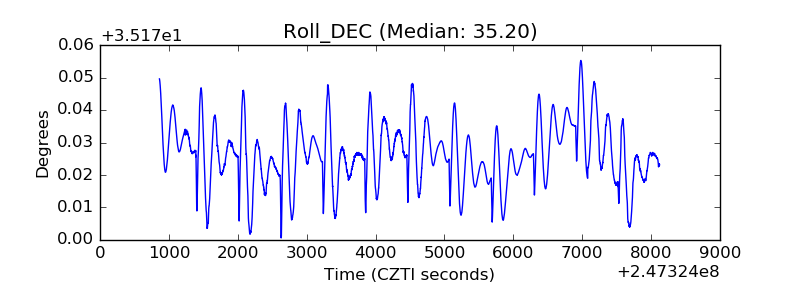 |
| _Roll_RA | 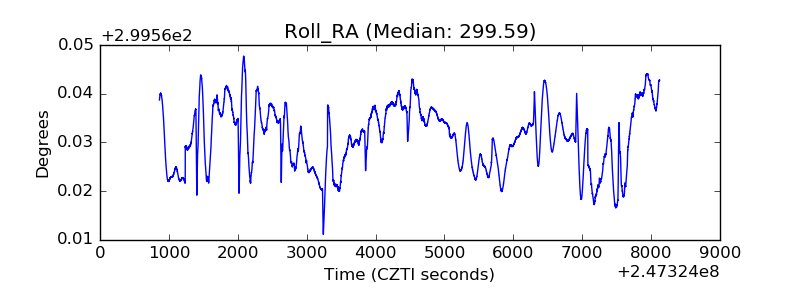 |
| Veto Counter | 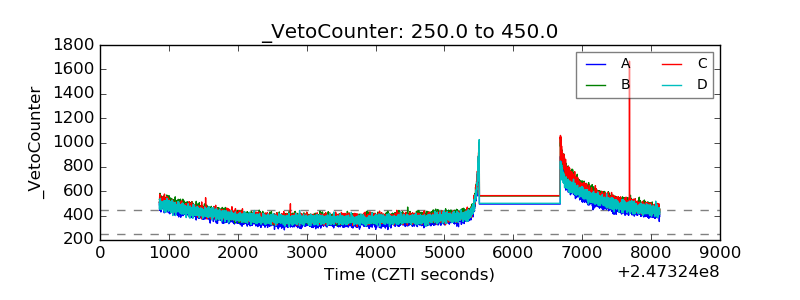 |