| Param | Original file | Final file |
|---|---|---|
| Filename | modeM0/AS1G08_062T01_9000001660_11347cztM0_level2.evt | modeM0/AS1G08_062T01_9000001660_11347cztM0_level2_quad_clean.evt |
| Size (bytes) | 551,730,240 | 83,589,120 |
| Size | 526.2 MB | 79.7 MB |
| Events in quadrant A | 4,269,479 | 546,270 |
| Events in quadrant B | 4,395,427 | 525,682 |
| Events in quadrant C | 2,825,848 | 555,608 |
| Events in quadrant D | 4,818,867 | 491,251 |
| Mode M0 | |||
|---|---|---|---|
| Quadrant | BADHDUFLAG | Total packets | Discarded packets |
| A | 0 | 16738 | 2 |
| B | 0 | 16975 | 1 |
| C | 0 | 12094 | 1 |
| D | 0 | 18187 | 1 |
| Mode SS | |||
|---|---|---|---|
| Quadrant | BADHDUFLAG | Total packets | Discarded packets |
| A | 0 | 122 | 0 |
| B | 0 | 122 | 0 |
| C | 0 | 122 | 0 |
| D | 0 | 122 | 0 |
| Mode M9 | |||
|---|---|---|---|
| Quadrant | BADHDUFLAG | Total packets | Discarded packets |
| A | 0 | 13 | 0 |
| B | 0 | 13 | 0 |
| C | 0 | 13 | 0 |
| D | 0 | 13 | 0 |
| Quadrant | Total seconds | Saturated seconds | Saturation percentage |
|---|---|---|---|
| A | 5891 | 128 | 2.172806% |
| B | 5891 | 441 | 7.485996% |
| C | 5891 | 21 | 0.356476% |
| D | 5891 | 532 | 9.030725% |
Noise dominated data is calculated using 1-second bins in cleaned event files. If a bin has >2000 counts, and if more than 50% of those come from <1% of pixels, then it is considered to be noise-dominated and hence unusable.
| Quadrant | # 1 sec bins | Bins with >0 counts | Bins with >2000 counts | High rate bins dominated by noise | Noise dominated (total time) | Noise dominated (detector-on time) | Marked lightcurve |
|---|---|---|---|---|---|---|---|
| A | 7222 | 5892 | 54 | 54 | 0.75% | 0.92% | 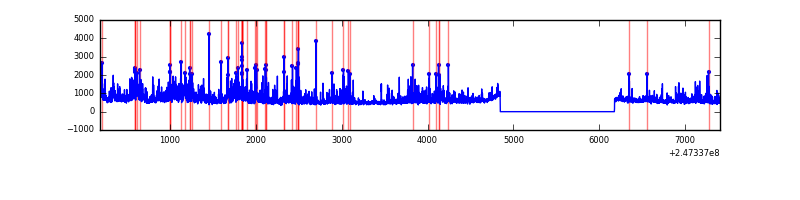 |
| B | 7222 | 5892 | 307 | 307 | 4.25% | 5.21% | 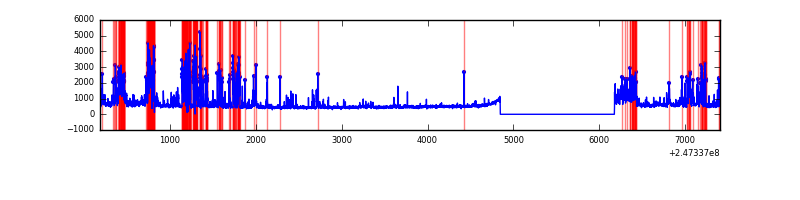 |
| C | 7222 | 5892 | 0 | 0 | 0.00% | 0.00% | 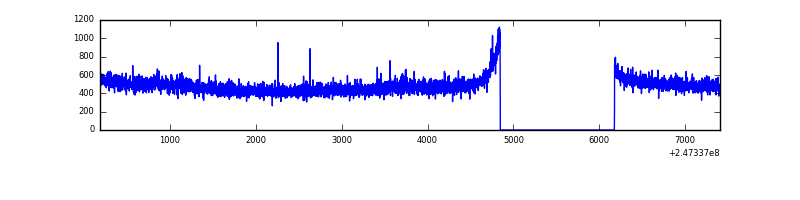 |
| D | 7222 | 5892 | 475 | 475 | 6.58% | 8.06% | 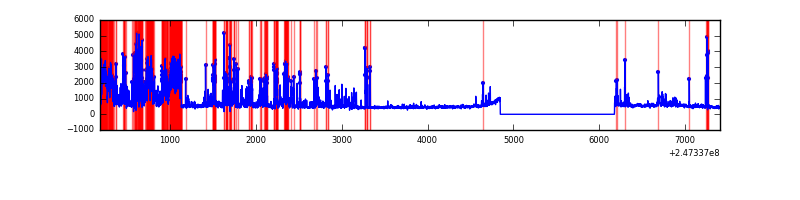 |
Top three noisy pixels from each quadrant. If the there are fewer than three noisy pixels in the level2.evt file, extra rows are filled as -1
| Pixel properties | Quadrant properties | ||||||
|---|---|---|---|---|---|---|---|
| Quadrant | DetID | PixID | Counts | Sigma | Mean | Median | Sigma |
| A | 13 | 251 | 1407239 | 9672.84 | 724 | 710 | 145.4 |
| A | 8 | 5 | 31658 | 212.83 | 724 | 710 | 145.4 |
| A | 1 | 162 | 17505 | 115.5 | 724 | 710 | 145.4 |
| B | 4 | 239 | 787547 | 5983.43 | 707 | 692 | 131.5 |
| B | 3 | 64 | 656688 | 4988.35 | 707 | 692 | 131.5 |
| B | 3 | 189 | 104514 | 789.49 | 707 | 692 | 131.5 |
| C | 4 | 175 | 20211 | 118.05 | 717 | 722 | 165.1 |
| C | 13 | 61 | 5362 | 28.11 | 717 | 722 | 165.1 |
| C | 13 | 250 | 5119 | 26.63 | 717 | 722 | 165.1 |
| D | 13 | 152 | 925381 | 5584.11 | 684 | 665 | 165.6 |
| D | 1 | 52 | 619799 | 3738.78 | 684 | 665 | 165.6 |
| D | 10 | 253 | 295023 | 1777.55 | 684 | 665 | 165.6 |
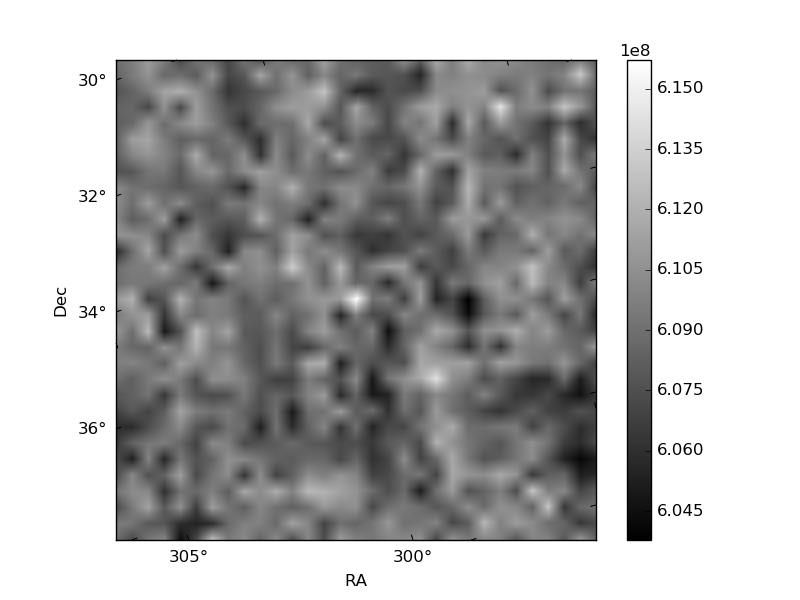
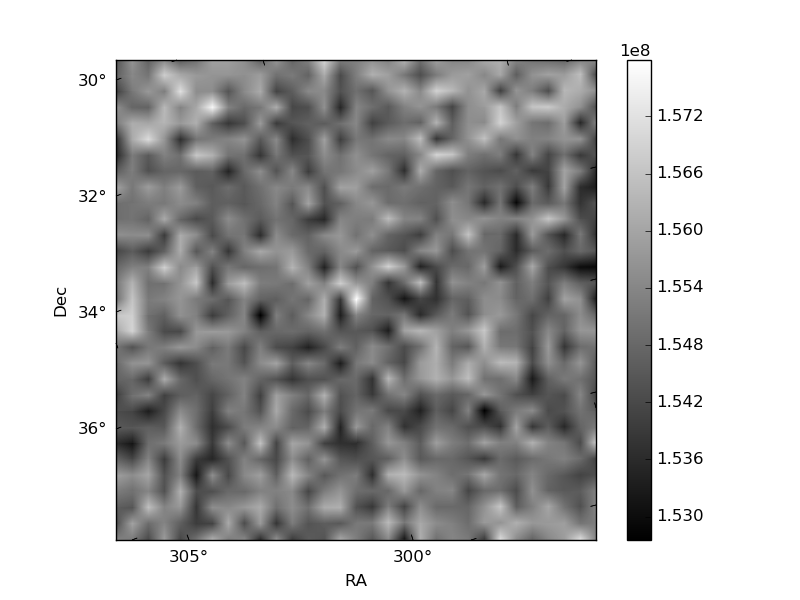
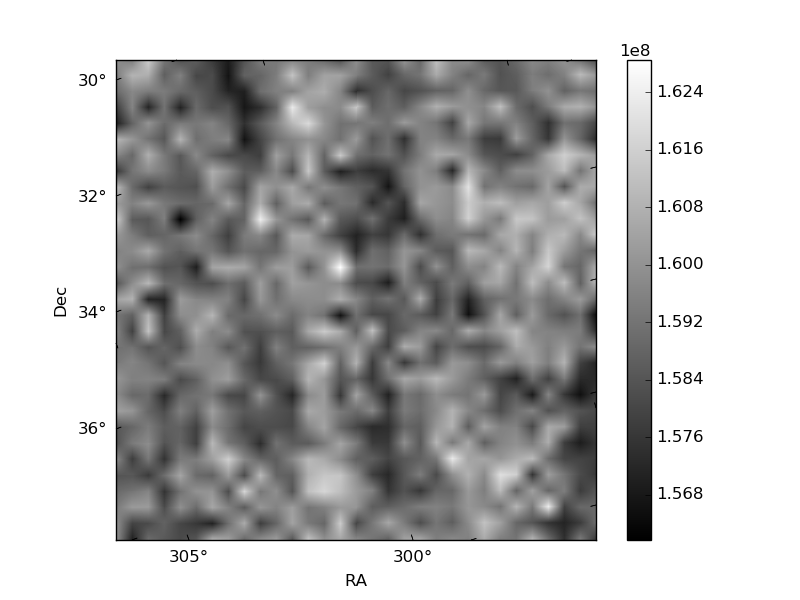
Histogram calculated using DETX and DETY for each event in the final _common_clean file
| Quadrant A | 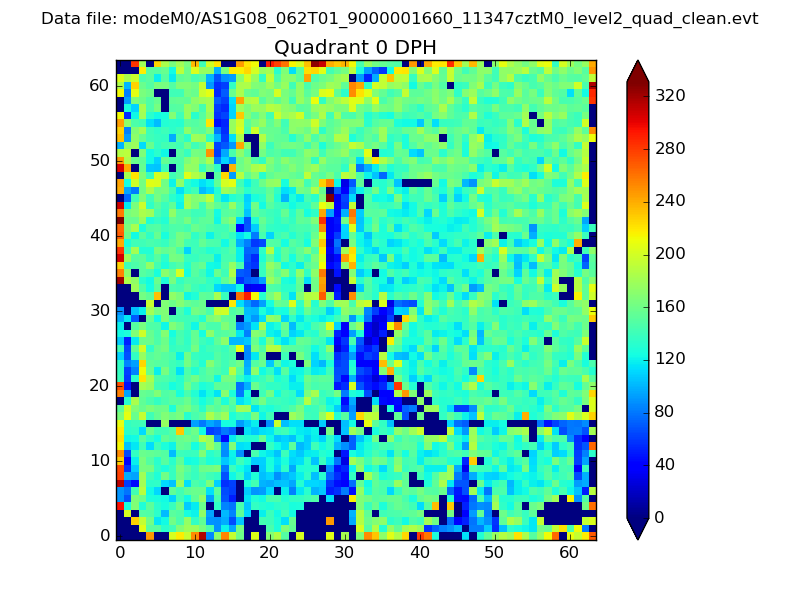 |
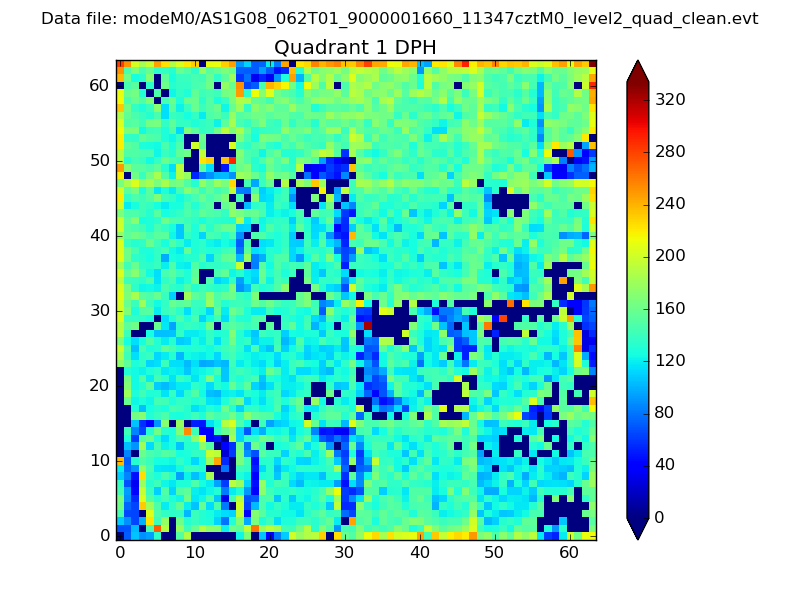 |
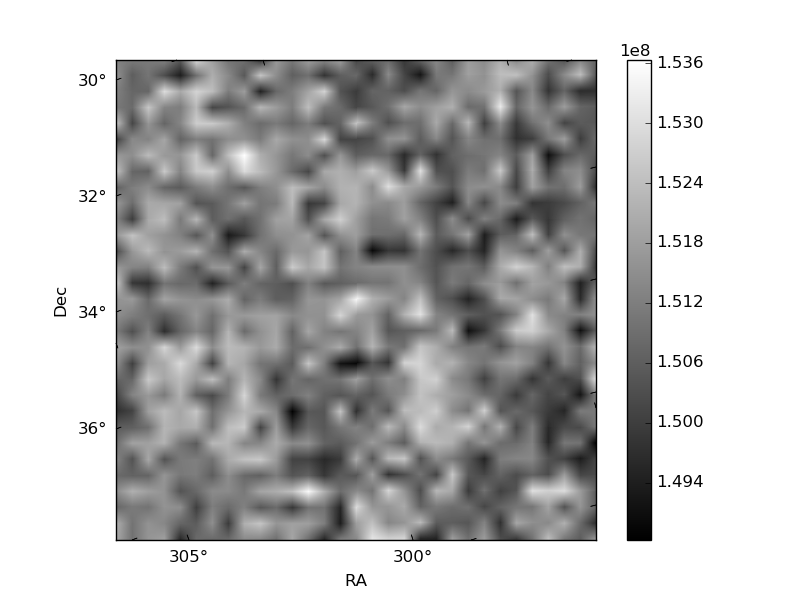
Quadrant B |
|---|---|---|---|
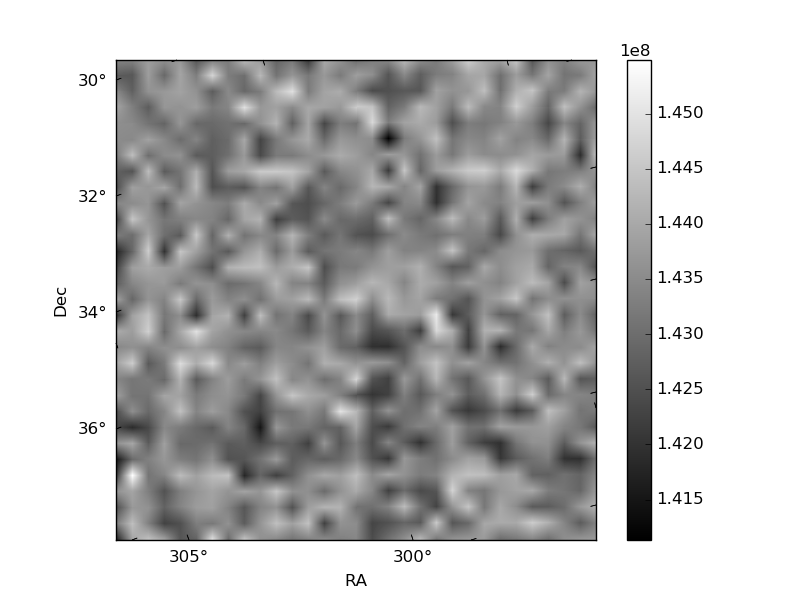
| Quadrant D | 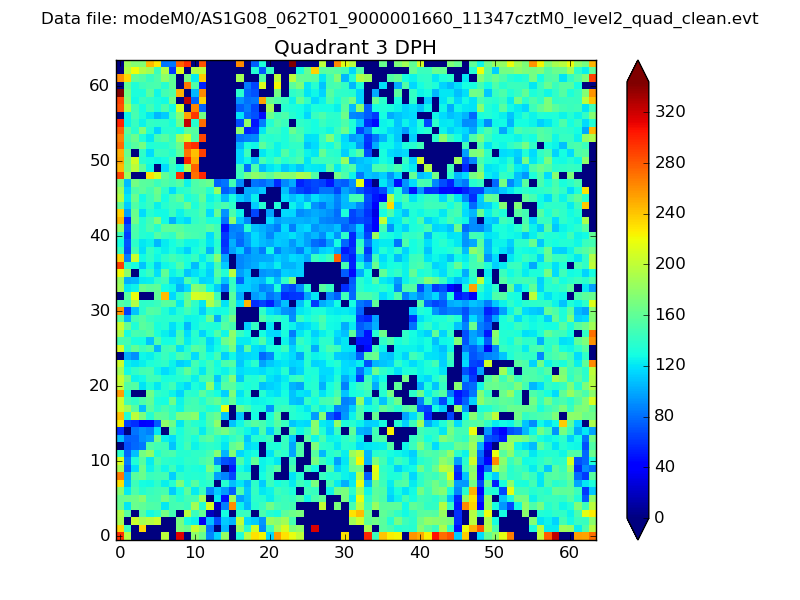 |
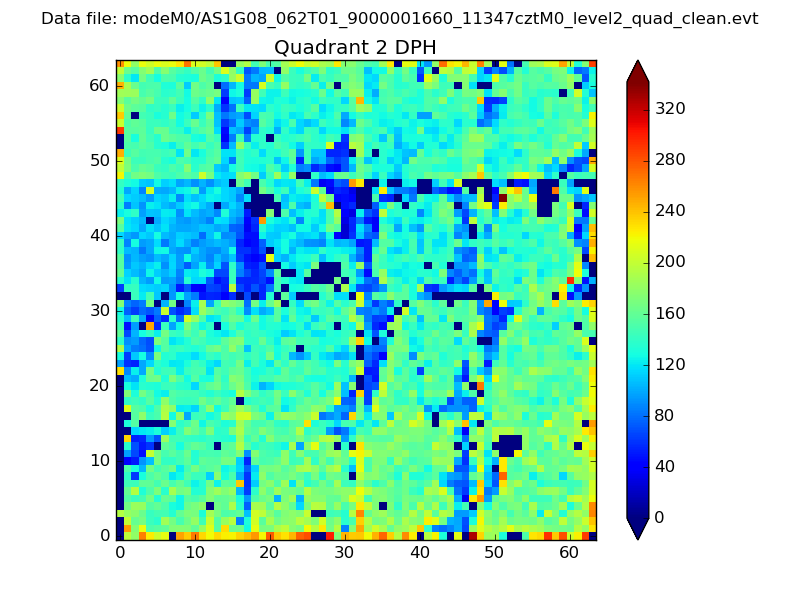 |
Quadrant C |
| Plot type | Count rate plots | Images |
|---|---|---|
| Comparison with Poisson distribution Blue bars denote a histogram of data divided into 1 sec bins. Red curve is a Poisson curve with rate = median count rate of data. |
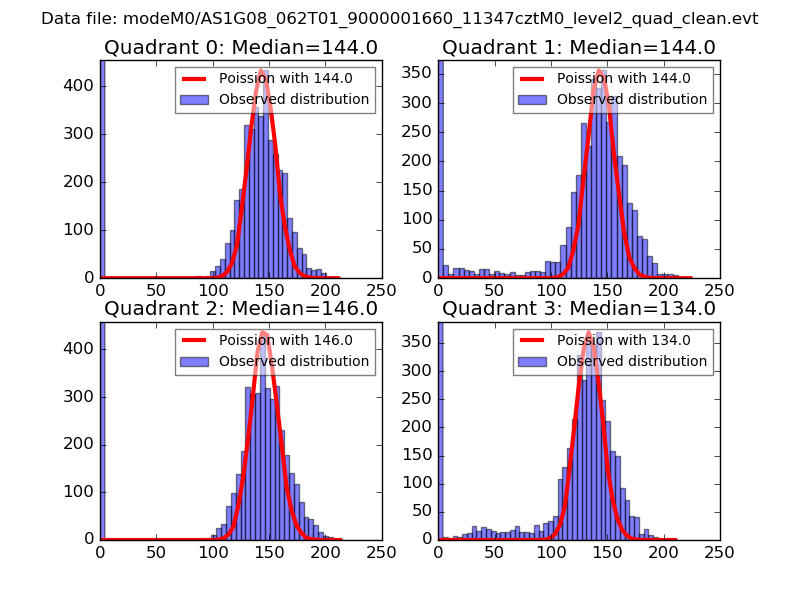 |
 |
| Quadrant-wise count rates Data is divided into 100 sec bins |
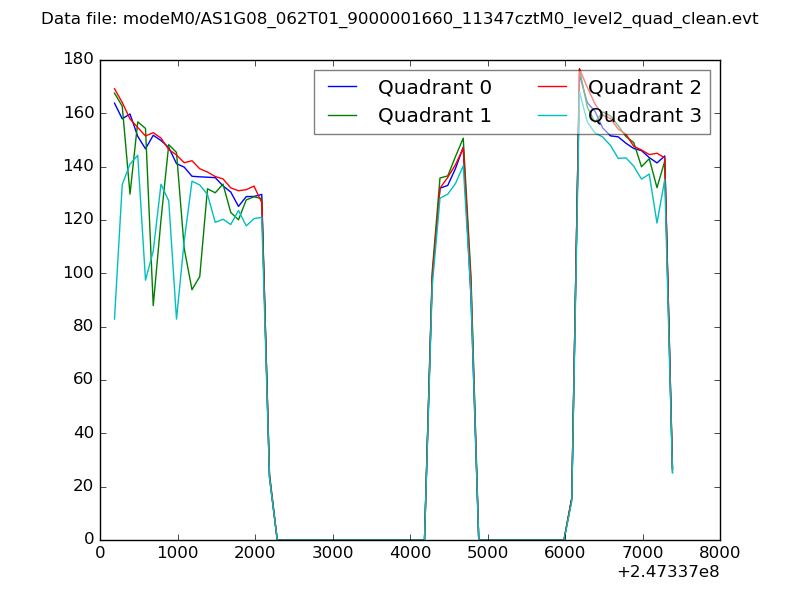 |
|
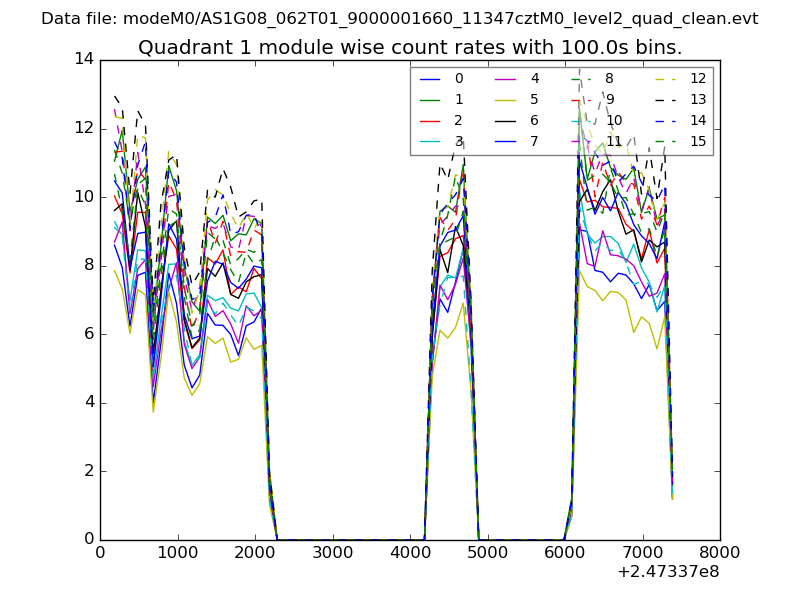
| Module-wise count rates for Quadrant A Data is divided into 100 sec bins |
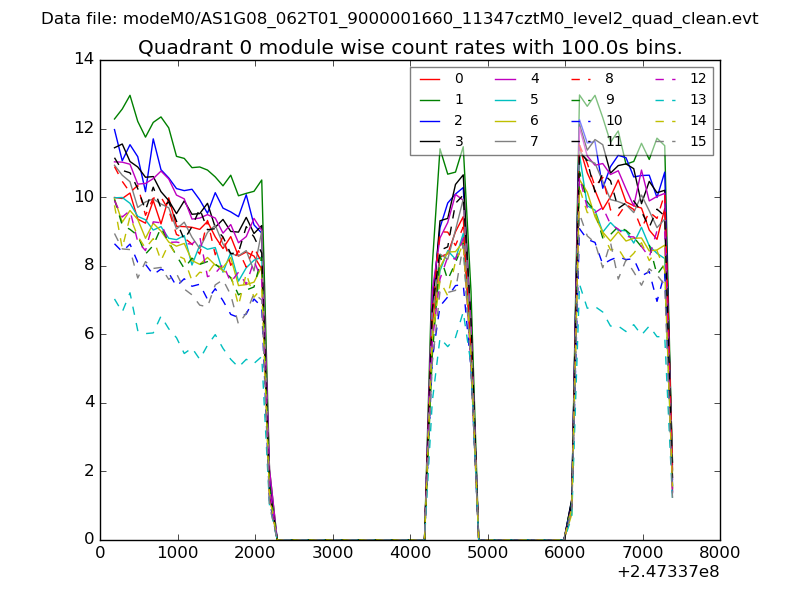 |
 |
| Module-wise count rates for Quadrant B Data is divided into 100 sec bins |
 |
 |
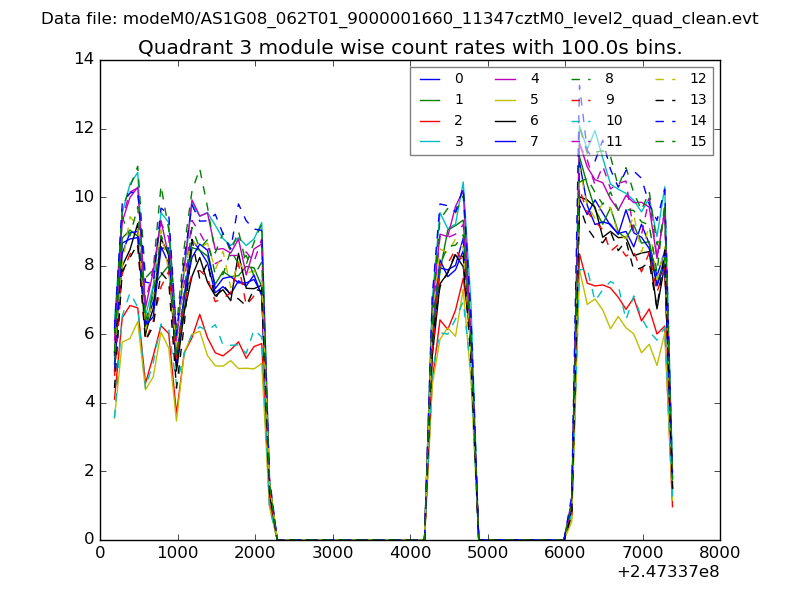
| Module-wise count rates for Quadrant C Data is divided into 100 sec bins |
 |
 |
| Module-wise count rates for Quadrant D Data is divided into 100 sec bins |
 |
 |
| Parameter | Plot |
|---|---|
| CZT HV Monitor | 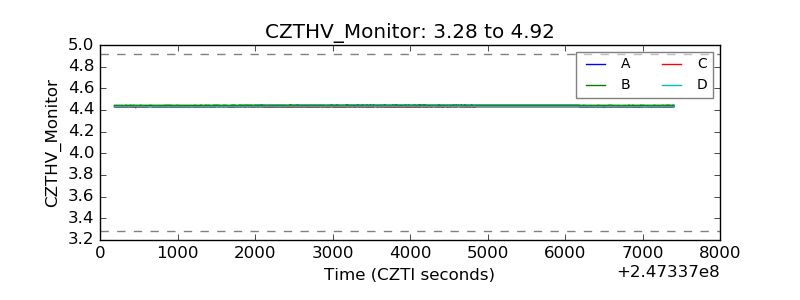 |
| D_VDD | 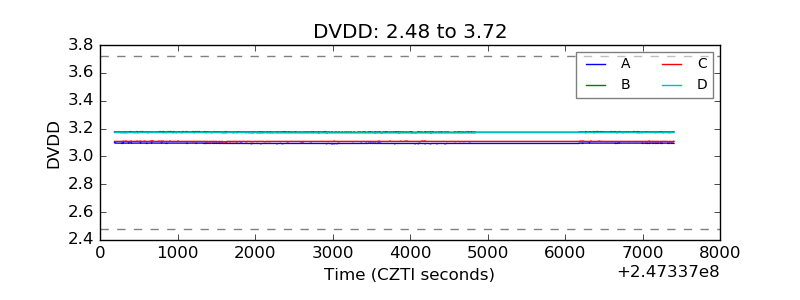 |
| Temperature 1 |  |
| Veto HV Monitor | 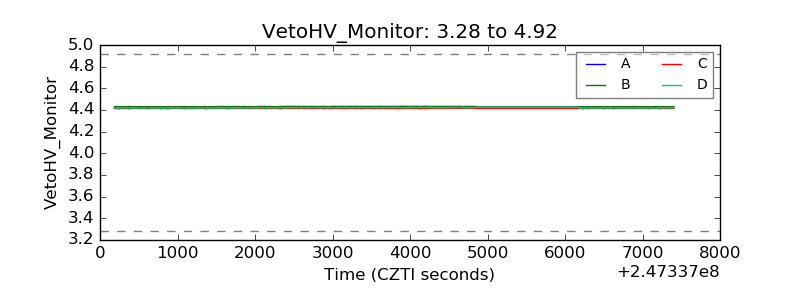 |
| Veto LLD | 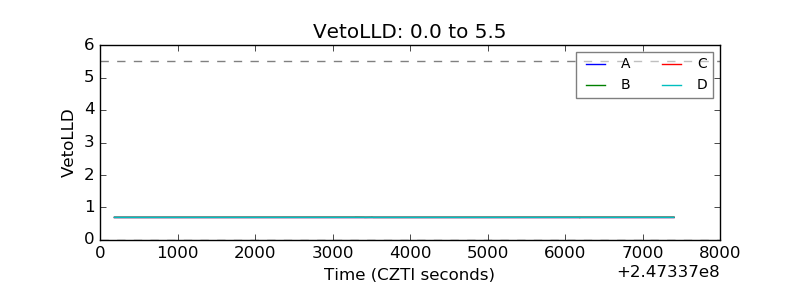 |
| Alpha Counter | 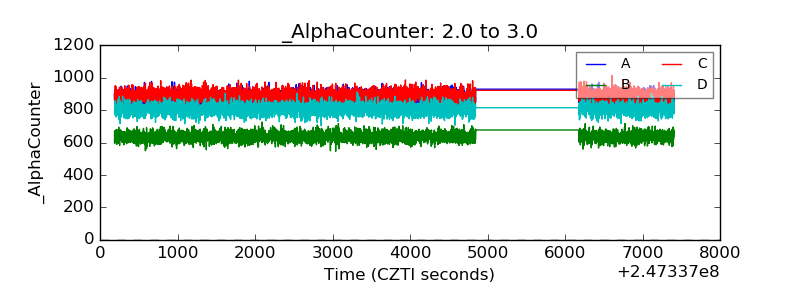 |
| _CPM_Rate | 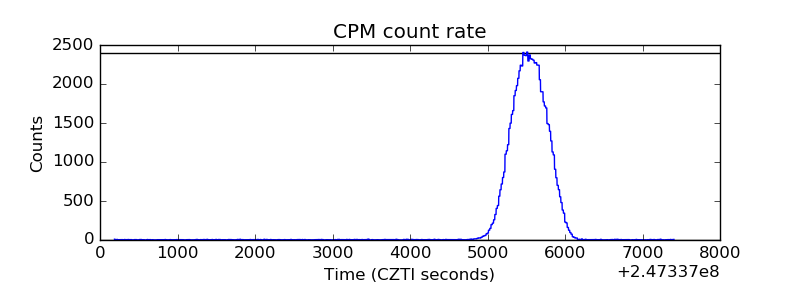 |
| CZT Counter | 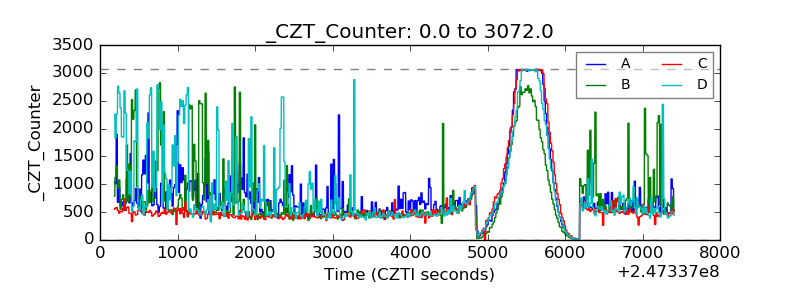 |
| +2.5 Volts monitor |  |
| +5 Volts monitor | 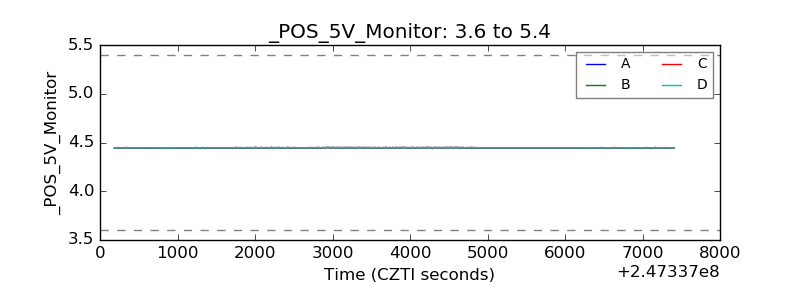 |
| _ROLL_ROT | 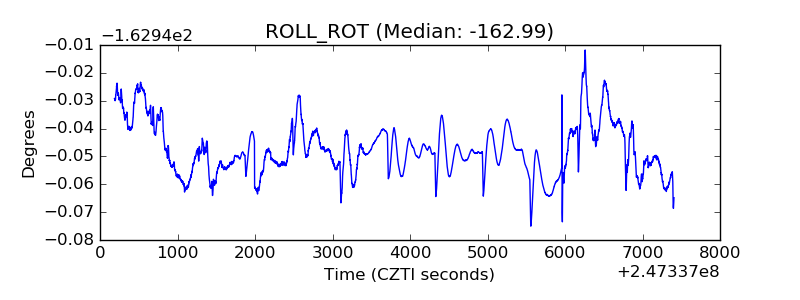 |
| _Roll_DEC | 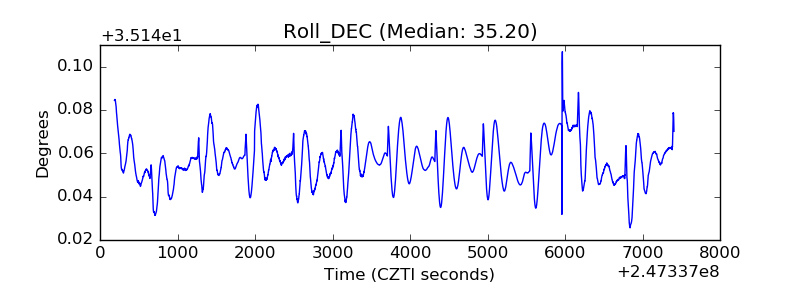 |
| _Roll_RA | 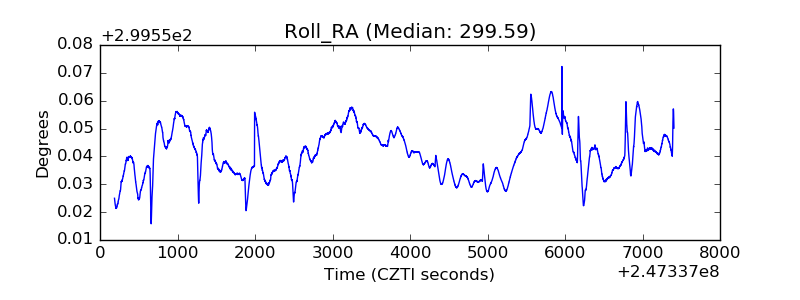 |
| Veto Counter | 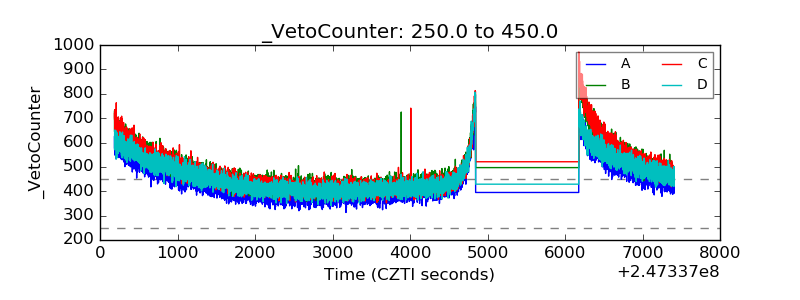 |