| Param | Original file | Final file |
|---|---|---|
| Filename | modeM0/AS1G08_062T01_9000001660_11349cztM0_level2.evt | modeM0/AS1G08_062T01_9000001660_11349cztM0_level2_quad_clean.evt |
| Size (bytes) | 710,979,840 | 81,653,760 |
| Size | 678.0 MB | 77.9 MB |
| Events in quadrant A | 3,445,458 | 539,119 |
| Events in quadrant B | 3,830,787 | 534,839 |
| Events in quadrant C | 2,948,756 | 545,522 |
| Events in quadrant D | 10,873,860 | 405,660 |
| Mode M0 | |||
|---|---|---|---|
| Quadrant | BADHDUFLAG | Total packets | Discarded packets |
| A | 0 | 14172 | 3 |
| B | 0 | 15635 | 2 |
| C | 0 | 13074 | 2 |
| D | 0 | 36693 | 2 |
| Mode SS | |||
|---|---|---|---|
| Quadrant | BADHDUFLAG | Total packets | Discarded packets |
| A | 0 | 130 | 0 |
| B | 0 | 130 | 0 |
| C | 0 | 130 | 0 |
| D | 0 | 130 | 0 |
| Mode M9 | |||
|---|---|---|---|
| Quadrant | BADHDUFLAG | Total packets | Discarded packets |
| A | 0 | 13 | 0 |
| B | 0 | 13 | 0 |
| C | 0 | 13 | 0 |
| D | 0 | 14 | 0 |
| Quadrant | Total seconds | Saturated seconds | Saturation percentage |
|---|---|---|---|
| A | 6401 | 34 | 0.531167% |
| B | 6401 | 260 | 4.061865% |
| C | 6401 | 18 | 0.281206% |
| D | 6401 | 3081 | 48.133104% |
Noise dominated data is calculated using 1-second bins in cleaned event files. If a bin has >2000 counts, and if more than 50% of those come from <1% of pixels, then it is considered to be noise-dominated and hence unusable.
| Quadrant | # 1 sec bins | Bins with >0 counts | Bins with >2000 counts | High rate bins dominated by noise | Noise dominated (total time) | Noise dominated (detector-on time) | Marked lightcurve |
|---|---|---|---|---|---|---|---|
| A | 7591 | 6402 | 5 | 5 | 0.07% | 0.08% | 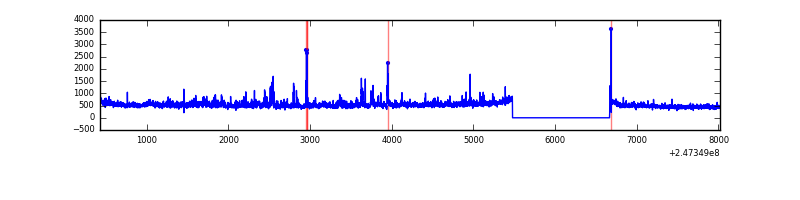 |
| B | 7591 | 6402 | 131 | 131 | 1.73% | 2.05% | 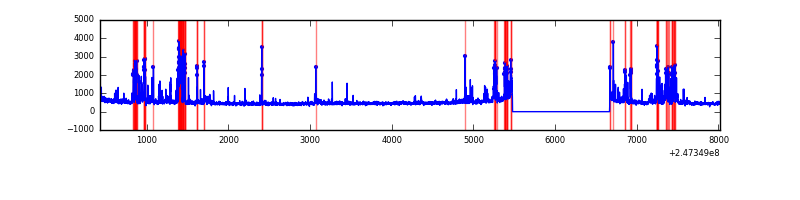 |
| C | 7591 | 6402 | 2 | 2 | 0.03% | 0.03% |  |
| D | 7591 | 6402 | 2493 | 2493 | 32.84% | 38.94% | 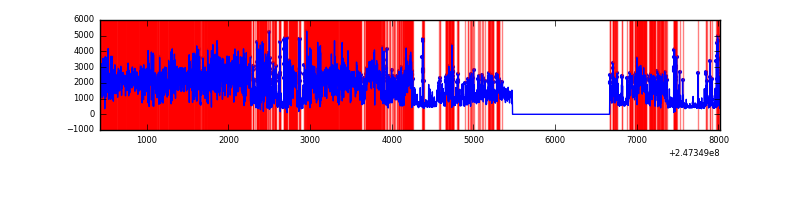 |
Top three noisy pixels from each quadrant. If the there are fewer than three noisy pixels in the level2.evt file, extra rows are filled as -1
| Pixel properties | Quadrant properties | ||||||
|---|---|---|---|---|---|---|---|
| Quadrant | DetID | PixID | Counts | Sigma | Mean | Median | Sigma |
| A | 13 | 251 | 296676 | 1936.83 | 758 | 742 | 152.8 |
| A | 1 | 162 | 64252 | 415.66 | 758 | 742 | 152.8 |
| A | 1 | 178 | 38543 | 247.4 | 758 | 742 | 152.8 |
| B | 4 | 239 | 749114 | 5255.62 | 755 | 737 | 142.4 |
| B | 3 | 189 | 32466 | 222.82 | 755 | 737 | 142.4 |
| B | 15 | 204 | 27973 | 191.27 | 755 | 737 | 142.4 |
| C | 4 | 175 | 8129 | 41.8 | 753 | 758 | 176.3 |
| C | 14 | 234 | 7532 | 38.41 | 753 | 758 | 176.3 |
| C | 13 | 61 | 5488 | 26.82 | 753 | 758 | 176.3 |
| D | 13 | 152 | 6535540 | 45950.37 | 591 | 576 | 142.2 |
| D | 10 | 253 | 971278 | 6825.46 | 591 | 576 | 142.2 |
| D | 2 | 14 | 671246 | 4715.79 | 591 | 576 | 142.2 |
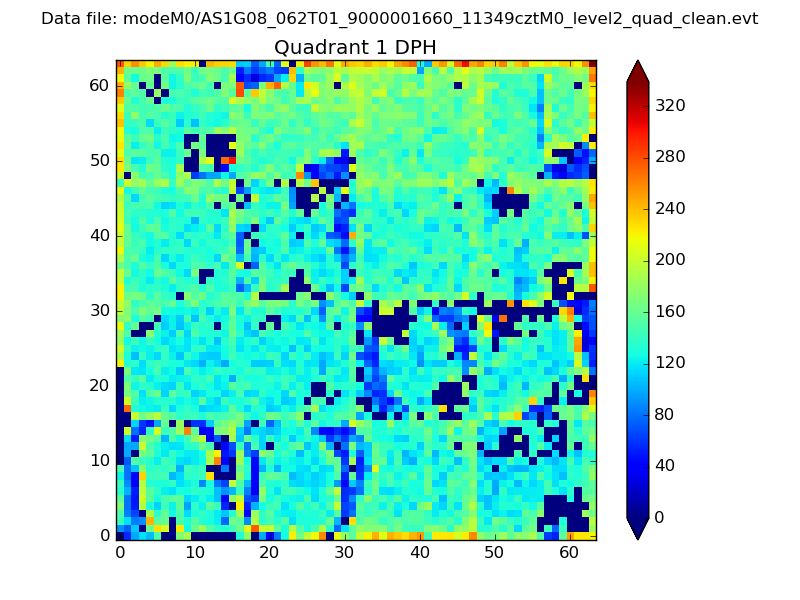
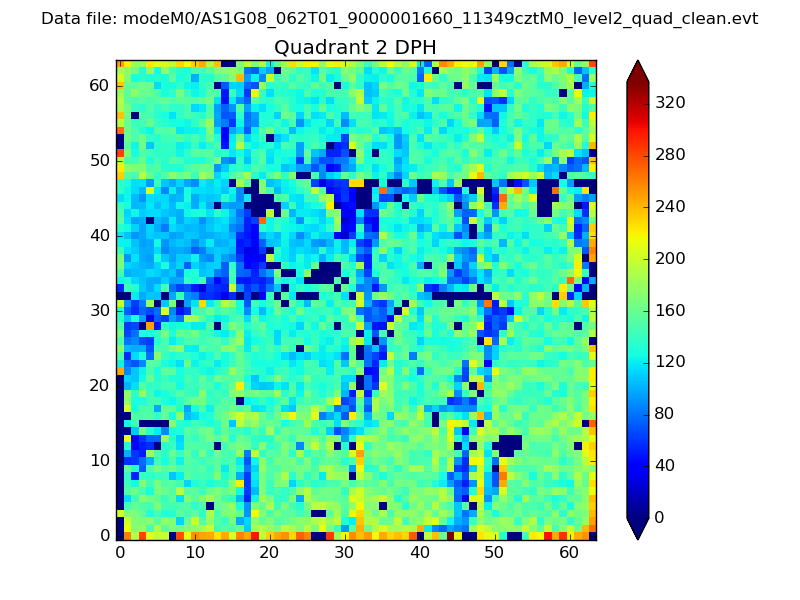
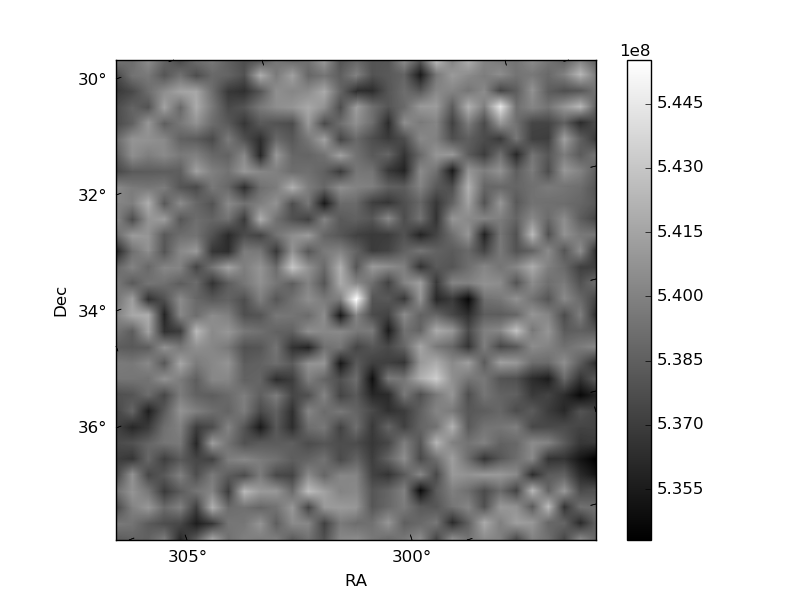
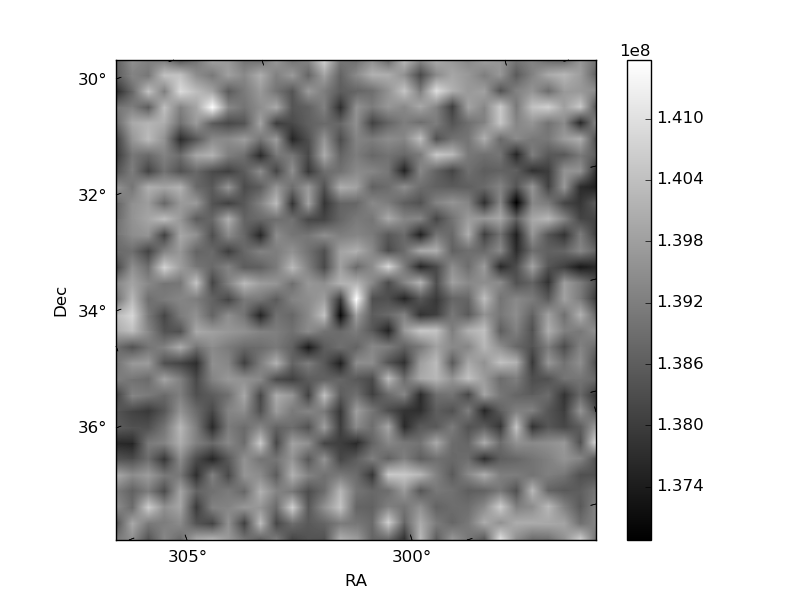
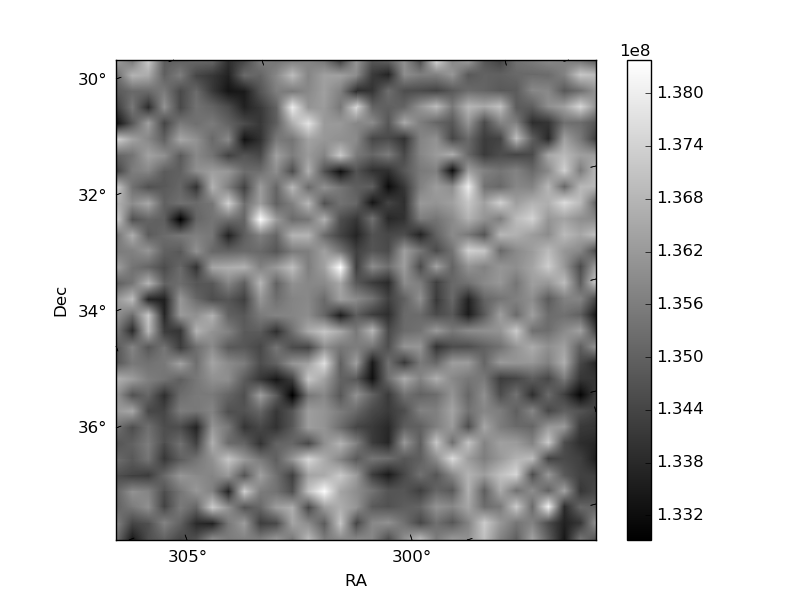
Histogram calculated using DETX and DETY for each event in the final _common_clean file
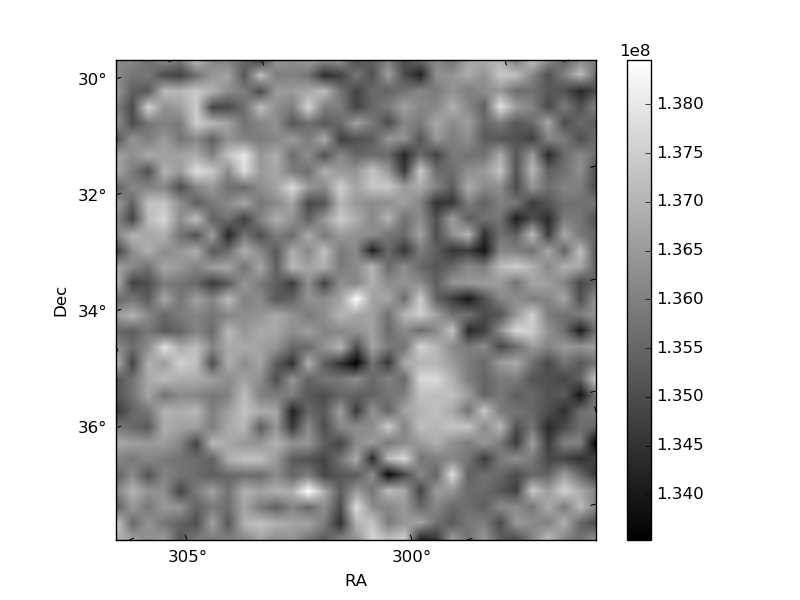
| Quadrant A | 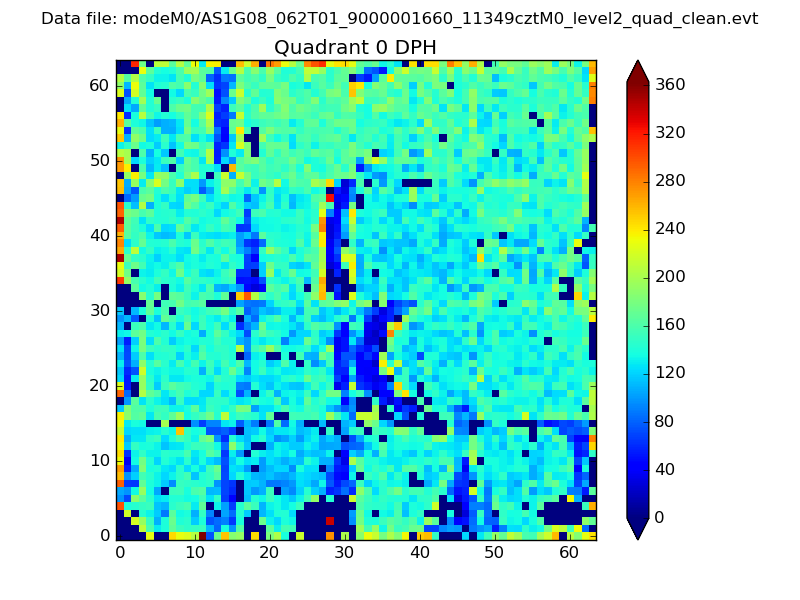 |
 |
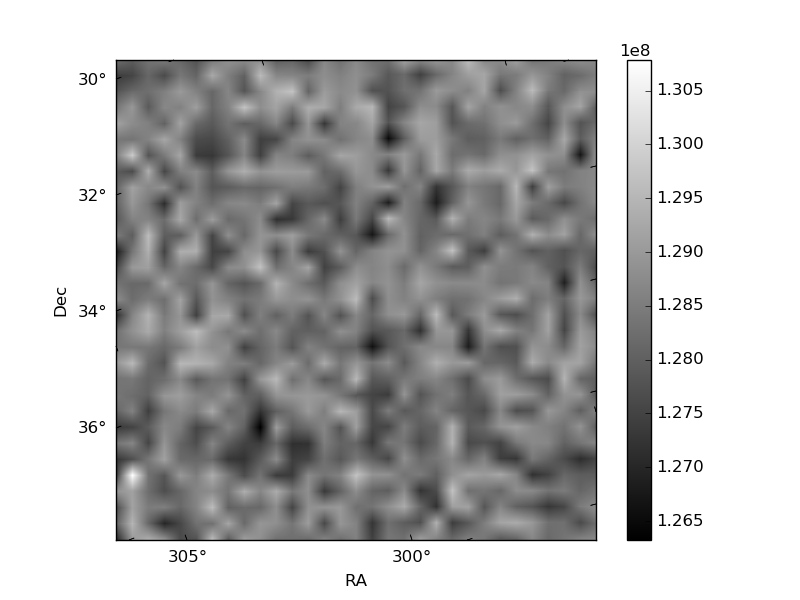
Quadrant B |
|---|---|---|---|
| Quadrant D | 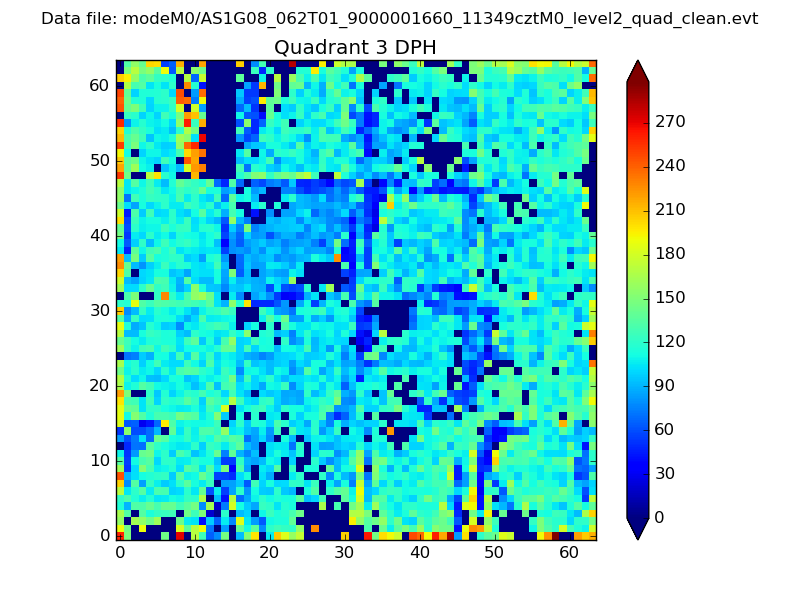 |
 |
Quadrant C |
| Plot type | Count rate plots | Images |
|---|---|---|
| Comparison with Poisson distribution Blue bars denote a histogram of data divided into 1 sec bins. Red curve is a Poisson curve with rate = median count rate of data. |
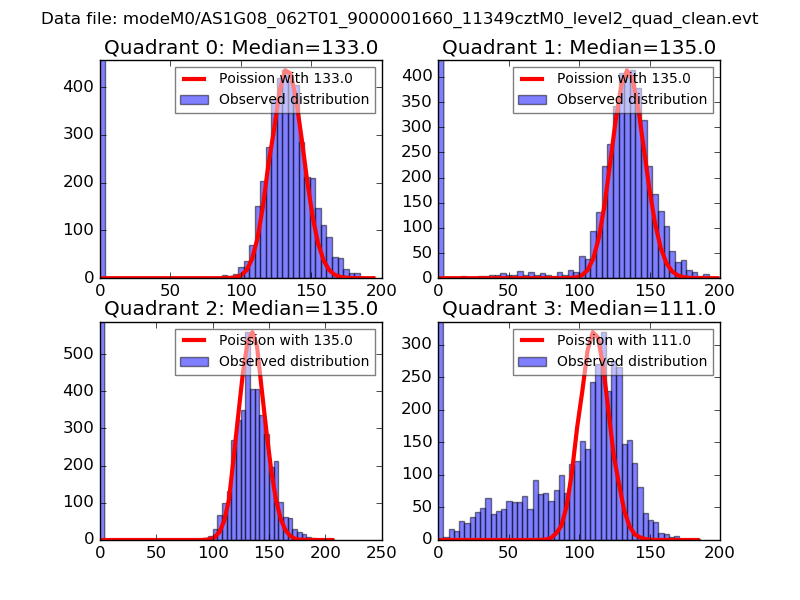 |
 |
| Quadrant-wise count rates Data is divided into 100 sec bins |
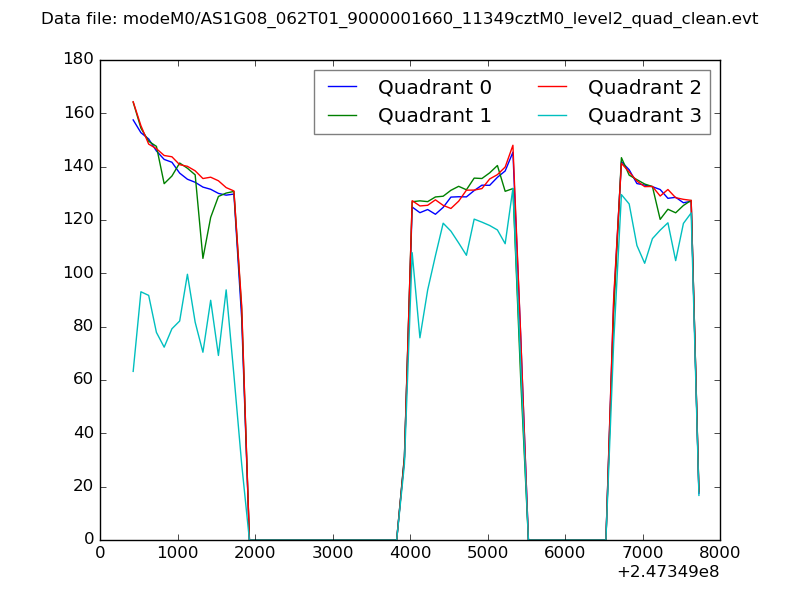 |
|
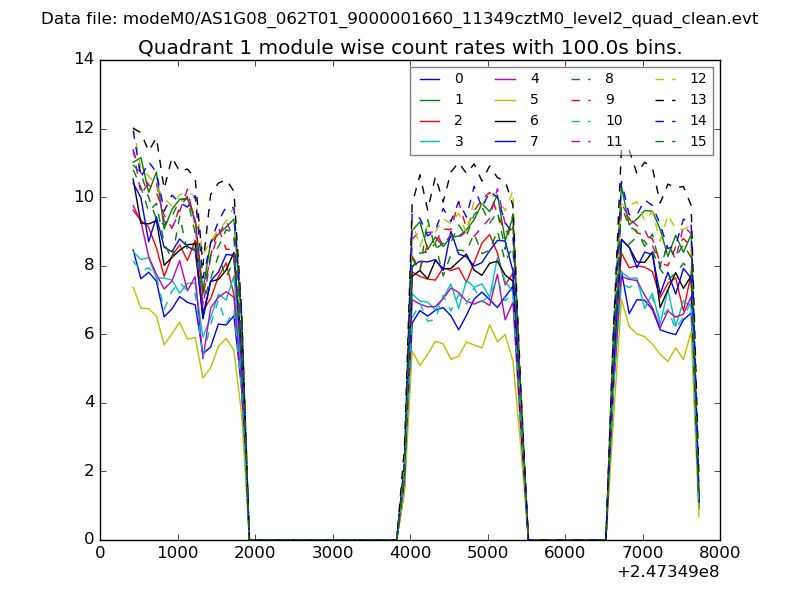
| Module-wise count rates for Quadrant A Data is divided into 100 sec bins |
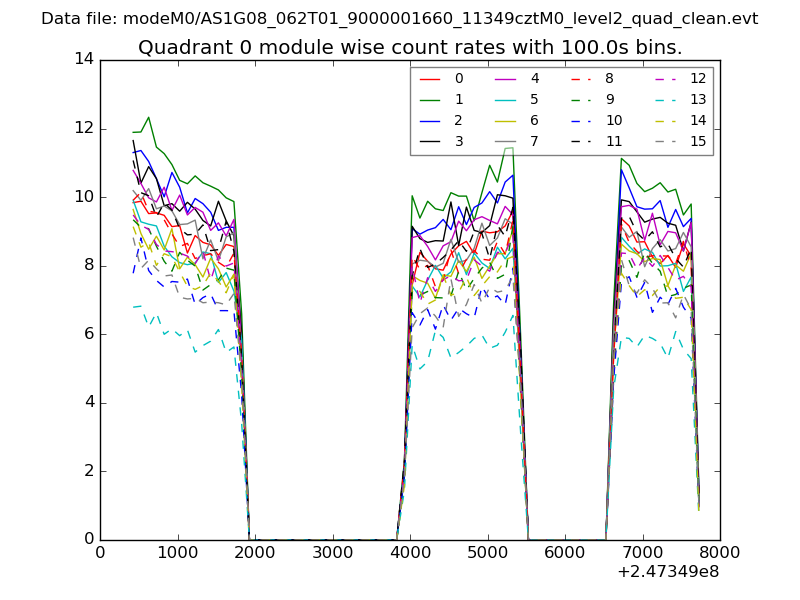 |
 |
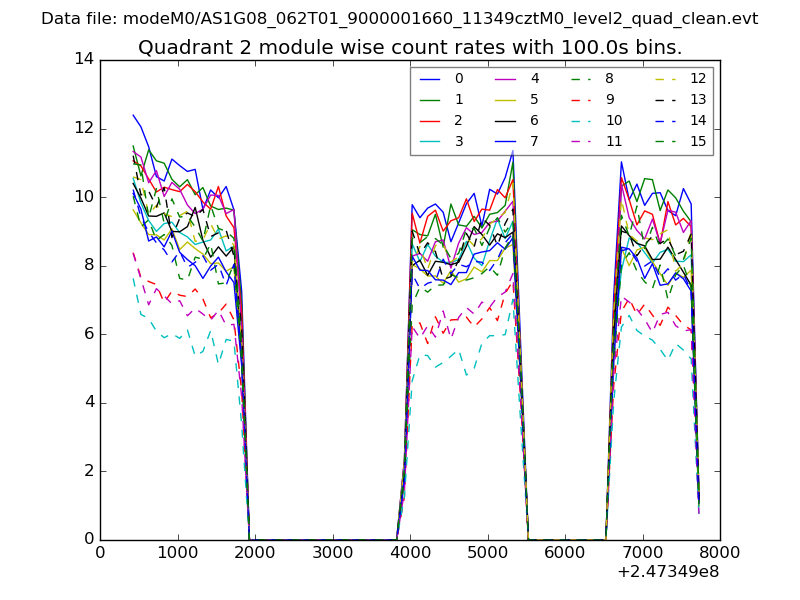
| Module-wise count rates for Quadrant B Data is divided into 100 sec bins |
 |
 |
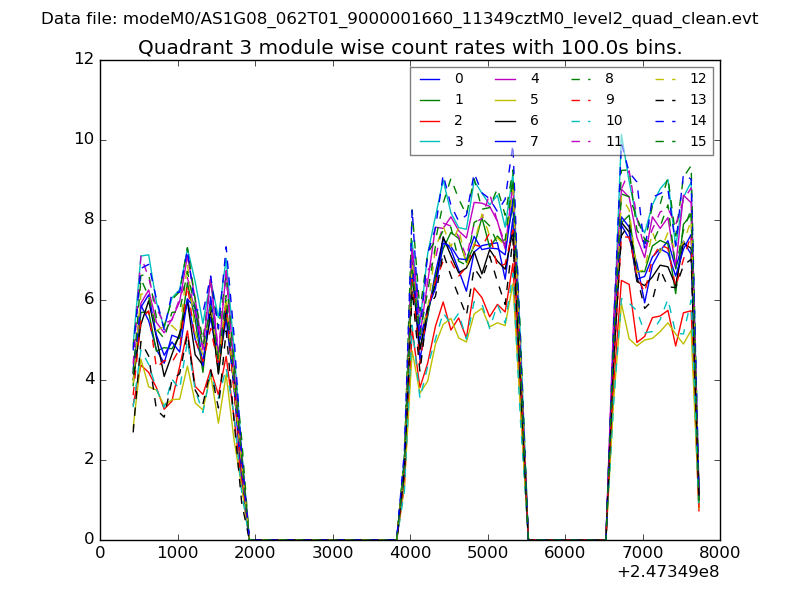
| Module-wise count rates for Quadrant C Data is divided into 100 sec bins |
 |
 |
| Module-wise count rates for Quadrant D Data is divided into 100 sec bins |
 |
 |
| Parameter | Plot |
|---|---|
| CZT HV Monitor | 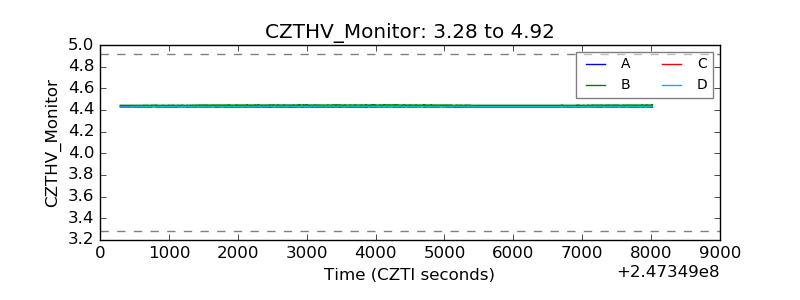 |
| D_VDD | 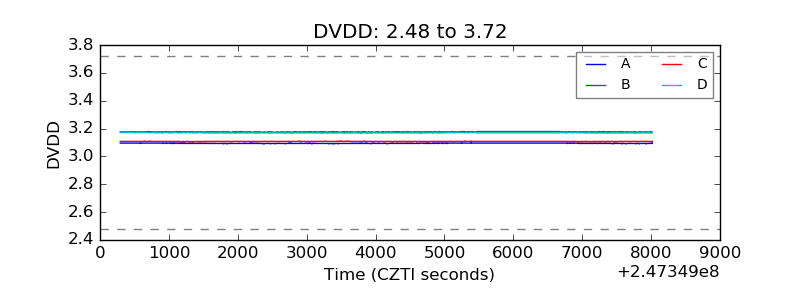 |
| Temperature 1 | 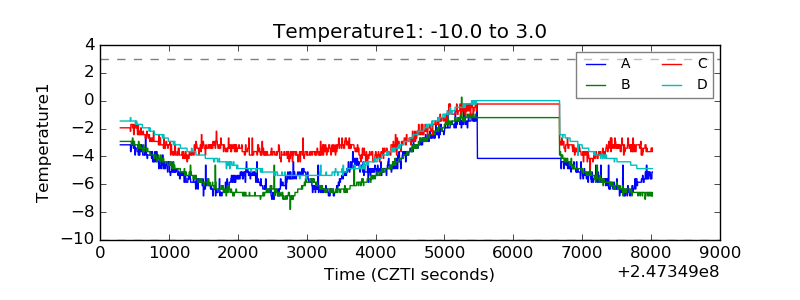 |
| Veto HV Monitor | 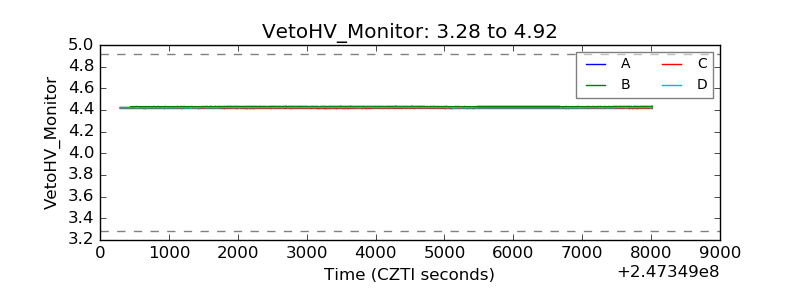 |
| Veto LLD | 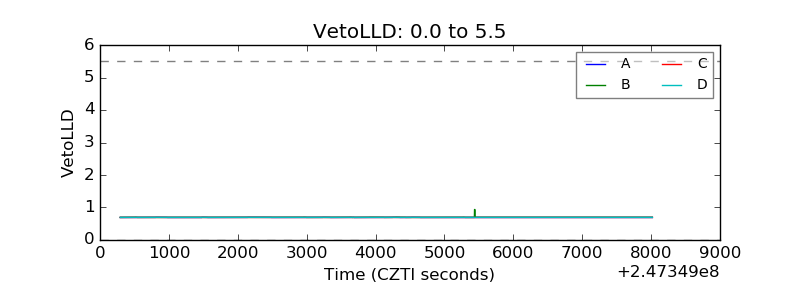 |
| Alpha Counter | 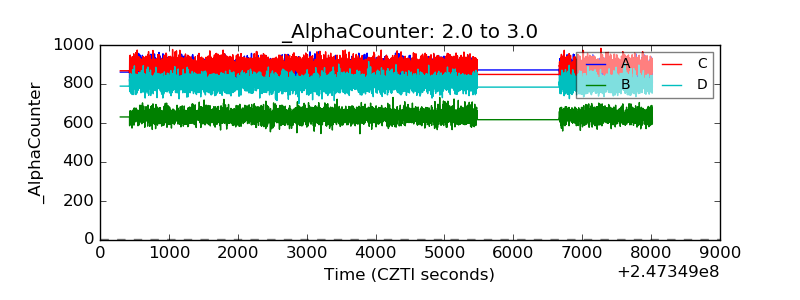 |
| _CPM_Rate | 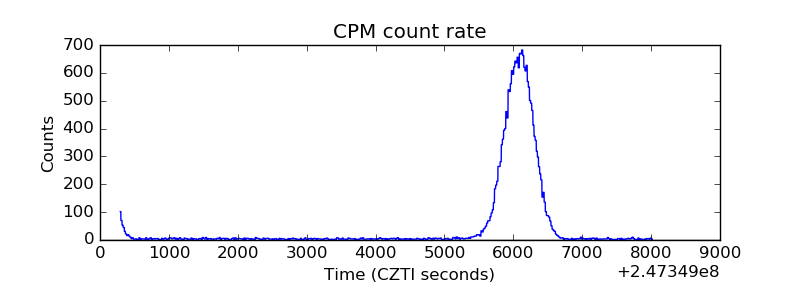 |
| CZT Counter | 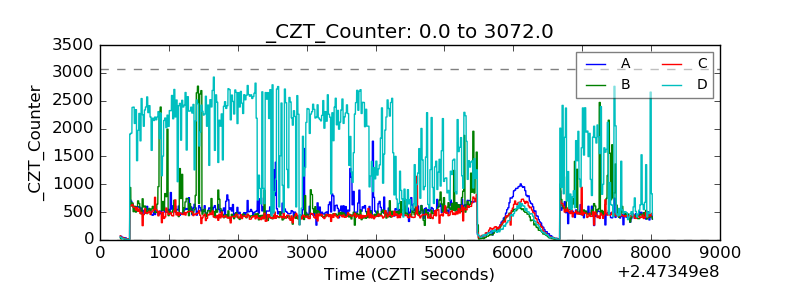 |
| +2.5 Volts monitor | 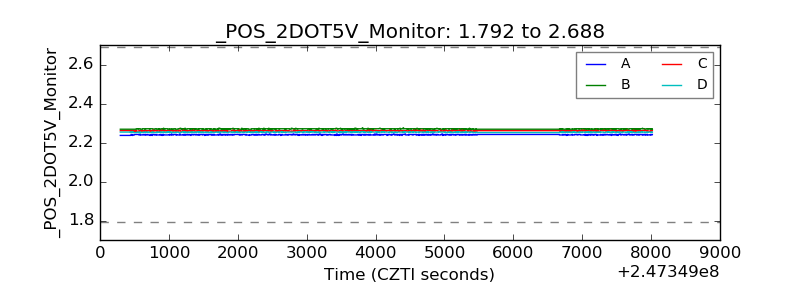 |
| +5 Volts monitor |  |
| _ROLL_ROT |  |
| _Roll_DEC | 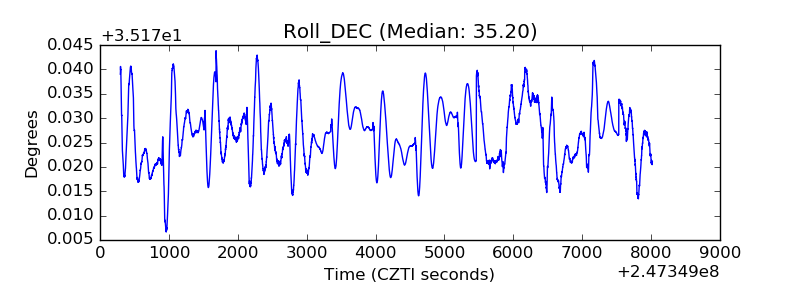 |
| _Roll_RA | 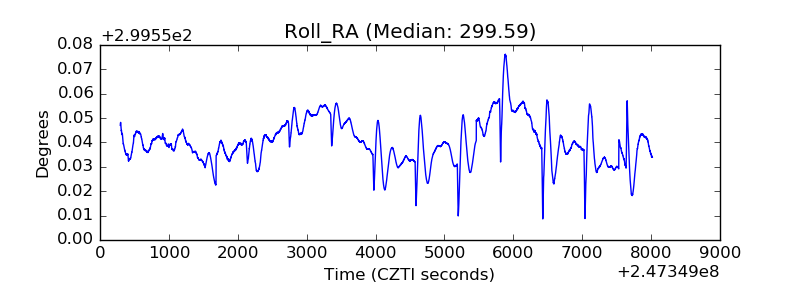 |
| Veto Counter | 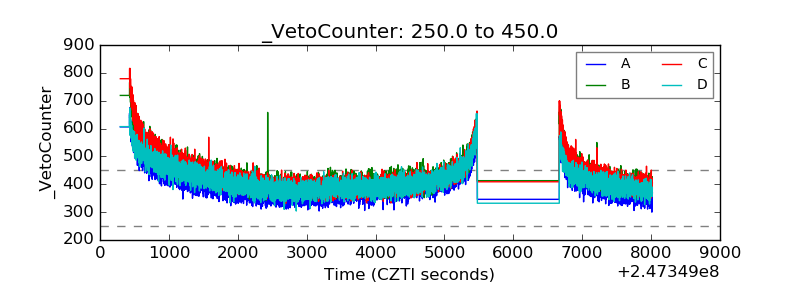 |