| Param | Original file | Final file |
|---|---|---|
| Filename | modeM0/AS1G08_062T01_9000001660_11350cztM0_level2.evt | modeM0/AS1G08_062T01_9000001660_11350cztM0_level2_quad_clean.evt |
| Size (bytes) | 615,303,360 | 73,327,680 |
| Size | 586.8 MB | 69.9 MB |
| Events in quadrant A | 3,276,945 | 459,622 |
| Events in quadrant B | 4,116,737 | 447,197 |
| Events in quadrant C | 2,959,440 | 461,113 |
| Events in quadrant D | 7,831,030 | 388,385 |
| Mode M0 | |||
|---|---|---|---|
| Quadrant | BADHDUFLAG | Total packets | Discarded packets |
| A | 0 | 14178 | 2 |
| B | 0 | 16749 | 1 |
| C | 0 | 13489 | 1 |
| D | 0 | 27857 | 1 |
| Mode SS | |||
|---|---|---|---|
| Quadrant | BADHDUFLAG | Total packets | Discarded packets |
| A | 0 | 136 | 0 |
| B | 0 | 136 | 0 |
| C | 0 | 136 | 0 |
| D | 0 | 136 | 0 |
| Mode M9 | |||
|---|---|---|---|
| Quadrant | BADHDUFLAG | Total packets | Discarded packets |
| A | 0 | 8 | 0 |
| B | 0 | 8 | 0 |
| C | 0 | 8 | 0 |
| D | 0 | 8 | 0 |
| Quadrant | Total seconds | Saturated seconds | Saturation percentage |
|---|---|---|---|
| A | 6643 | 33 | 0.496764% |
| B | 6643 | 320 | 4.817101% |
| C | 6643 | 24 | 0.361283% |
| D | 6643 | 1478 | 22.248984% |
Noise dominated data is calculated using 1-second bins in cleaned event files. If a bin has >2000 counts, and if more than 50% of those come from <1% of pixels, then it is considered to be noise-dominated and hence unusable.
| Quadrant | # 1 sec bins | Bins with >0 counts | Bins with >2000 counts | High rate bins dominated by noise | Noise dominated (total time) | Noise dominated (detector-on time) | Marked lightcurve |
|---|---|---|---|---|---|---|---|
| A | 7483 | 6644 | 1 | 1 | 0.01% | 0.02% | 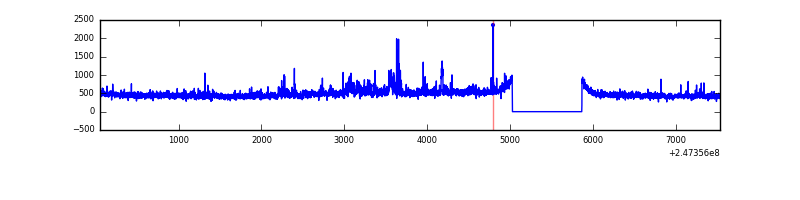 |
| B | 7483 | 6644 | 165 | 165 | 2.20% | 2.48% | 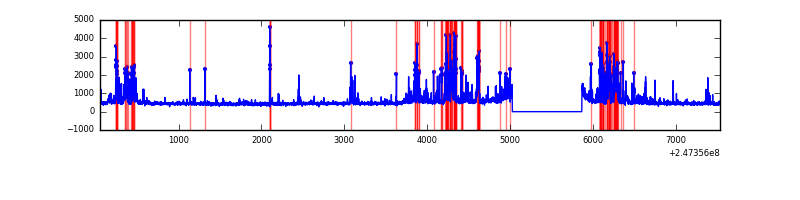 |
| C | 7483 | 6644 | 0 | 0 | 0.00% | 0.00% |  |
| D | 7483 | 6644 | 1171 | 1171 | 15.65% | 17.62% | 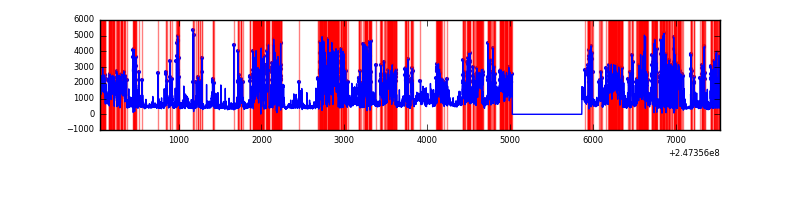 |
Top three noisy pixels from each quadrant. If the there are fewer than three noisy pixels in the level2.evt file, extra rows are filled as -1
| Pixel properties | Quadrant properties | ||||||
|---|---|---|---|---|---|---|---|
| Quadrant | DetID | PixID | Counts | Sigma | Mean | Median | Sigma |
| A | 13 | 210 | 173609 | 1107.58 | 767 | 749 | 156.1 |
| A | 1 | 162 | 44347 | 279.35 | 767 | 749 | 156.1 |
| A | 1 | 178 | 26791 | 166.86 | 767 | 749 | 156.1 |
| B | 4 | 239 | 716760 | 4982.17 | 759 | 742 | 143.7 |
| B | 3 | 64 | 286744 | 1990.05 | 759 | 742 | 143.7 |
| B | 15 | 204 | 68708 | 472.92 | 759 | 742 | 143.7 |
| C | 4 | 175 | 16732 | 90.95 | 753 | 758 | 175.6 |
| C | 13 | 61 | 5475 | 26.86 | 753 | 758 | 175.6 |
| C | 12 | 4 | 3375 | 14.9 | 753 | 758 | 175.6 |
| D | 13 | 152 | 2467676 | 15266.75 | 668 | 649 | 161.6 |
| D | 10 | 253 | 2232341 | 13810.42 | 668 | 649 | 161.6 |
| D | 2 | 120 | 291025 | 1796.94 | 668 | 649 | 161.6 |
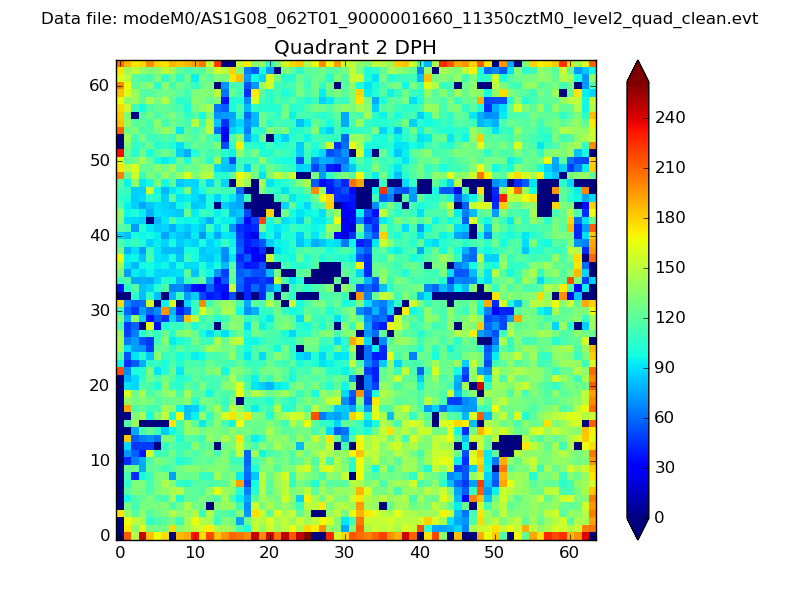
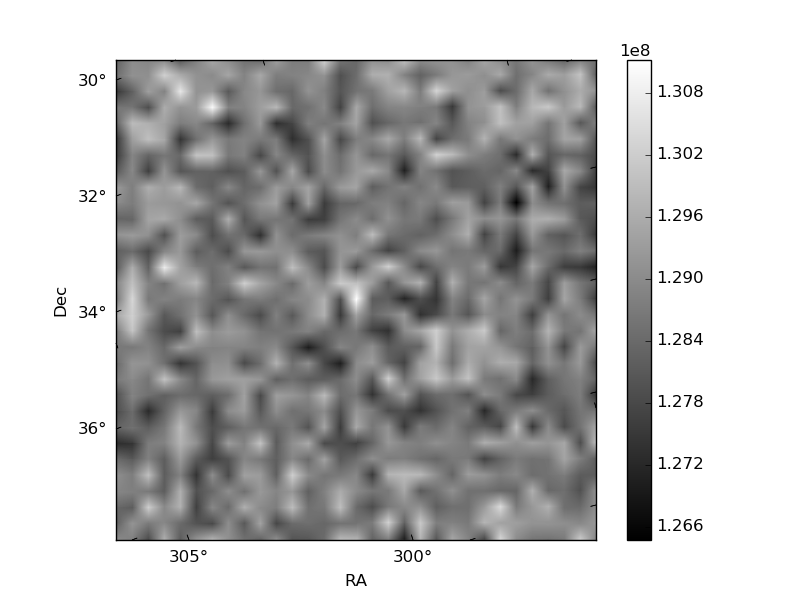
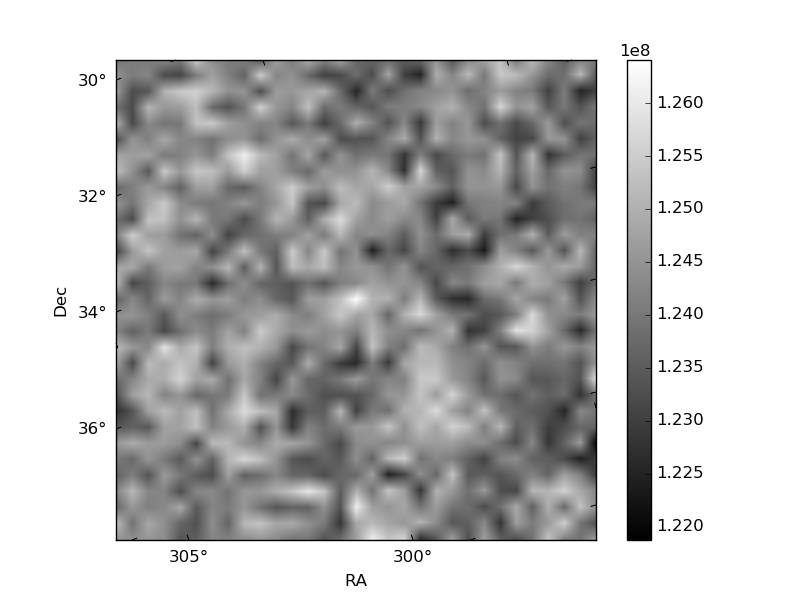
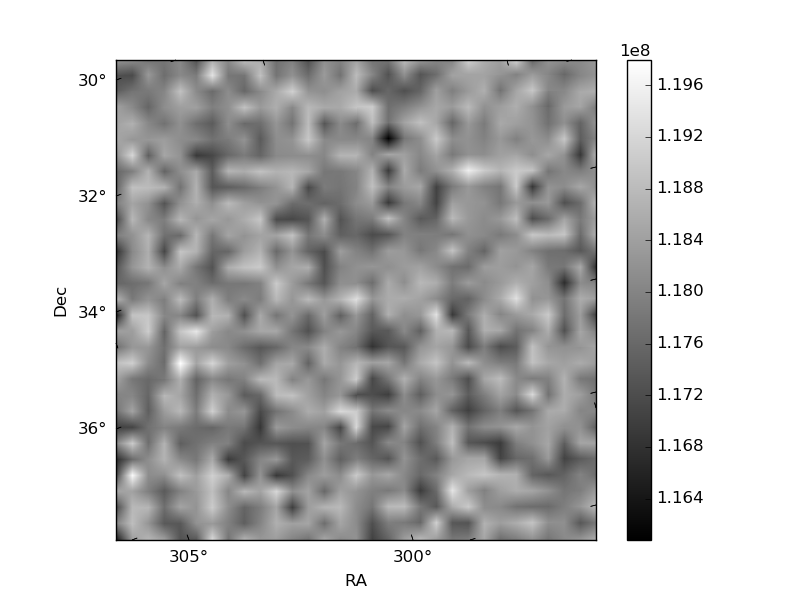
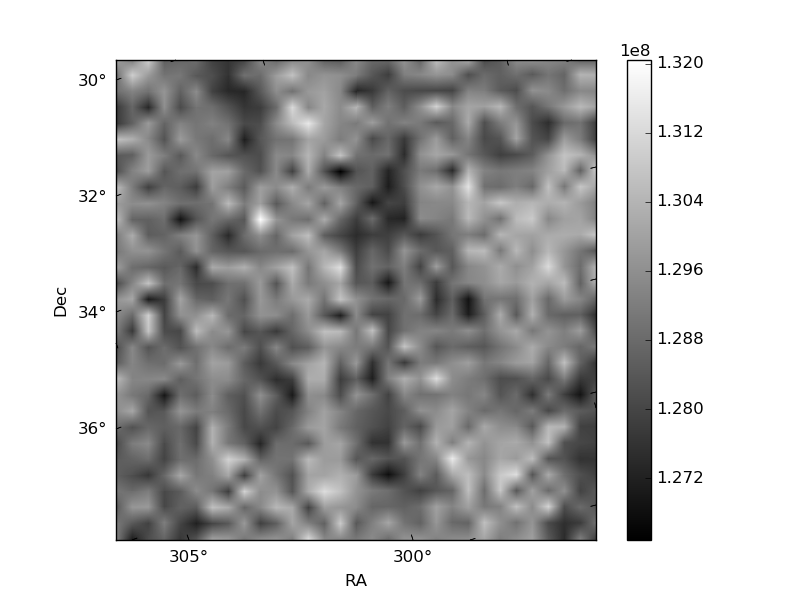
Histogram calculated using DETX and DETY for each event in the final _common_clean file
| Quadrant A | 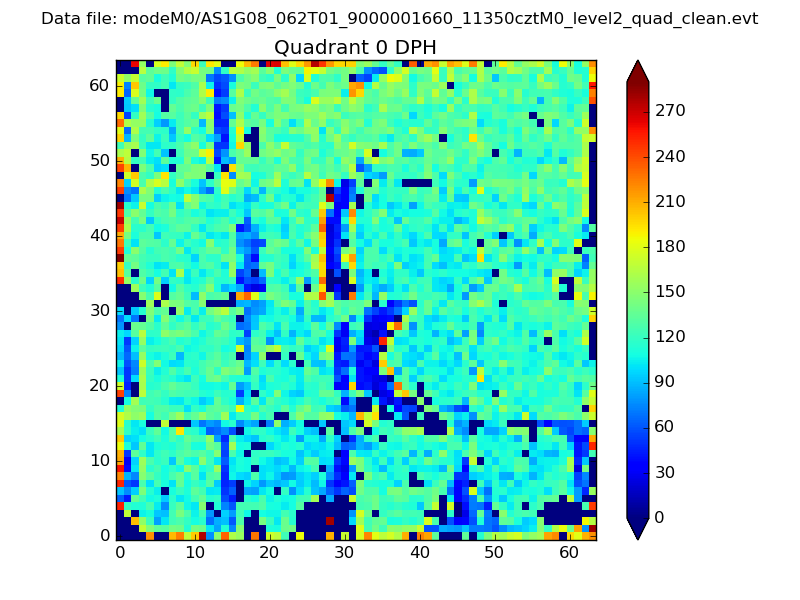 |
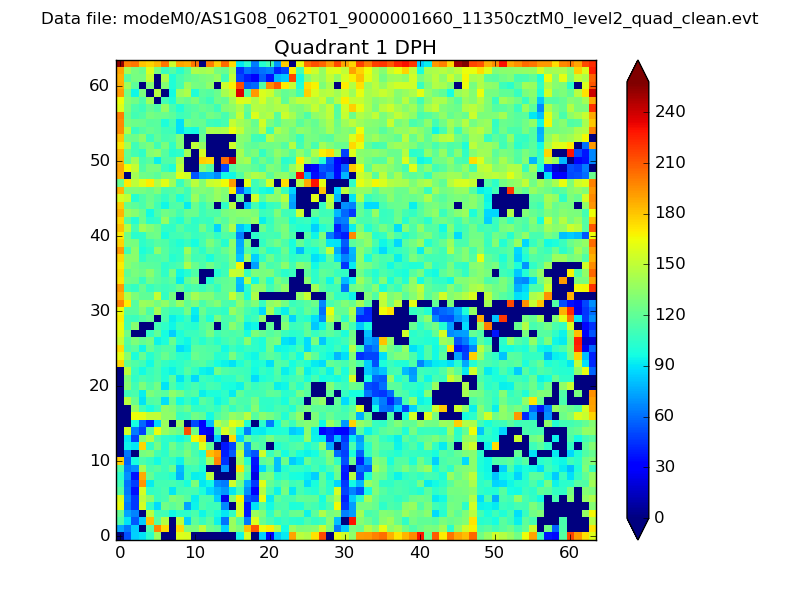 |
Quadrant B |
|---|---|---|---|
| Quadrant D | 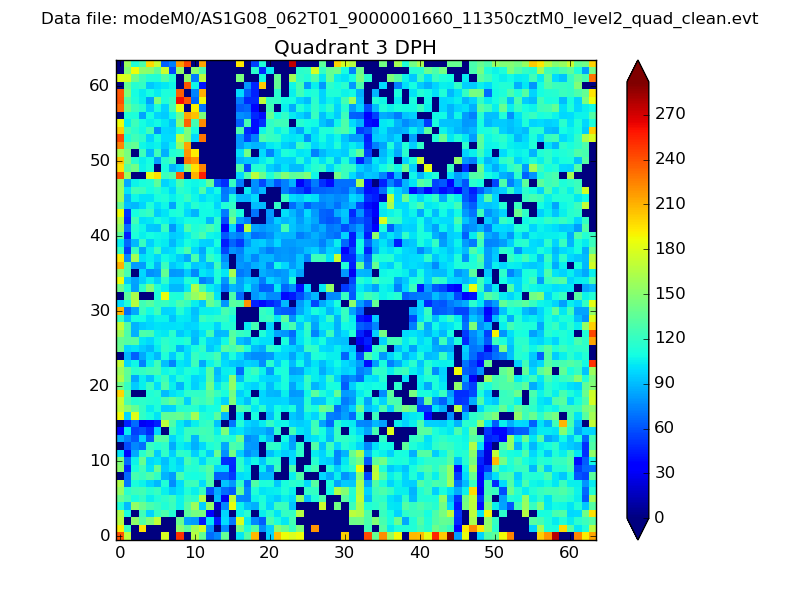 |
 |
Quadrant C |
| Plot type | Count rate plots | Images |
|---|---|---|
| Comparison with Poisson distribution Blue bars denote a histogram of data divided into 1 sec bins. Red curve is a Poisson curve with rate = median count rate of data. |
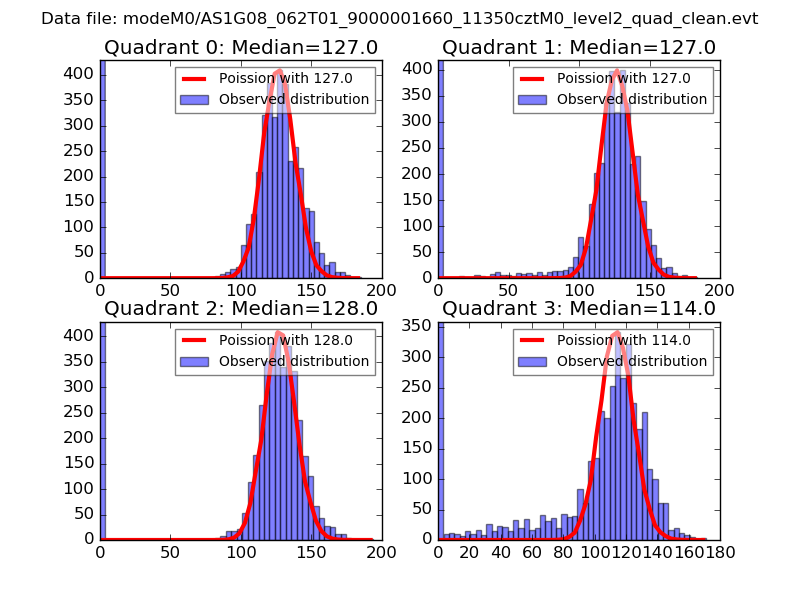 |
 |
| Quadrant-wise count rates Data is divided into 100 sec bins |
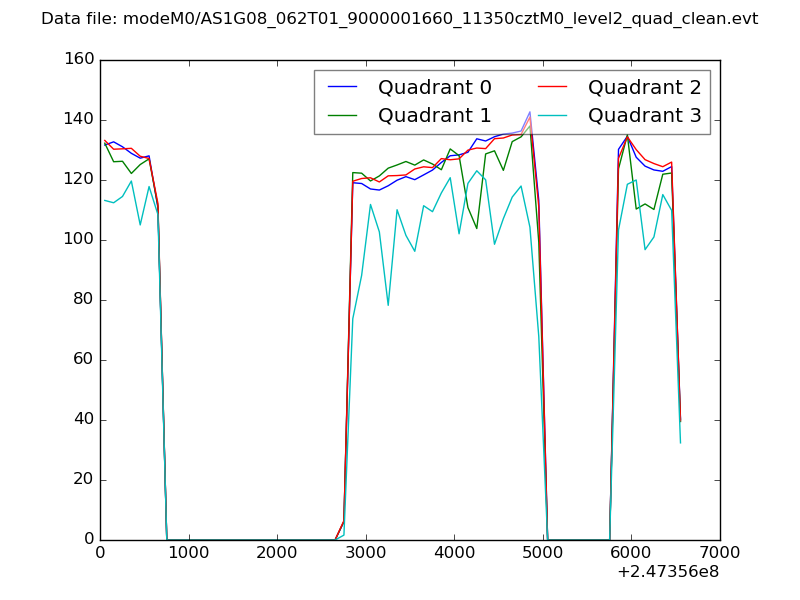 |
|
| Module-wise count rates for Quadrant A Data is divided into 100 sec bins |
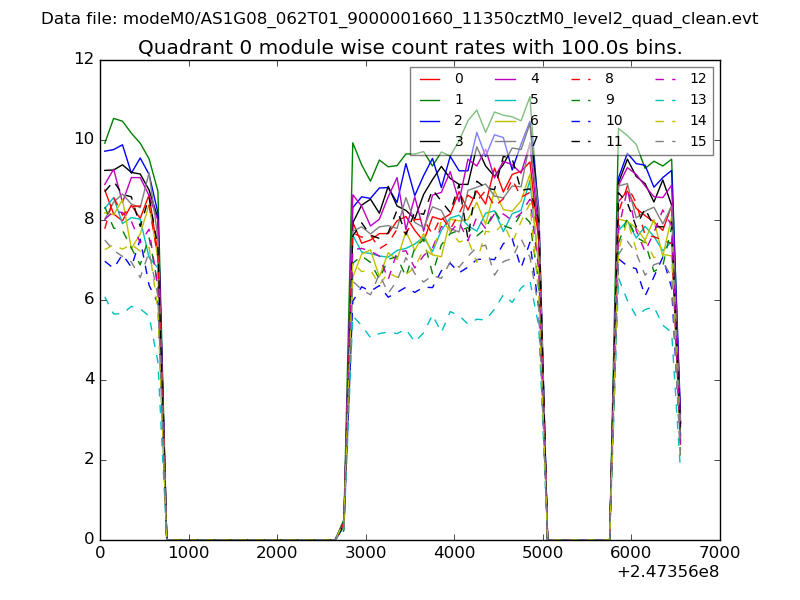 |
 |
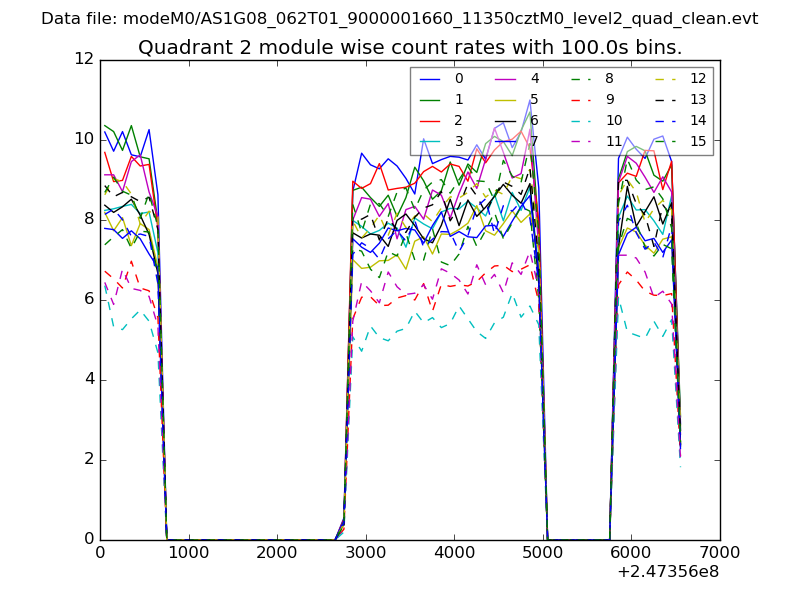
| Module-wise count rates for Quadrant B Data is divided into 100 sec bins |
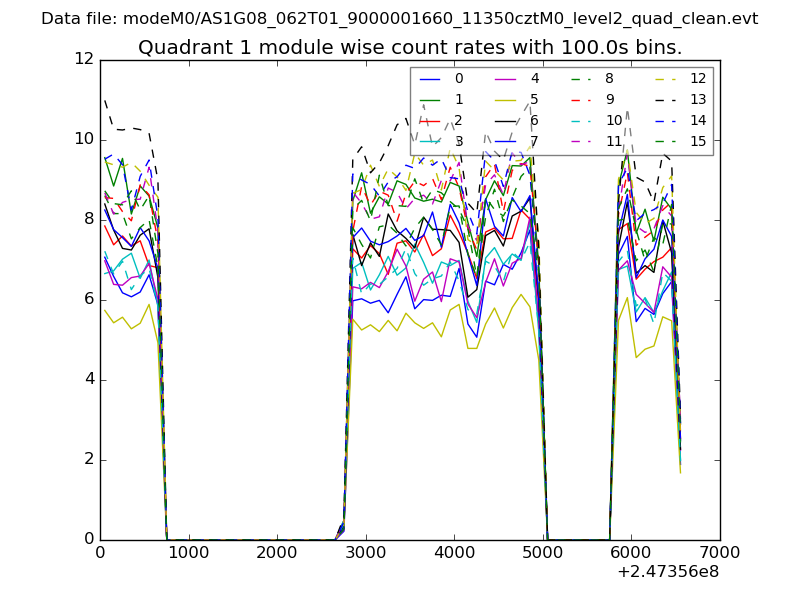 |
 |
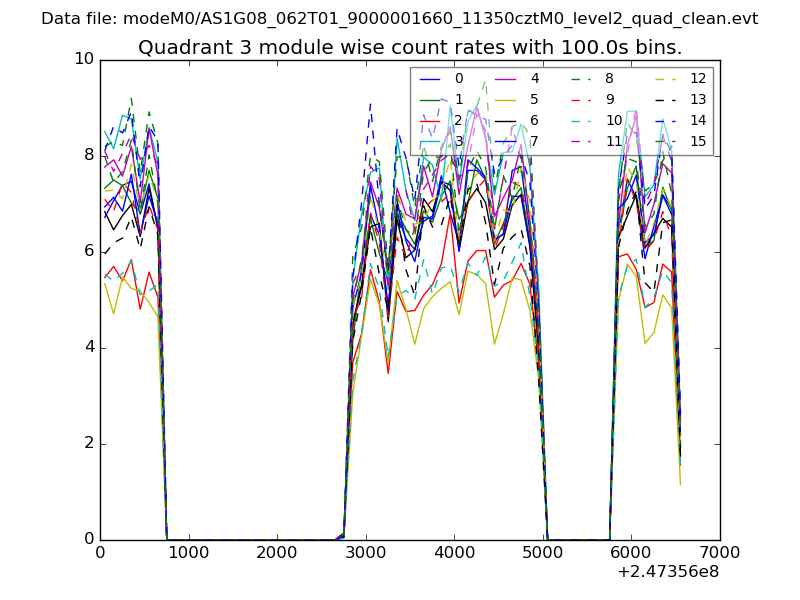
| Module-wise count rates for Quadrant C Data is divided into 100 sec bins |
 |
 |
| Module-wise count rates for Quadrant D Data is divided into 100 sec bins |
 |
 |
| Parameter | Plot |
|---|---|
| CZT HV Monitor | 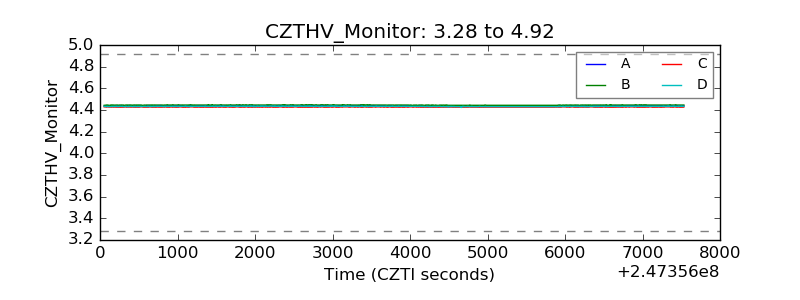 |
| D_VDD | 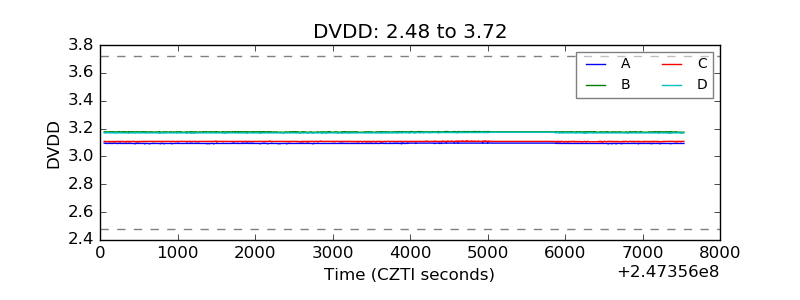 |
| Temperature 1 | 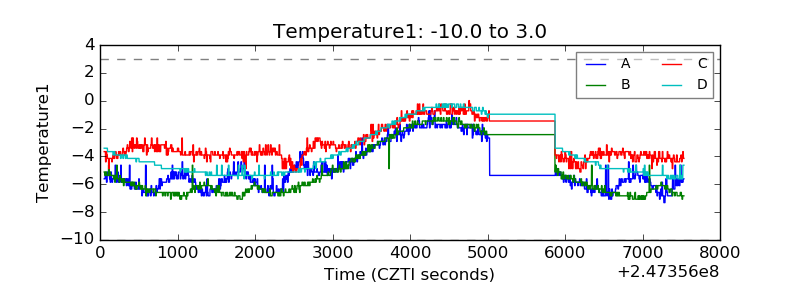 |
| Veto HV Monitor | 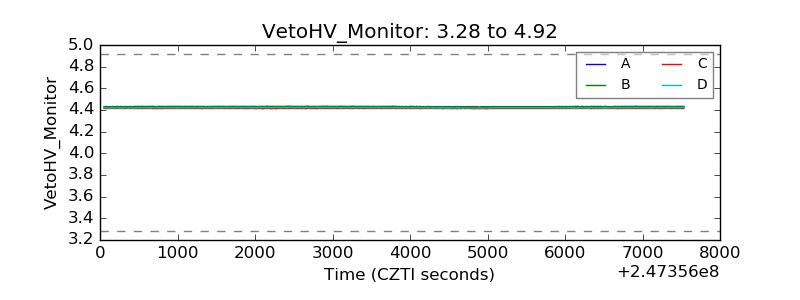 |
| Veto LLD | 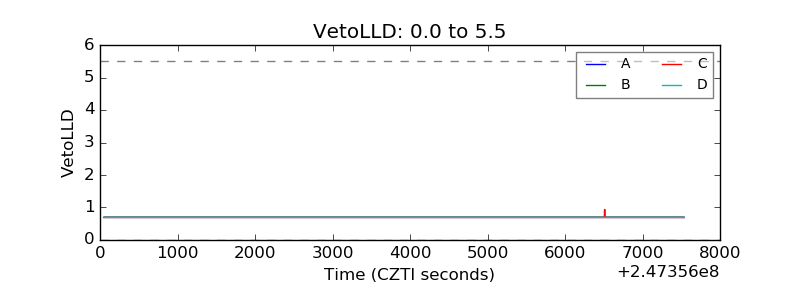 |
| Alpha Counter | 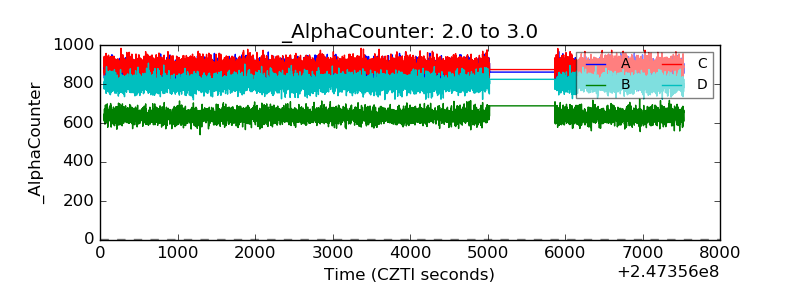 |
| _CPM_Rate | 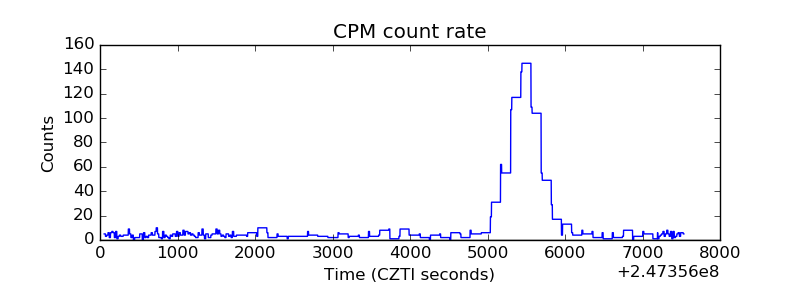 |
| CZT Counter |  |
| +2.5 Volts monitor |  |
| +5 Volts monitor |  |
| _ROLL_ROT | 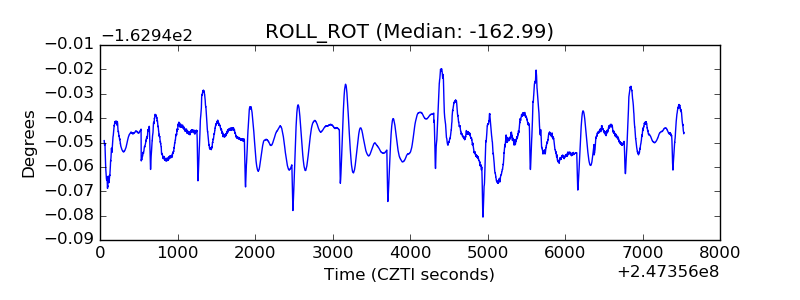 |
| _Roll_DEC | 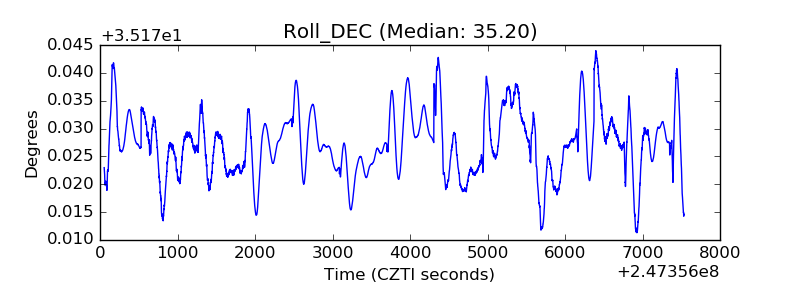 |
| _Roll_RA | 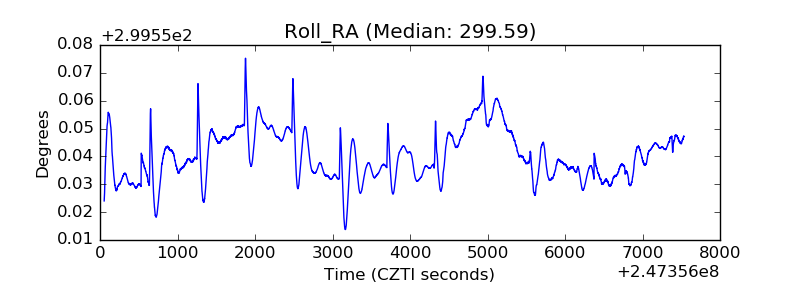 |
| Veto Counter | 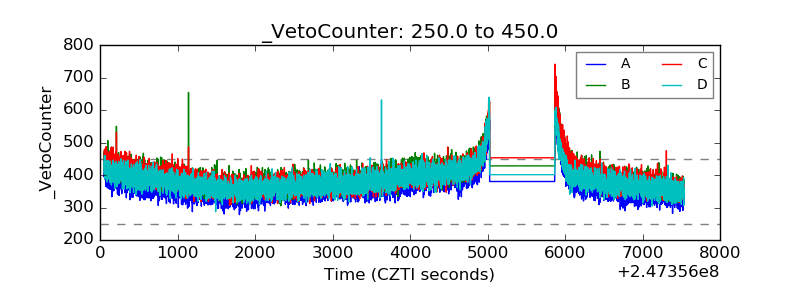 |