| Param | Original file | Final file |
|---|---|---|
| Filename | modeM0/AS1G08_062T01_9000001660_11351cztM0_level2.evt | modeM0/AS1G08_062T01_9000001660_11351cztM0_level2_quad_clean.evt |
| Size (bytes) | 656,542,080 | 81,705,600 |
| Size | 626.1 MB | 77.9 MB |
| Events in quadrant A | 3,590,065 | 506,594 |
| Events in quadrant B | 5,151,156 | 483,942 |
| Events in quadrant C | 3,320,889 | 510,503 |
| Events in quadrant D | 7,322,829 | 460,466 |
| Mode M0 | |||
|---|---|---|---|
| Quadrant | BADHDUFLAG | Total packets | Discarded packets |
| A | 0 | 15661 | 4 |
| B | 0 | 20255 | 2 |
| C | 0 | 15036 | 2 |
| D | 0 | 26923 | 2 |
| Mode SS | |||
|---|---|---|---|
| Quadrant | BADHDUFLAG | Total packets | Discarded packets |
| A | 0 | 150 | 0 |
| B | 0 | 150 | 0 |
| C | 0 | 150 | 0 |
| D | 0 | 150 | 0 |
| Mode M9 | |||
|---|---|---|---|
| Quadrant | BADHDUFLAG | Total packets | Discarded packets |
| A | 0 | 9 | 0 |
| B | 0 | 9 | 0 |
| C | 0 | 9 | 0 |
| D | 0 | 9 | 0 |
| Quadrant | Total seconds | Saturated seconds | Saturation percentage |
|---|---|---|---|
| A | 7353 | 43 | 0.584795% |
| B | 7353 | 672 | 9.139127% |
| C | 7353 | 20 | 0.271998% |
| D | 7353 | 1288 | 17.516660% |
Noise dominated data is calculated using 1-second bins in cleaned event files. If a bin has >2000 counts, and if more than 50% of those come from <1% of pixels, then it is considered to be noise-dominated and hence unusable.
| Quadrant | # 1 sec bins | Bins with >0 counts | Bins with >2000 counts | High rate bins dominated by noise | Noise dominated (total time) | Noise dominated (detector-on time) | Marked lightcurve |
|---|---|---|---|---|---|---|---|
| A | 7785 | 7355 | 0 | 0 | 0.00% | 0.00% | 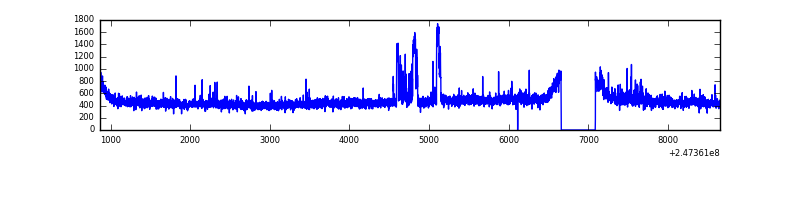 |
| B | 7785 | 7355 | 363 | 363 | 4.66% | 4.94% | 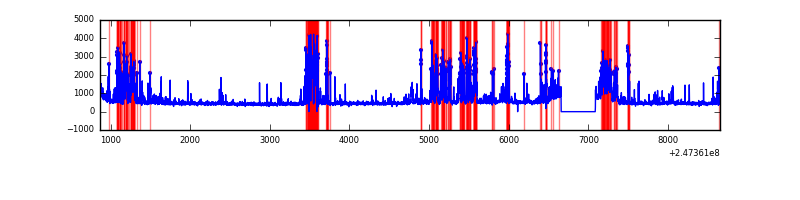 |
| C | 7785 | 7355 | 0 | 0 | 0.00% | 0.00% | 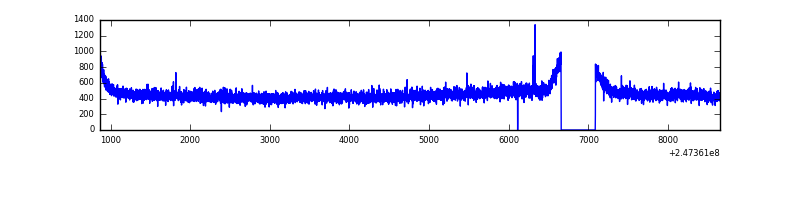 |
| D | 7785 | 7354 | 1058 | 1058 | 13.59% | 14.39% | 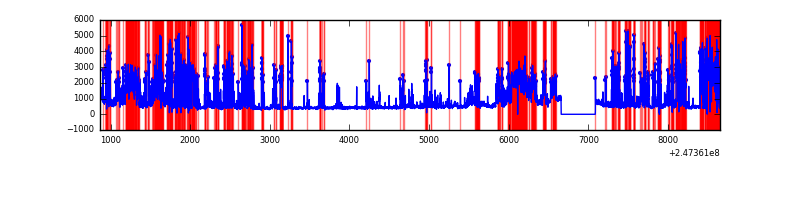 |
Top three noisy pixels from each quadrant. If the there are fewer than three noisy pixels in the level2.evt file, extra rows are filled as -1
| Pixel properties | Quadrant properties | ||||||
|---|---|---|---|---|---|---|---|
| Quadrant | DetID | PixID | Counts | Sigma | Mean | Median | Sigma |
| A | 15 | 174 | 154123 | 877.47 | 860 | 838 | 174.7 |
| A | 13 | 251 | 78946 | 447.12 | 860 | 838 | 174.7 |
| A | 8 | 5 | 11693 | 62.14 | 860 | 838 | 174.7 |
| B | 4 | 239 | 1275395 | 7965.31 | 832 | 811 | 160.0 |
| B | 3 | 64 | 470392 | 2934.57 | 832 | 811 | 160.0 |
| B | 15 | 204 | 52564 | 323.42 | 832 | 811 | 160.0 |
| C | 4 | 175 | 10729 | 50.32 | 846 | 852 | 196.3 |
| C | 13 | 61 | 6447 | 28.5 | 846 | 852 | 196.3 |
| C | 8 | 128 | 4497 | 18.57 | 846 | 852 | 196.3 |
| D | 10 | 253 | 2318900 | 12330.25 | 773 | 750 | 188.0 |
| D | 13 | 152 | 1341317 | 7130.48 | 773 | 750 | 188.0 |
| D | 2 | 120 | 281614 | 1493.92 | 773 | 750 | 188.0 |
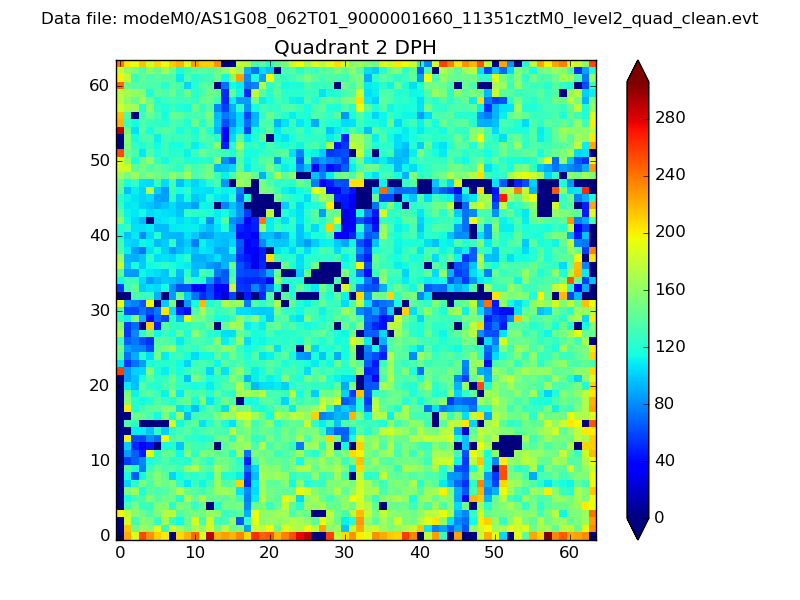
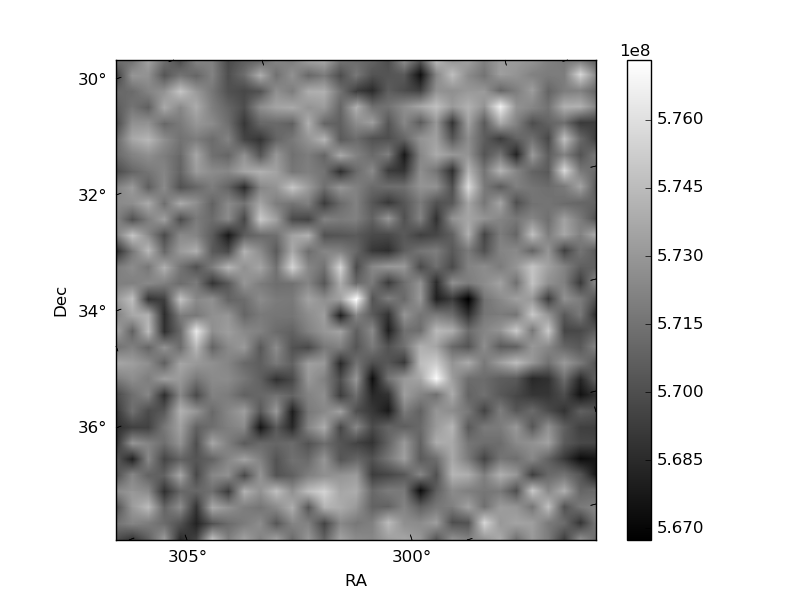
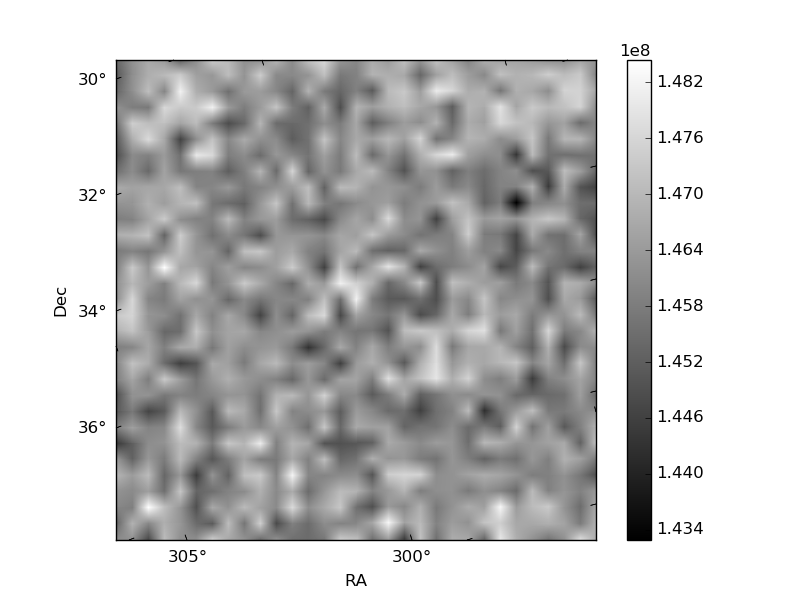
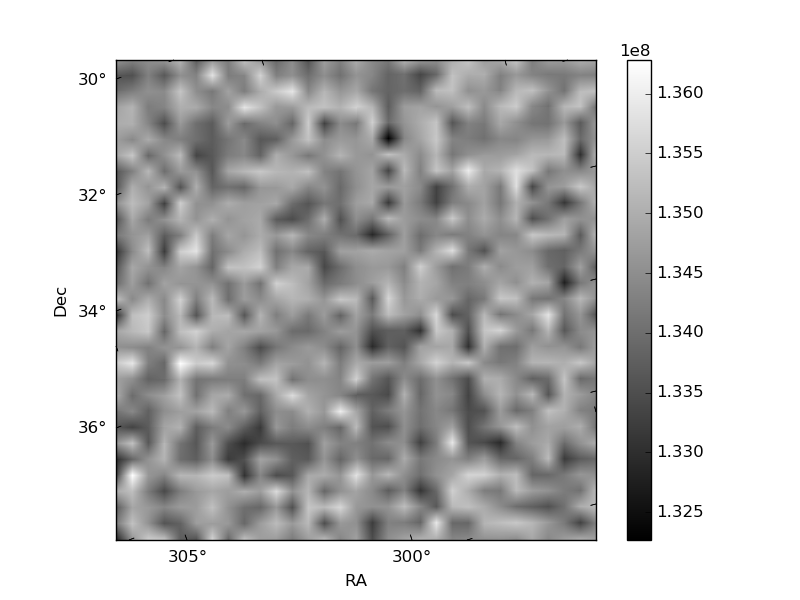
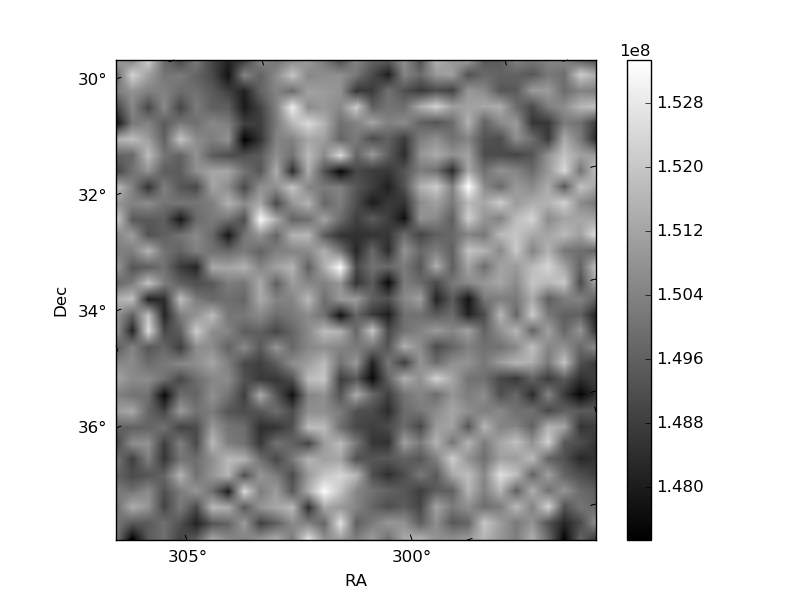
Histogram calculated using DETX and DETY for each event in the final _common_clean file
| Quadrant A | 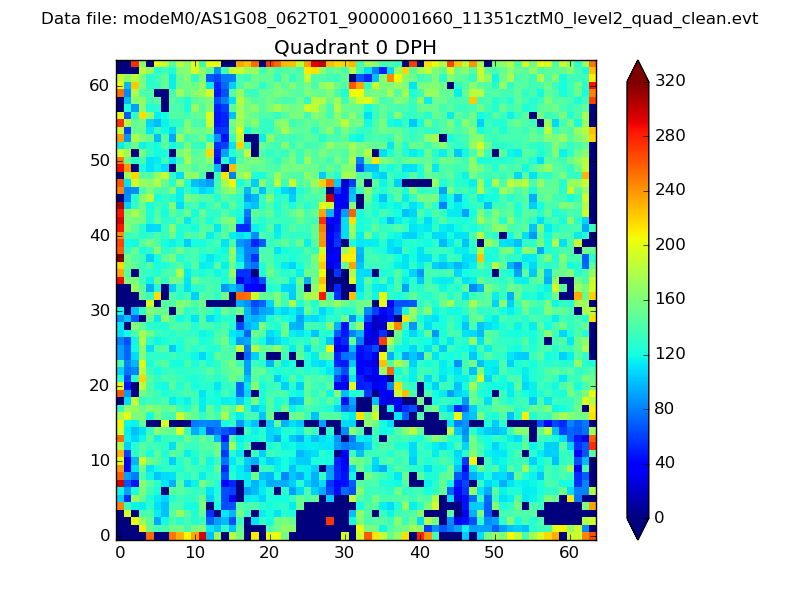 |
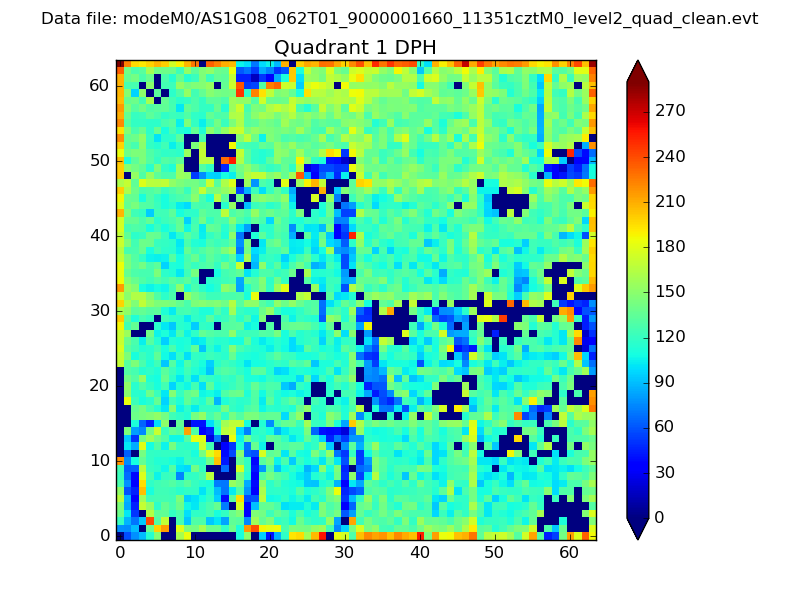 |
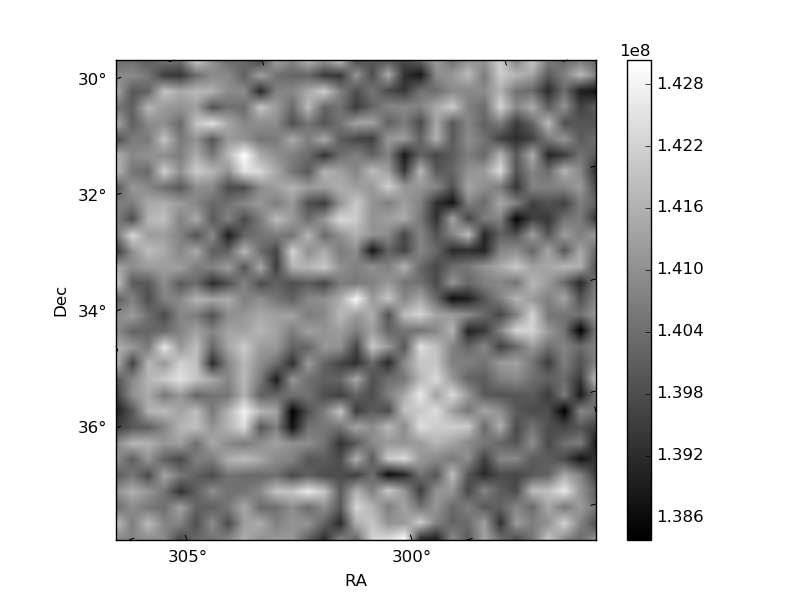
Quadrant B |
|---|---|---|---|
| Quadrant D | 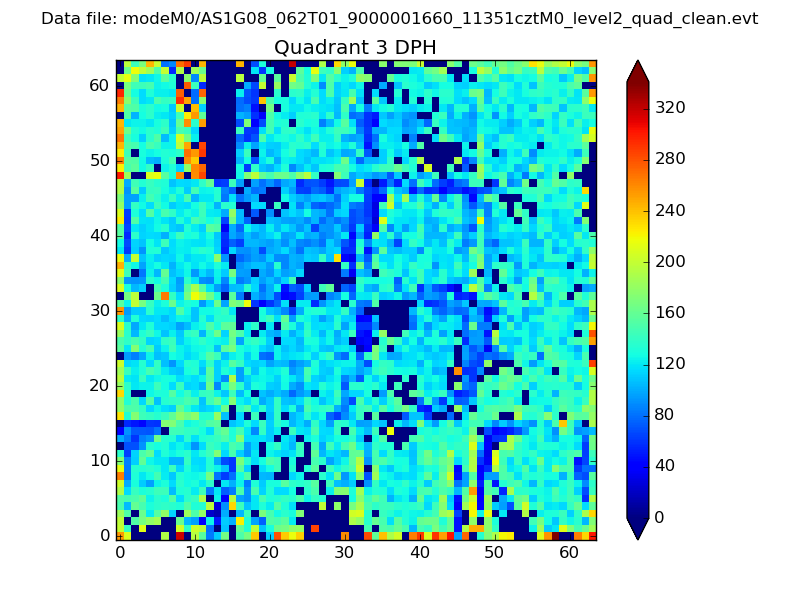 |
 |
Quadrant C |
| Plot type | Count rate plots | Images |
|---|---|---|
| Comparison with Poisson distribution Blue bars denote a histogram of data divided into 1 sec bins. Red curve is a Poisson curve with rate = median count rate of data. |
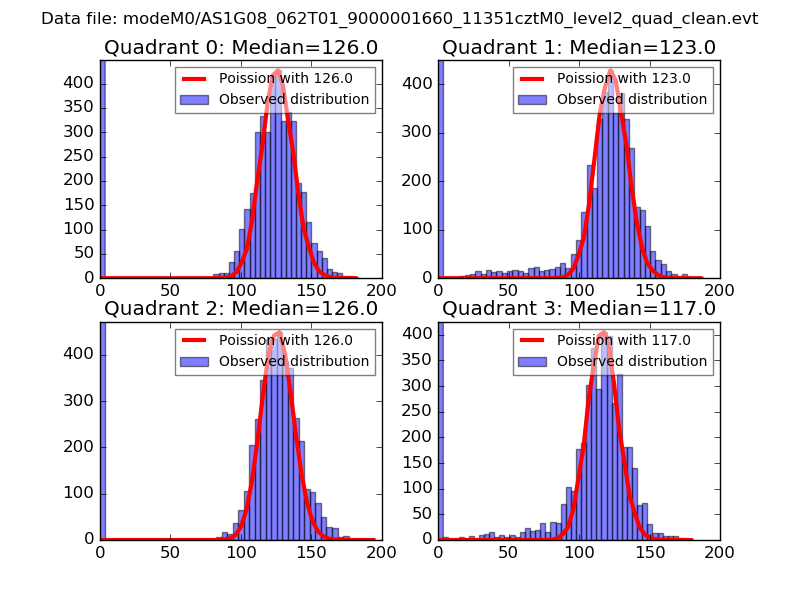 |
 |
| Quadrant-wise count rates Data is divided into 100 sec bins |
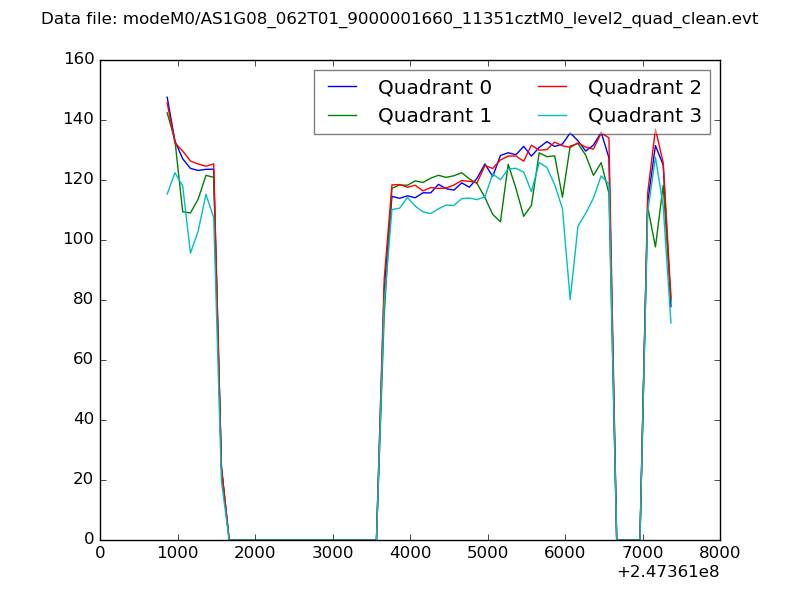 |
|
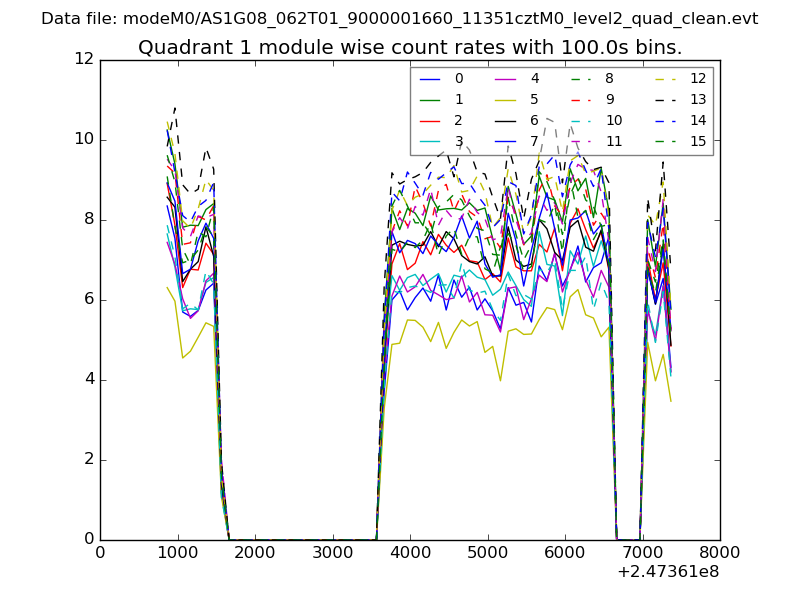
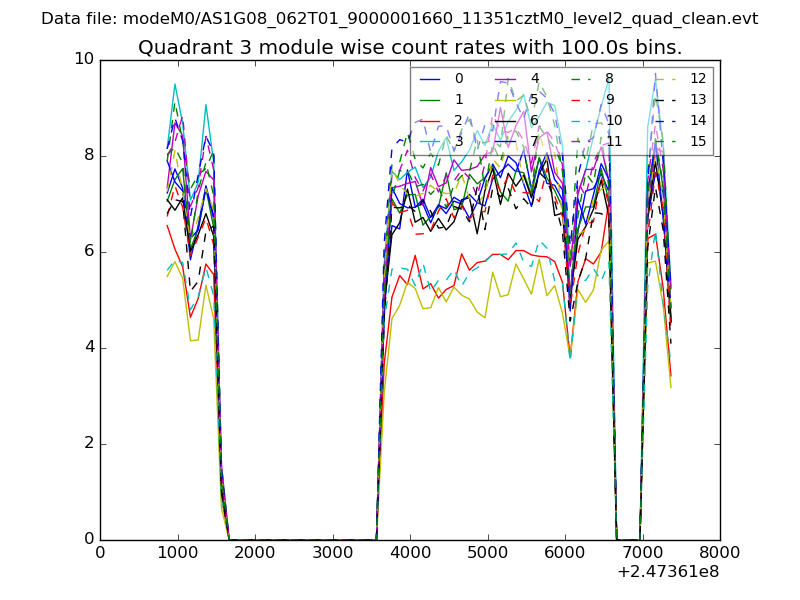
| Module-wise count rates for Quadrant A Data is divided into 100 sec bins |
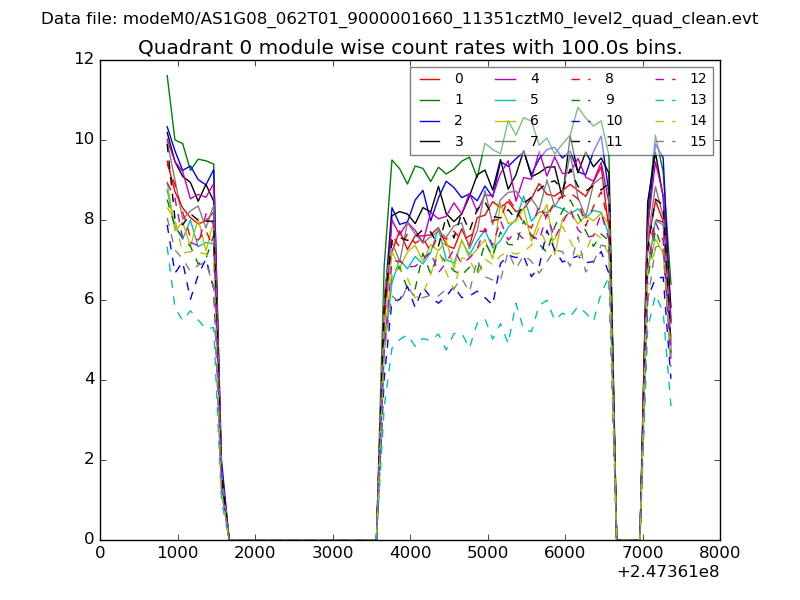 |
 |
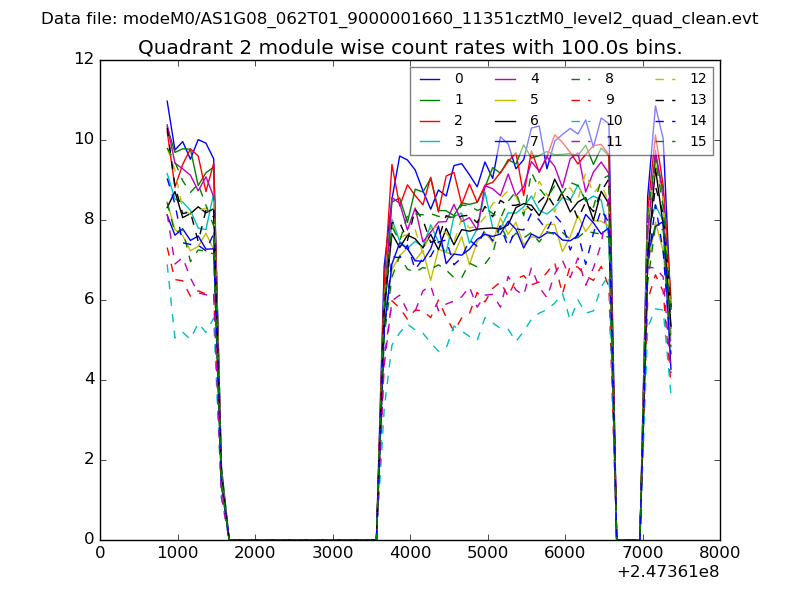
| Module-wise count rates for Quadrant B Data is divided into 100 sec bins |
 |
 |
| Module-wise count rates for Quadrant C Data is divided into 100 sec bins |
 |
 |
| Module-wise count rates for Quadrant D Data is divided into 100 sec bins |
 |
 |
| Parameter | Plot |
|---|---|
| CZT HV Monitor | 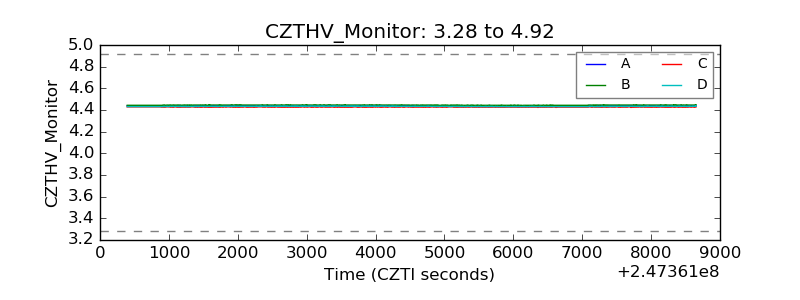 |
| D_VDD | 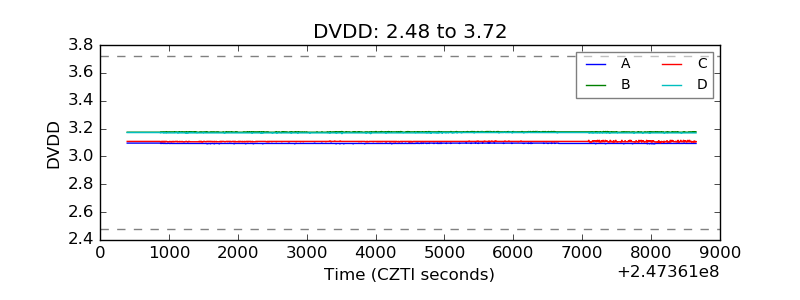 |
| Temperature 1 | 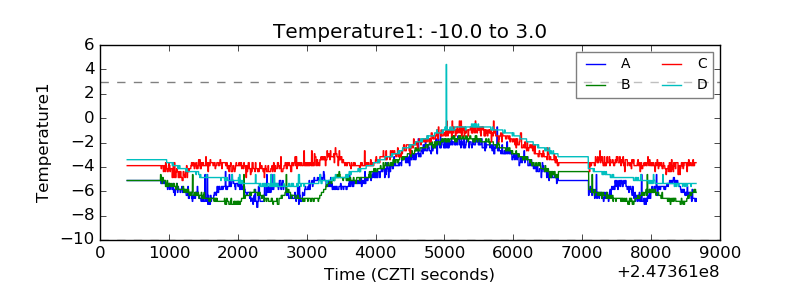 |
| Veto HV Monitor | 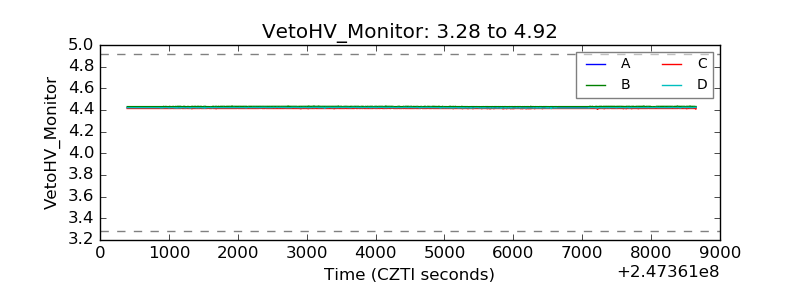 |
| Veto LLD | 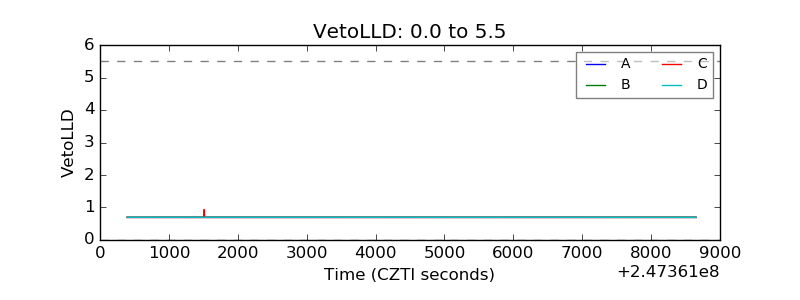 |
| Alpha Counter | 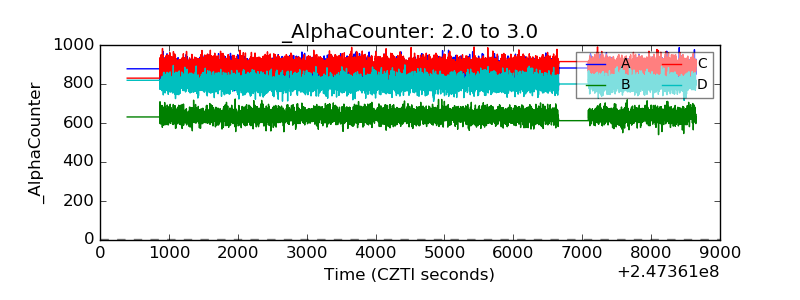 |
| _CPM_Rate | 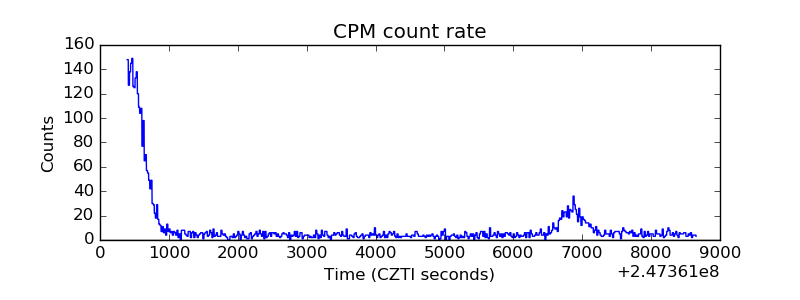 |
| CZT Counter | 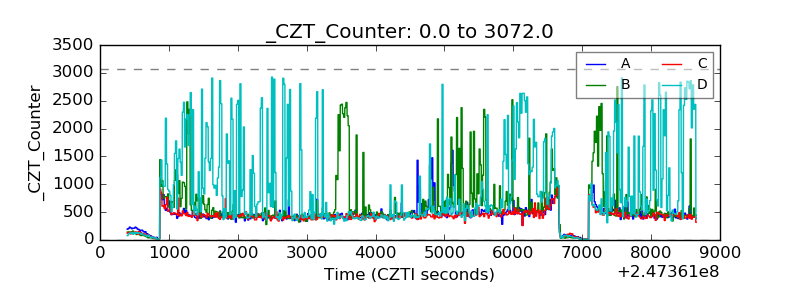 |
| +2.5 Volts monitor |  |
| +5 Volts monitor |  |
| _ROLL_ROT | 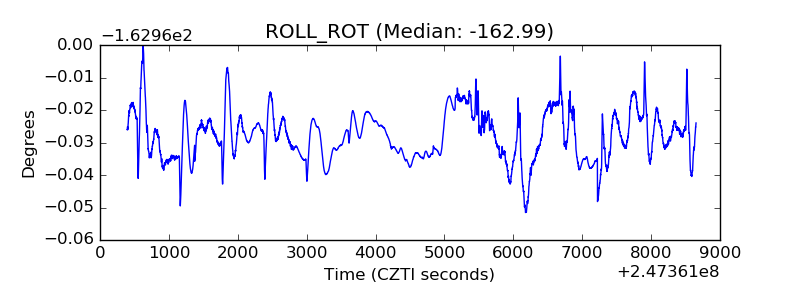 |
| _Roll_DEC | 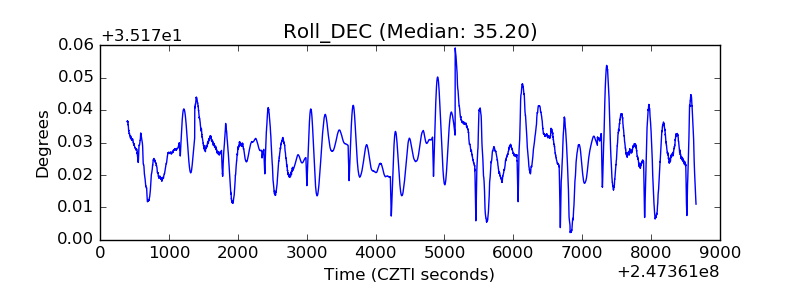 |
| _Roll_RA | 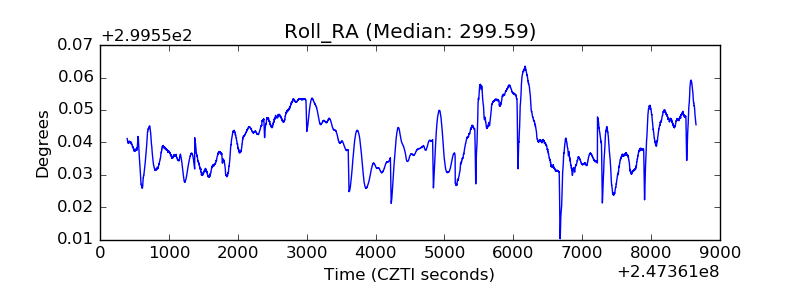 |
| Veto Counter | 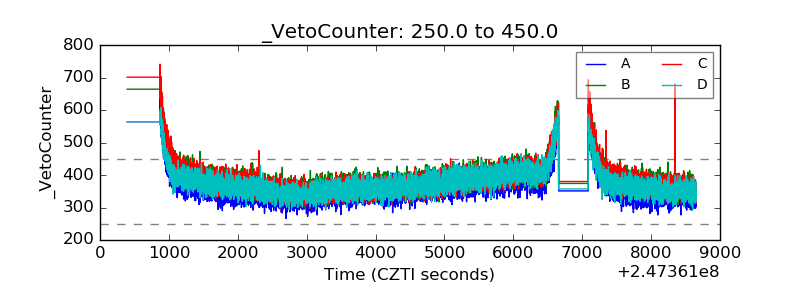 |