| Param | Original file | Final file |
|---|---|---|
| Filename | modeM0/AS1G08_062T01_9000001660_11352cztM0_level2.evt | modeM0/AS1G08_062T01_9000001660_11352cztM0_level2_quad_clean.evt |
| Size (bytes) | 588,205,440 | 76,694,400 |
| Size | 561.0 MB | 73.1 MB |
| Events in quadrant A | 3,728,789 | 460,181 |
| Events in quadrant B | 4,556,915 | 448,592 |
| Events in quadrant C | 3,425,675 | 463,916 |
| Events in quadrant D | 5,598,716 | 432,452 |
| Mode M0 | |||
|---|---|---|---|
| Quadrant | BADHDUFLAG | Total packets | Discarded packets |
| A | 0 | 15978 | 2 |
| B | 0 | 18532 | 1 |
| C | 0 | 15376 | 1 |
| D | 0 | 21566 | 1 |
| Mode SS | |||
|---|---|---|---|
| Quadrant | BADHDUFLAG | Total packets | Discarded packets |
| A | 0 | 150 | 0 |
| B | 0 | 150 | 0 |
| C | 0 | 150 | 0 |
| D | 0 | 150 | 0 |
| Mode M9 | |||
|---|---|---|---|
| Quadrant | BADHDUFLAG | Total packets | Discarded packets |
| A | 0 | 1 | 0 |
| B | 0 | 1 | 0 |
| C | 0 | 1 | 0 |
| D | 0 | 1 | 0 |
| Quadrant | Total seconds | Saturated seconds | Saturation percentage |
|---|---|---|---|
| A | 7427 | 179 | 2.410125% |
| B | 7427 | 482 | 6.489834% |
| C | 7427 | 85 | 1.144473% |
| D | 7427 | 665 | 8.953817% |
Noise dominated data is calculated using 1-second bins in cleaned event files. If a bin has >2000 counts, and if more than 50% of those come from <1% of pixels, then it is considered to be noise-dominated and hence unusable.
| Quadrant | # 1 sec bins | Bins with >0 counts | Bins with >2000 counts | High rate bins dominated by noise | Noise dominated (total time) | Noise dominated (detector-on time) | Marked lightcurve |
|---|---|---|---|---|---|---|---|
| A | 7442 | 7428 | 1 | 1 | 0.01% | 0.01% | 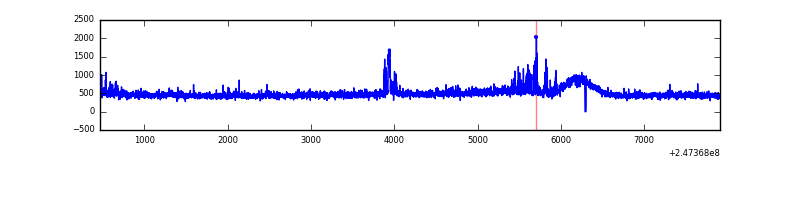 |
| B | 7442 | 7428 | 165 | 165 | 2.22% | 2.22% | 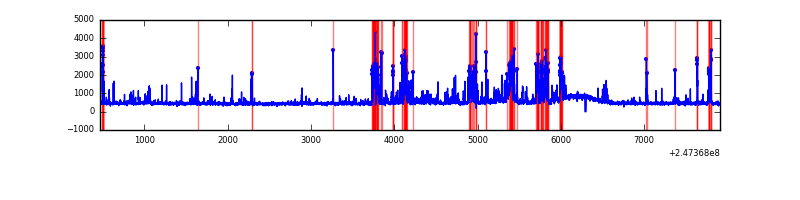 |
| C | 7442 | 7428 | 1 | 1 | 0.01% | 0.01% | 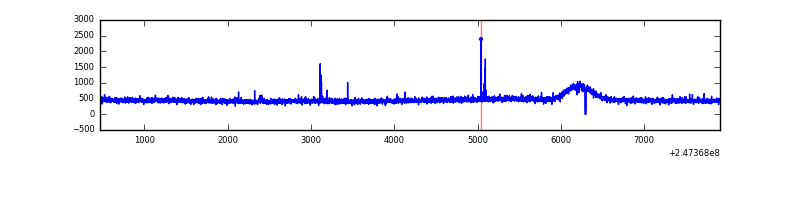 |
| D | 7442 | 7427 | 451 | 451 | 6.06% | 6.07% | 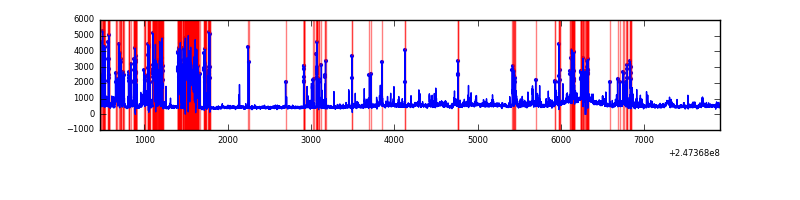 |
Top three noisy pixels from each quadrant. If the there are fewer than three noisy pixels in the level2.evt file, extra rows are filled as -1
| Pixel properties | Quadrant properties | ||||||
|---|---|---|---|---|---|---|---|
| Quadrant | DetID | PixID | Counts | Sigma | Mean | Median | Sigma |
| A | 13 | 251 | 203534 | 1118.1 | 875 | 855 | 181.3 |
| A | 15 | 174 | 61956 | 337.07 | 875 | 855 | 181.3 |
| A | 1 | 162 | 31847 | 170.97 | 875 | 855 | 181.3 |
| B | 4 | 239 | 893301 | 5324.86 | 867 | 844 | 167.6 |
| B | 3 | 64 | 175468 | 1041.9 | 867 | 844 | 167.6 |
| B | 3 | 189 | 40943 | 239.25 | 867 | 844 | 167.6 |
| C | 14 | 234 | 18064 | 85.62 | 866 | 869 | 200.8 |
| C | 8 | 128 | 11456 | 52.71 | 866 | 869 | 200.8 |
| C | 4 | 175 | 7498 | 33.01 | 866 | 869 | 200.8 |
| D | 10 | 253 | 1505982 | 7591.62 | 812 | 788 | 198.3 |
| D | 13 | 152 | 430691 | 2168.27 | 812 | 788 | 198.3 |
| D | 8 | 195 | 292621 | 1471.89 | 812 | 788 | 198.3 |
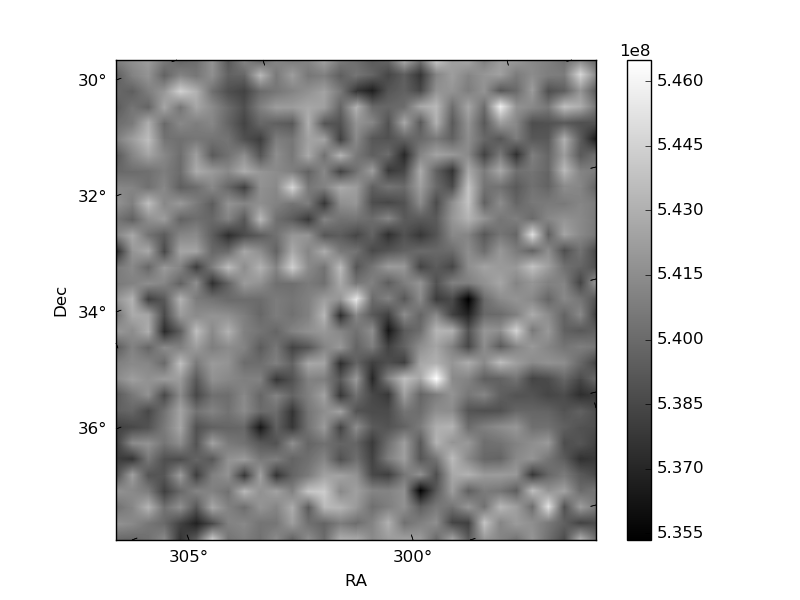
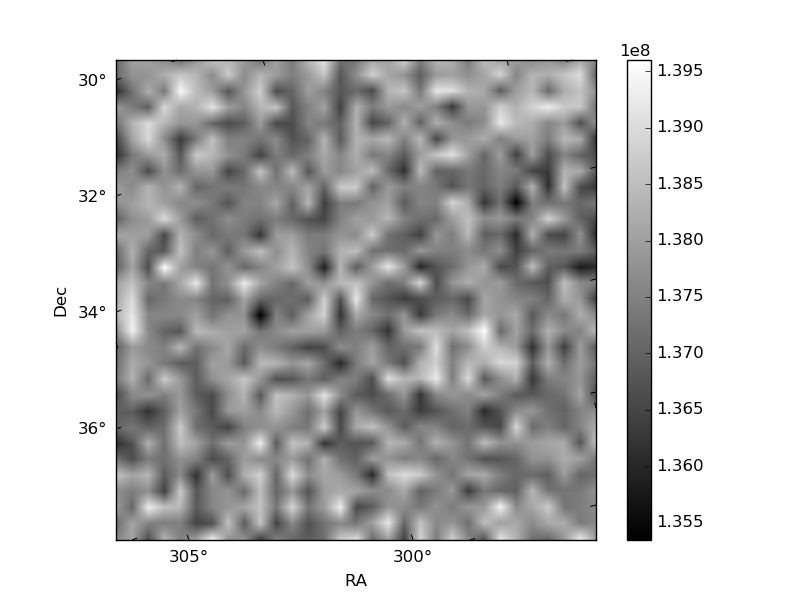
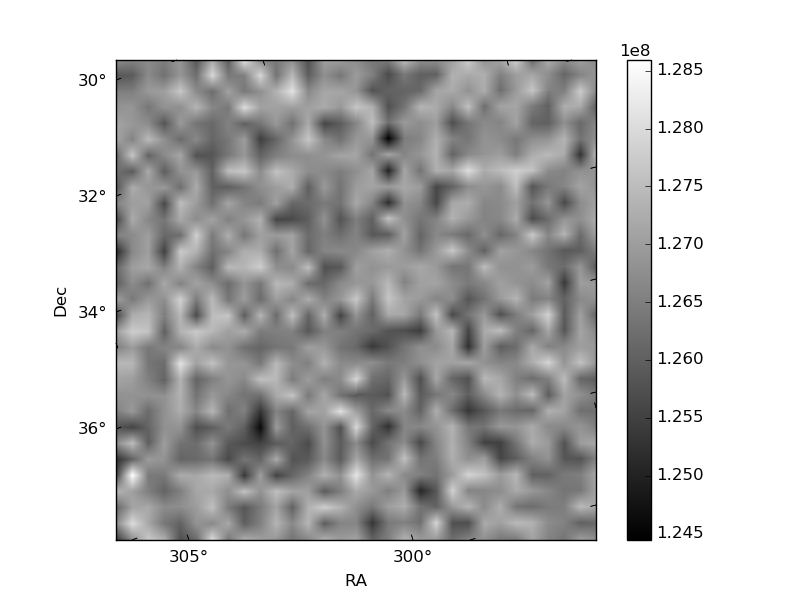
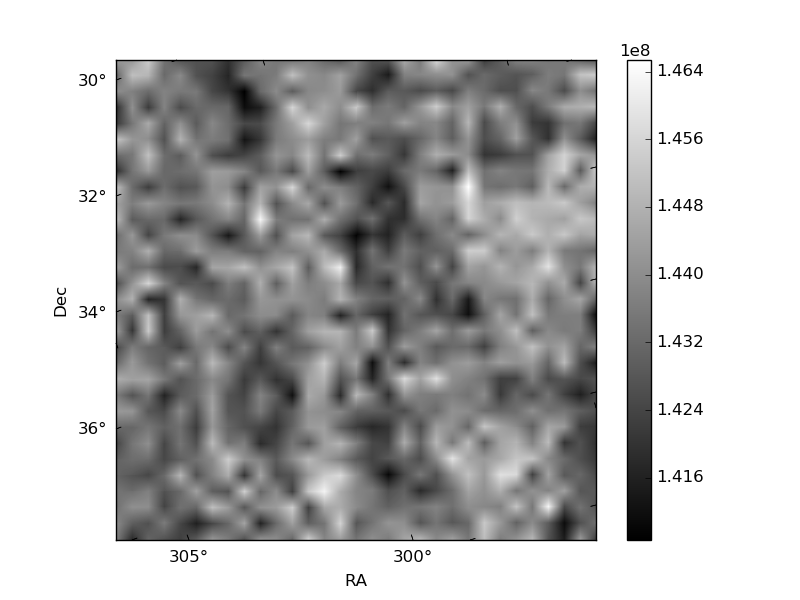
Histogram calculated using DETX and DETY for each event in the final _common_clean file
| Quadrant A | 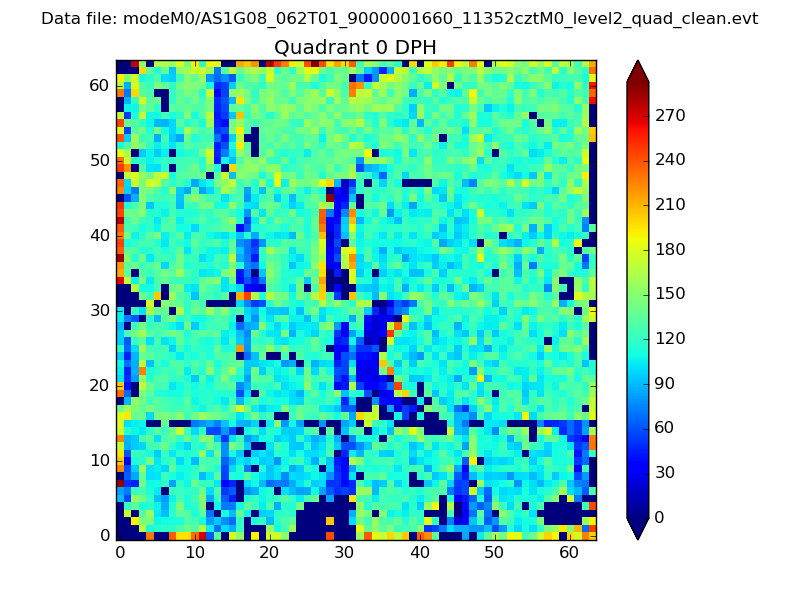 |
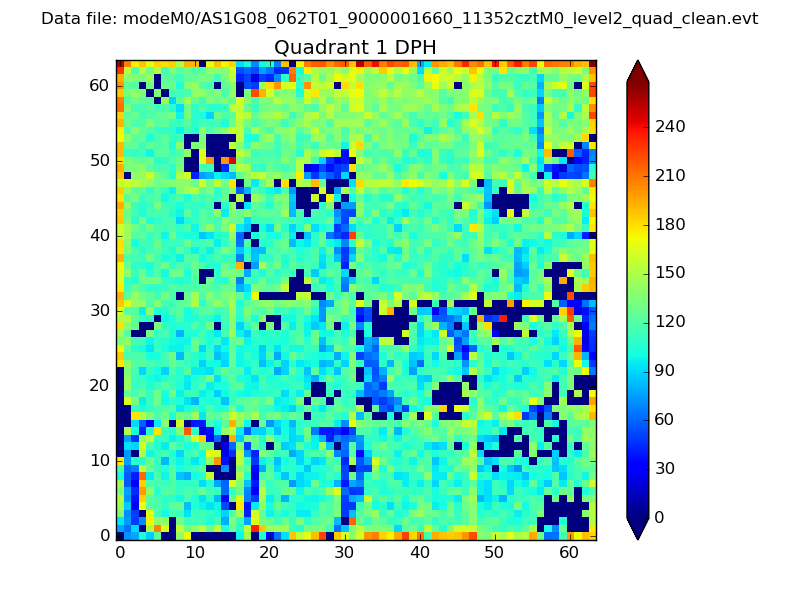 |
Quadrant B |
|---|---|---|---|
| Quadrant D | 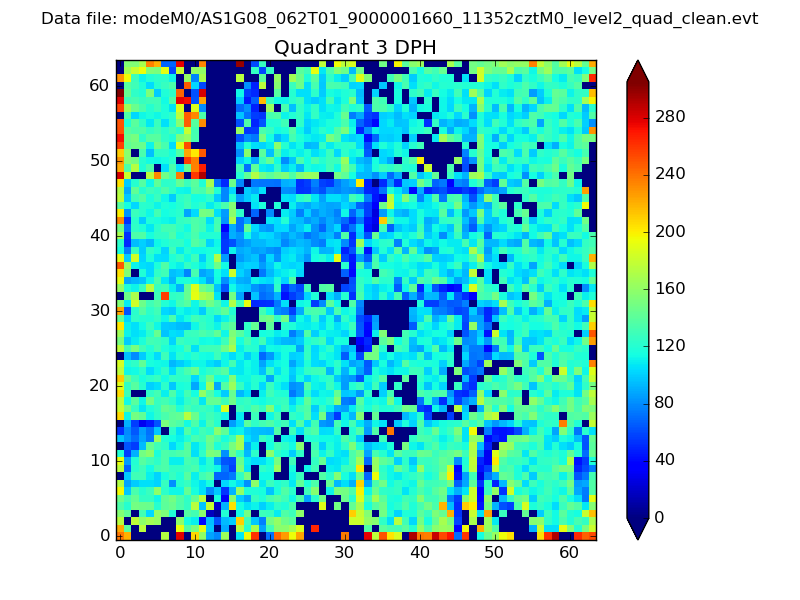 |
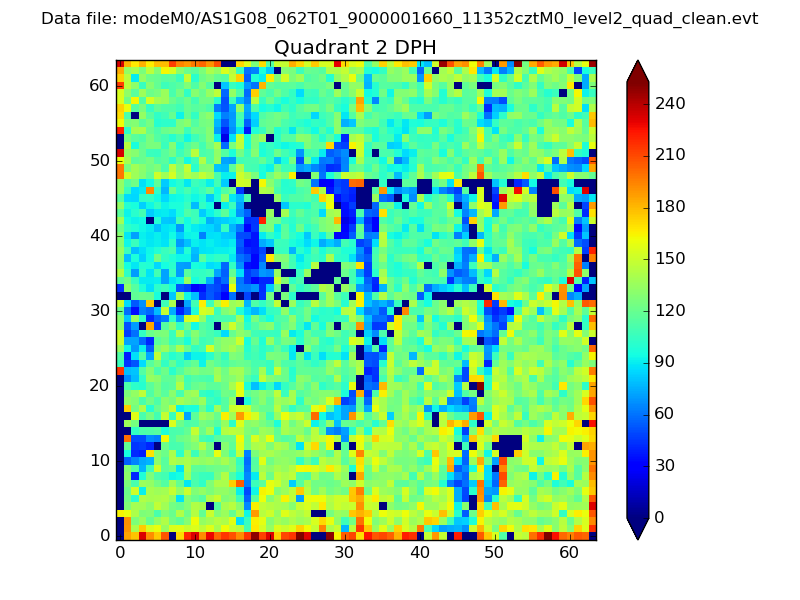 |
Quadrant C |
| Plot type | Count rate plots | Images |
|---|---|---|
| Comparison with Poisson distribution Blue bars denote a histogram of data divided into 1 sec bins. Red curve is a Poisson curve with rate = median count rate of data. |
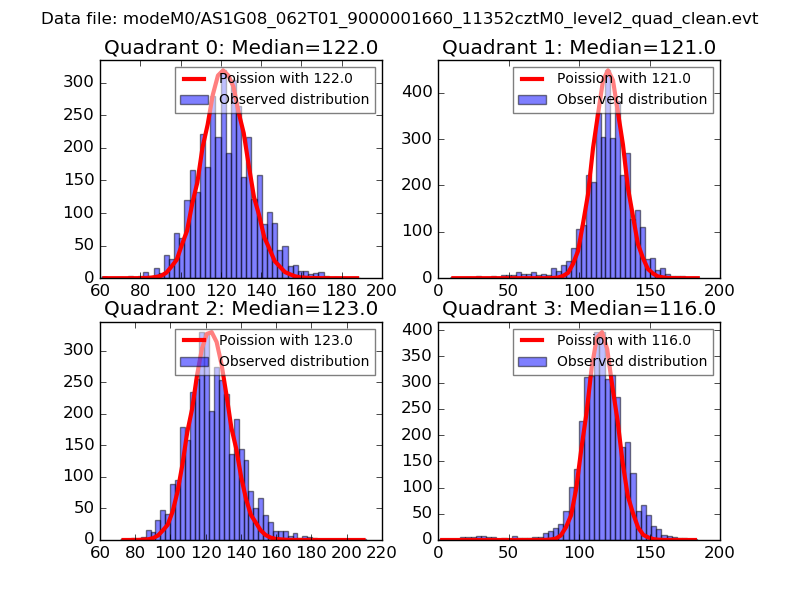 |
 |
| Quadrant-wise count rates Data is divided into 100 sec bins |
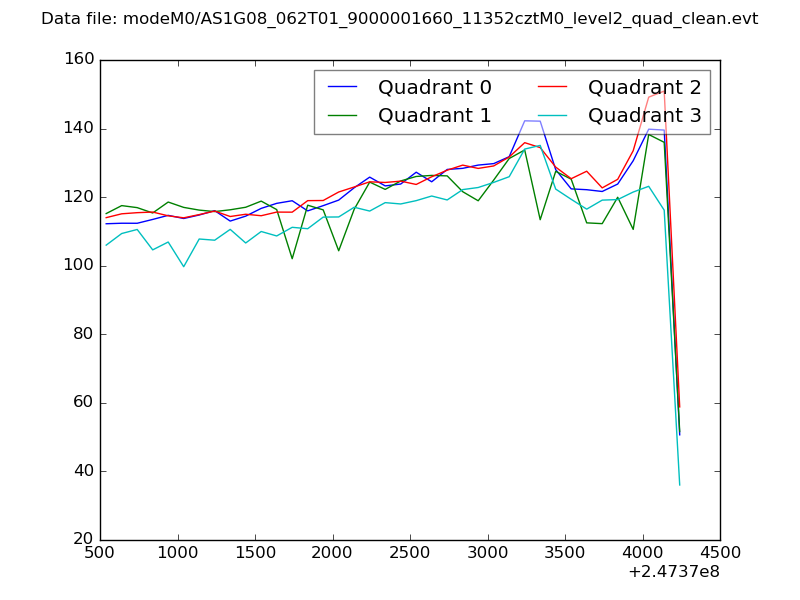 |
|
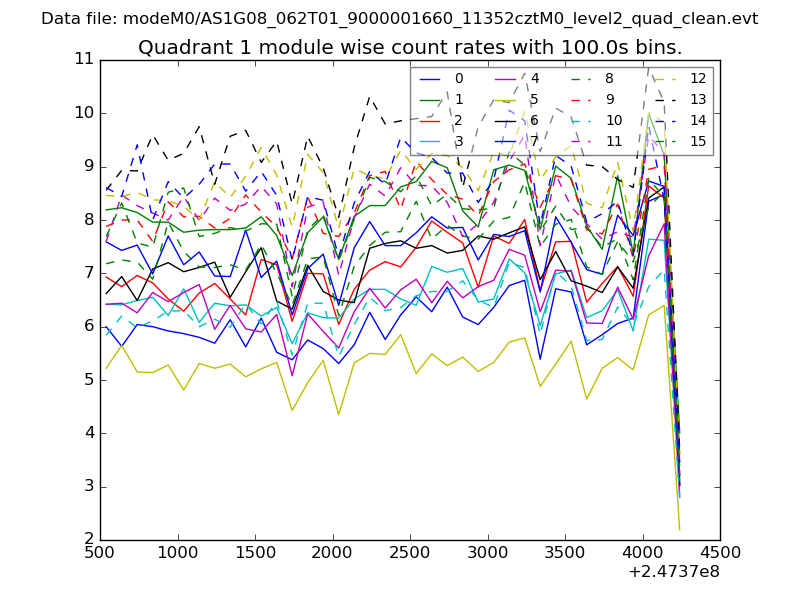
| Module-wise count rates for Quadrant A Data is divided into 100 sec bins |
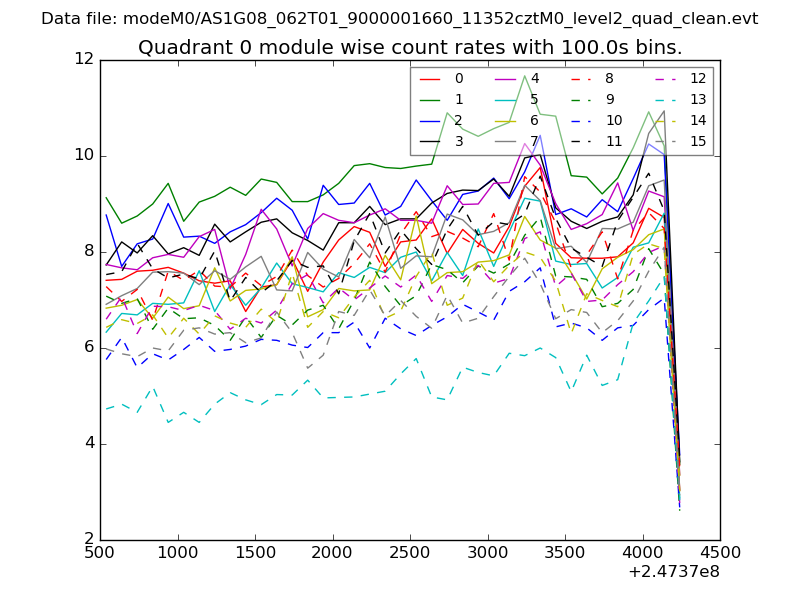 |
 |
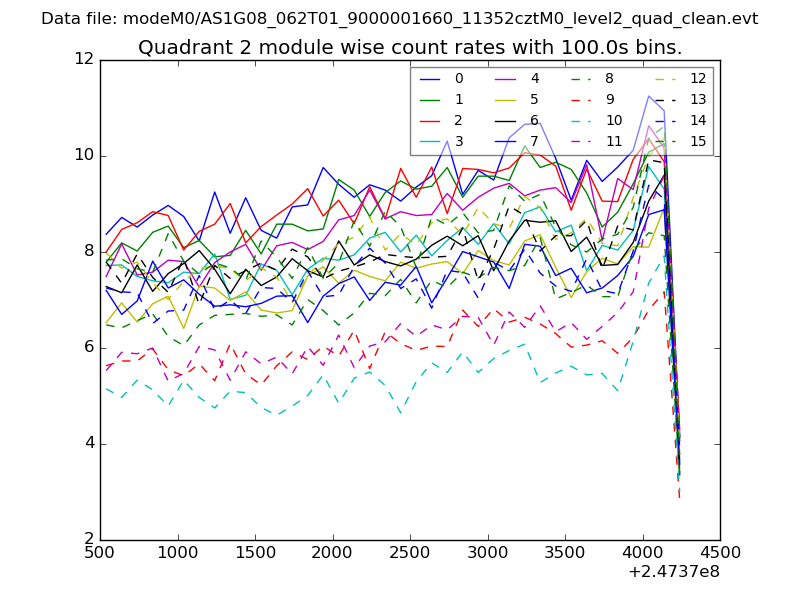
| Module-wise count rates for Quadrant B Data is divided into 100 sec bins |
 |
 |
| Module-wise count rates for Quadrant C Data is divided into 100 sec bins |
 |
 |
| Module-wise count rates for Quadrant D Data is divided into 100 sec bins |
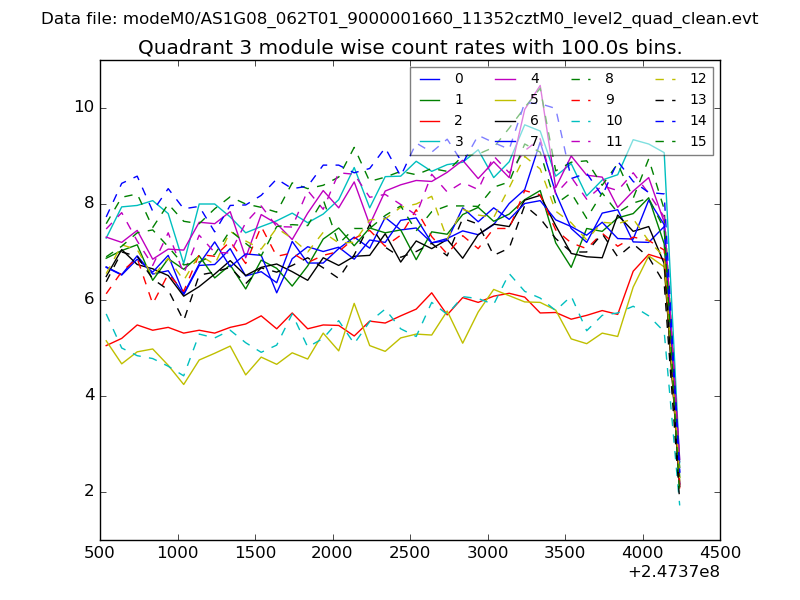 |
 |
| Parameter | Plot |
|---|---|
| CZT HV Monitor | 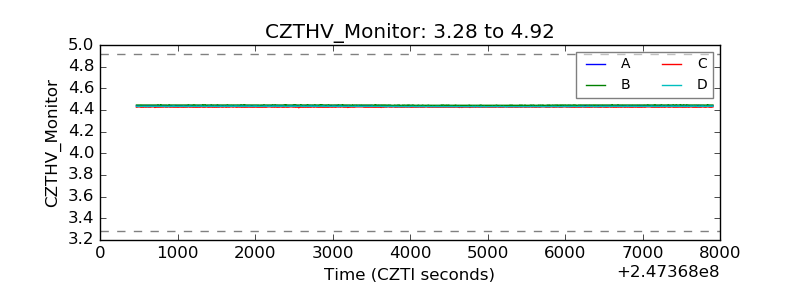 |
| D_VDD |  |
| Temperature 1 |  |
| Veto HV Monitor | 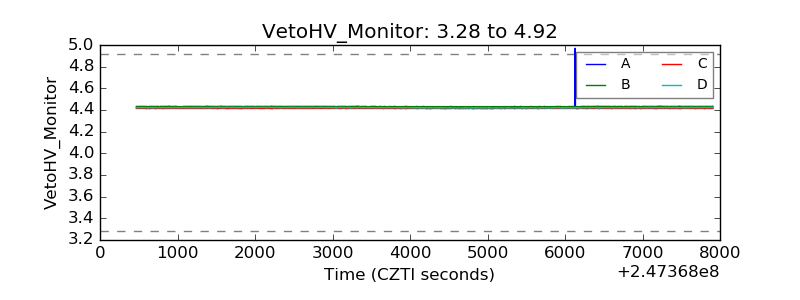 |
| Veto LLD | 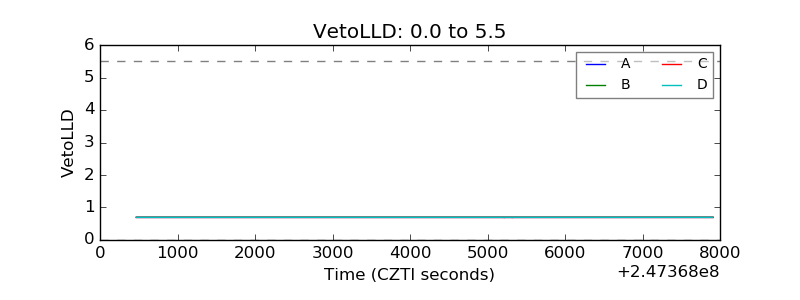 |
| Alpha Counter | 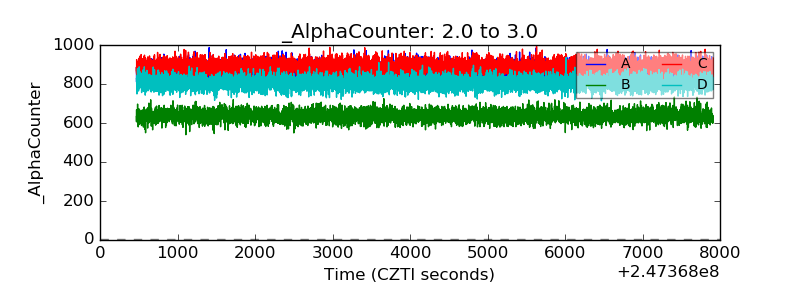 |
| _CPM_Rate | 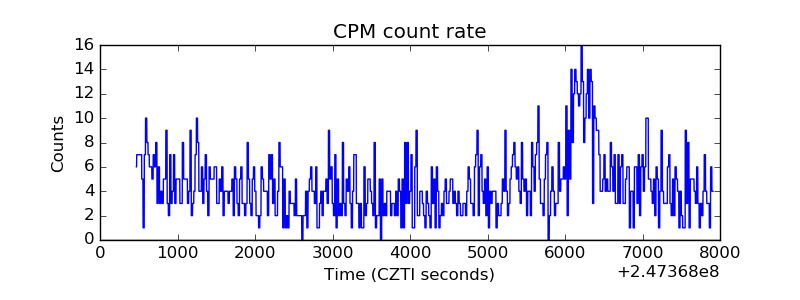 |
| CZT Counter | 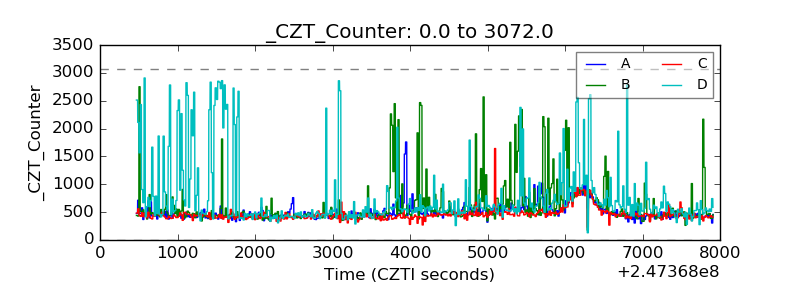 |
| +2.5 Volts monitor |  |
| +5 Volts monitor |  |
| _ROLL_ROT | 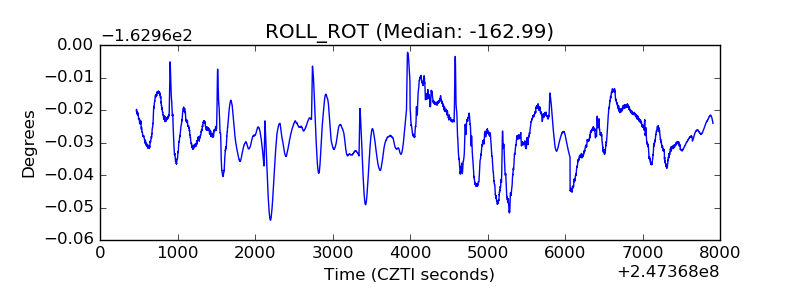 |
| _Roll_DEC | 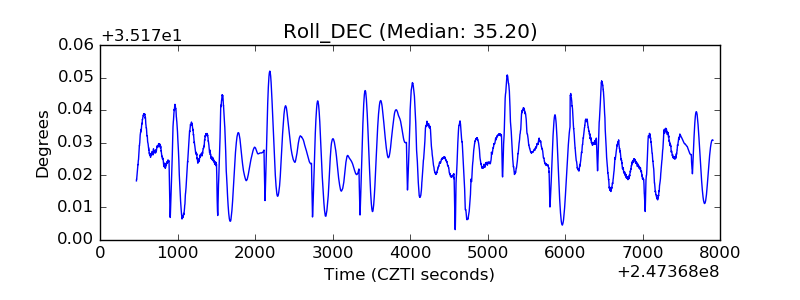 |
| _Roll_RA | 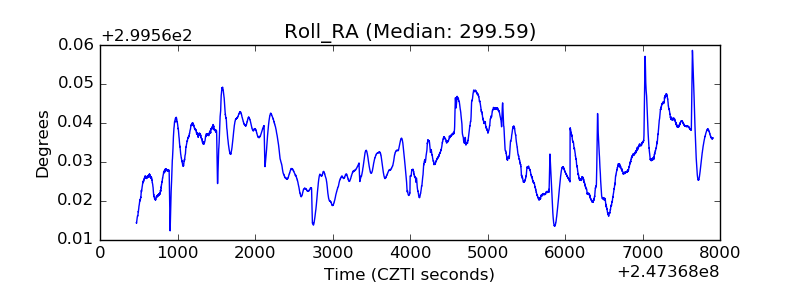 |
| Veto Counter | 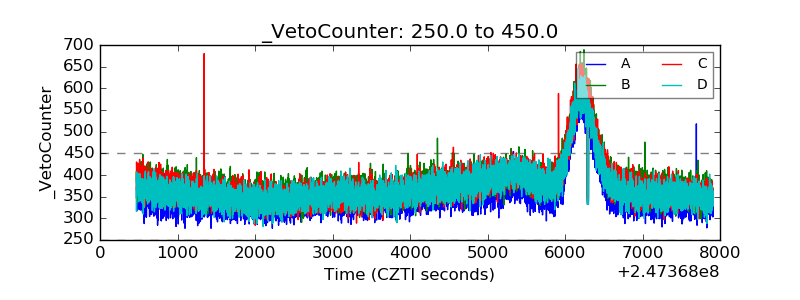 |