| Param | Original file | Final file |
|---|---|---|
| Filename | modeM0/AS1G08_062T01_9000001660_11353cztM0_level2.evt | modeM0/AS1G08_062T01_9000001660_11353cztM0_level2_quad_clean.evt |
| Size (bytes) | 662,529,600 | 84,631,680 |
| Size | 631.8 MB | 80.7 MB |
| Events in quadrant A | 4,083,599 | 510,491 |
| Events in quadrant B | 5,587,091 | 488,439 |
| Events in quadrant C | 3,785,634 | 515,727 |
| Events in quadrant D | 6,055,566 | 480,785 |
| Mode M0 | |||
|---|---|---|---|
| Quadrant | BADHDUFLAG | Total packets | Discarded packets |
| A | 0 | 17588 | 3 |
| B | 0 | 22162 | 2 |
| C | 0 | 17020 | 2 |
| D | 0 | 23562 | 2 |
| Mode SS | |||
|---|---|---|---|
| Quadrant | BADHDUFLAG | Total packets | Discarded packets |
| A | 0 | 164 | 0 |
| B | 0 | 164 | 0 |
| C | 0 | 164 | 0 |
| D | 0 | 164 | 0 |
| Mode M9 | |||
|---|---|---|---|
| Quadrant | BADHDUFLAG | Total packets | Discarded packets |
| A | 0 | 4 | 0 |
| B | 0 | 4 | 0 |
| C | 0 | 4 | 0 |
| D | 0 | 4 | 0 |
| Quadrant | Total seconds | Saturated seconds | Saturation percentage |
|---|---|---|---|
| A | 8169 | 271 | 3.317420% |
| B | 8169 | 777 | 9.511568% |
| C | 8169 | 134 | 1.640348% |
| D | 8169 | 570 | 6.977598% |
Noise dominated data is calculated using 1-second bins in cleaned event files. If a bin has >2000 counts, and if more than 50% of those come from <1% of pixels, then it is considered to be noise-dominated and hence unusable.
| Quadrant | # 1 sec bins | Bins with >0 counts | Bins with >2000 counts | High rate bins dominated by noise | Noise dominated (total time) | Noise dominated (detector-on time) | Marked lightcurve |
|---|---|---|---|---|---|---|---|
| A | 8444 | 8171 | 1 | 1 | 0.01% | 0.01% |  |
| B | 8444 | 8171 | 303 | 303 | 3.59% | 3.71% |  |
| C | 8444 | 8171 | 0 | 0 | 0.00% | 0.00% |  |
| D | 8444 | 8171 | 282 | 282 | 3.34% | 3.45% |  |
Top three noisy pixels from each quadrant. If the there are fewer than three noisy pixels in the level2.evt file, extra rows are filled as -1
| Pixel properties | Quadrant properties | ||||||
|---|---|---|---|---|---|---|---|
| Quadrant | DetID | PixID | Counts | Sigma | Mean | Median | Sigma |
| A | 15 | 174 | 138968 | 684.69 | 983 | 961 | 201.6 |
| A | 13 | 251 | 54531 | 265.78 | 983 | 961 | 201.6 |
| A | 1 | 162 | 33828 | 163.06 | 983 | 961 | 201.6 |
| B | 4 | 239 | 1284922 | 6819.6 | 966 | 937 | 188.3 |
| B | 3 | 64 | 418611 | 2218.38 | 966 | 937 | 188.3 |
| B | 4 | 81 | 58134 | 303.79 | 966 | 937 | 188.3 |
| C | 13 | 61 | 7053 | 26.74 | 969 | 972 | 227.5 |
| C | 14 | 234 | 4266 | 14.48 | 969 | 972 | 227.5 |
| C | 8 | 222 | 2771 | 7.91 | 969 | 972 | 227.5 |
| D | 13 | 152 | 948437 | 4227.8 | 927 | 898 | 224.1 |
| D | 10 | 253 | 772081 | 3440.93 | 927 | 898 | 224.1 |
| D | 8 | 195 | 383626 | 1707.69 | 927 | 898 | 224.1 |
Histogram calculated using DETX and DETY for each event in the final _common_clean file
| Quadrant A |  |
 |
Quadrant B |
|---|---|---|---|
| Quadrant D |  |
 |
Quadrant C |
| Plot type | Count rate plots | Images |
|---|---|---|
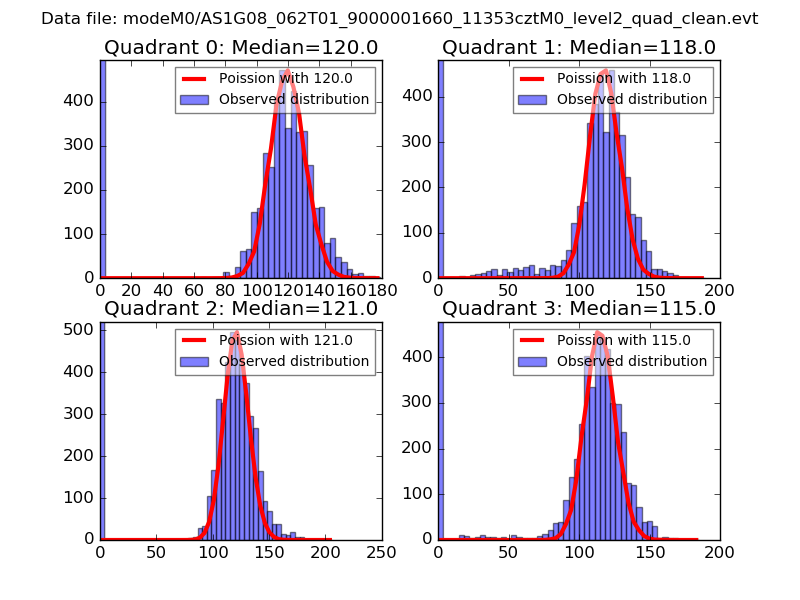
| Comparison with Poisson distribution Blue bars denote a histogram of data divided into 1 sec bins. Red curve is a Poisson curve with rate = median count rate of data. |
 |
 |
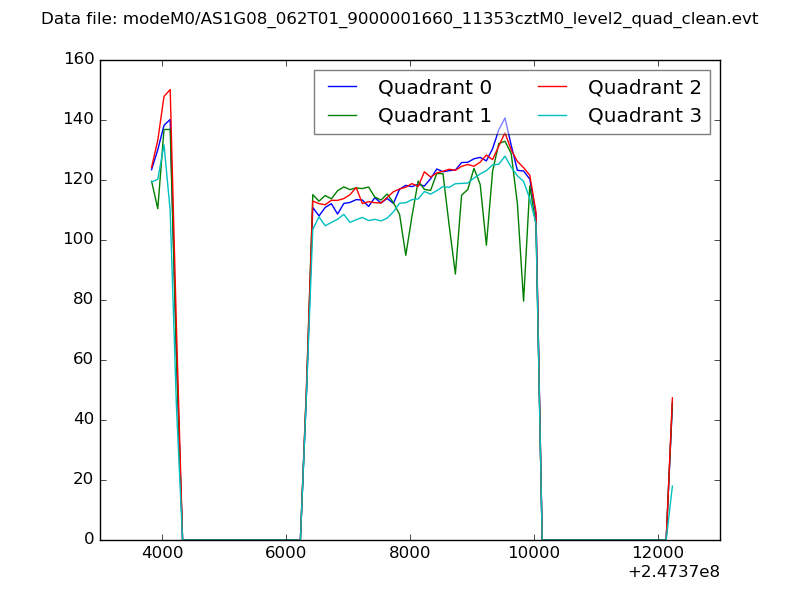
| Quadrant-wise count rates Data is divided into 100 sec bins |
 |
|
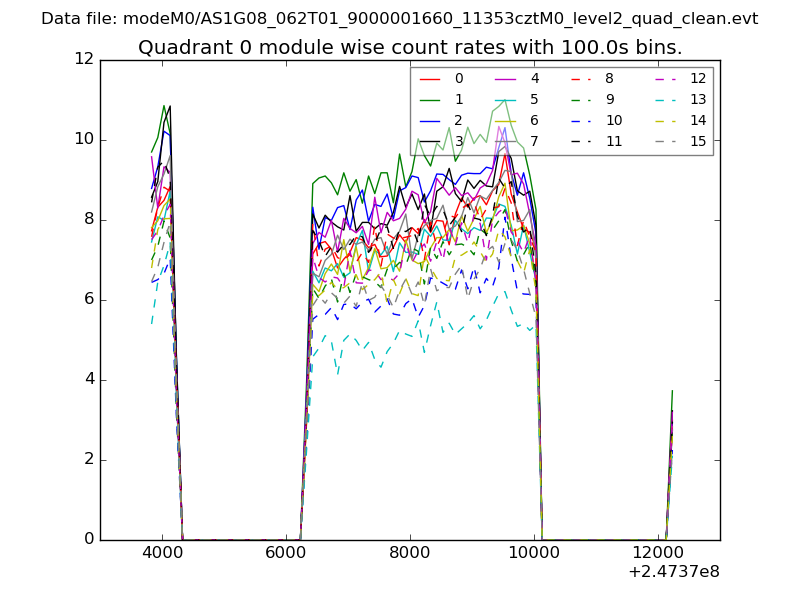
| Module-wise count rates for Quadrant A Data is divided into 100 sec bins |
 |
 |
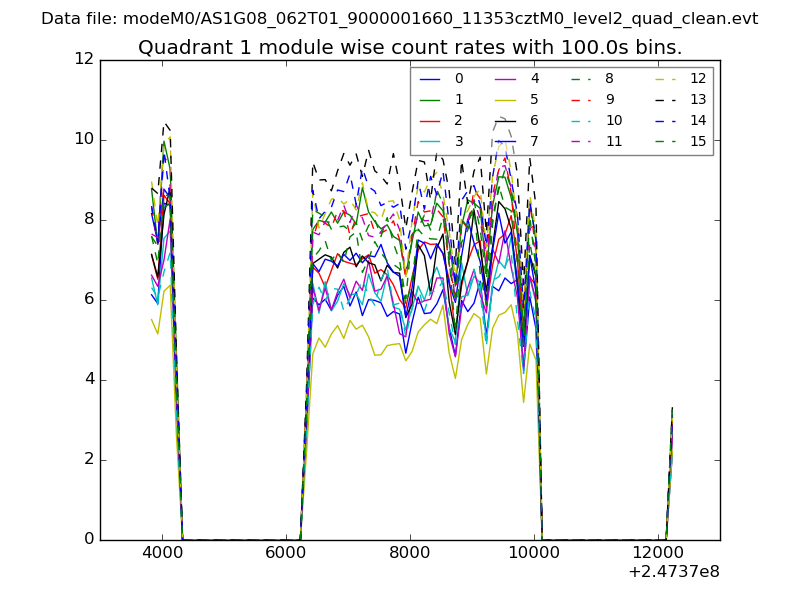
| Module-wise count rates for Quadrant B Data is divided into 100 sec bins |
 |
 |
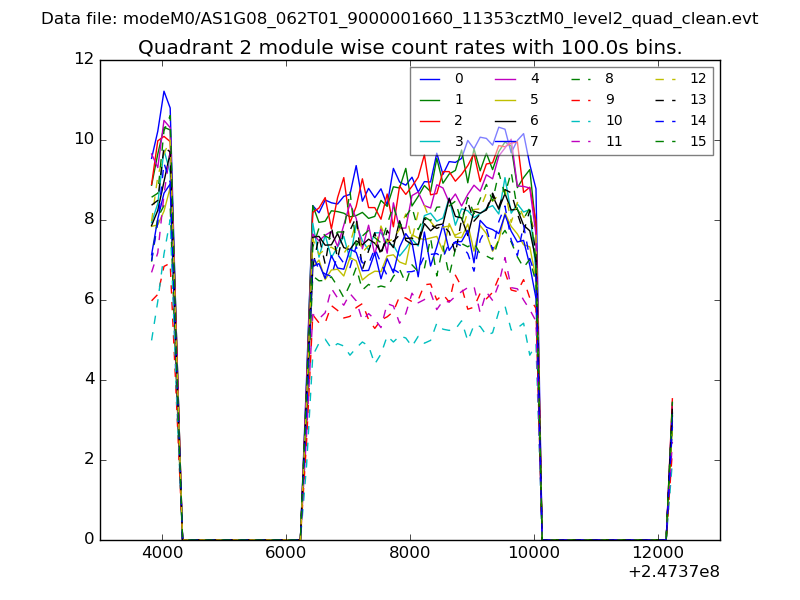
| Module-wise count rates for Quadrant C Data is divided into 100 sec bins |
 |
 |
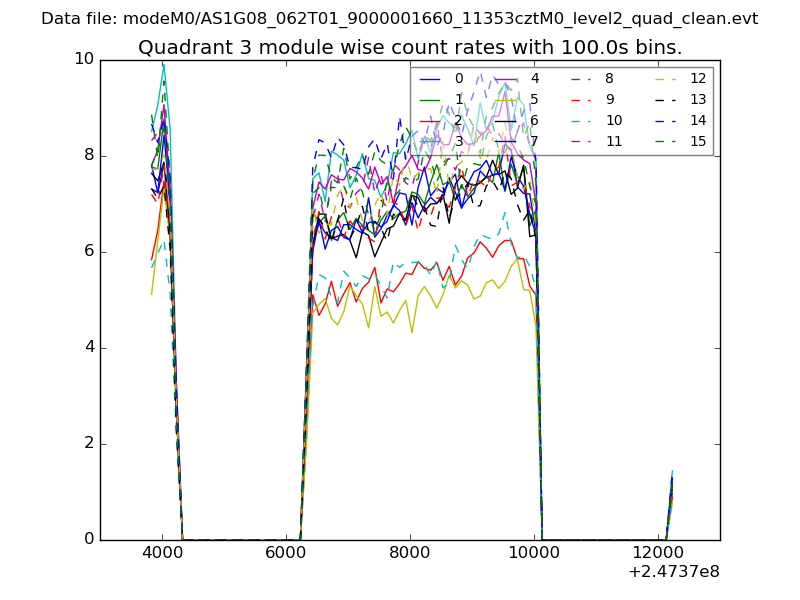
| Module-wise count rates for Quadrant D Data is divided into 100 sec bins |
 |
 |
| Parameter | Plot |
|---|---|
| CZT HV Monitor | 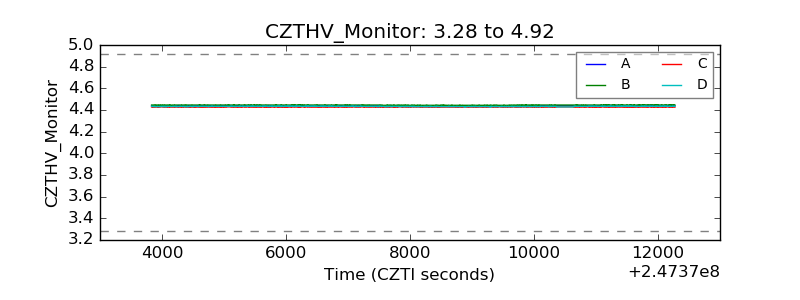 |
| D_VDD |  |
| Temperature 1 |  |
| Veto HV Monitor |  |
| Veto LLD |  |
| Alpha Counter | 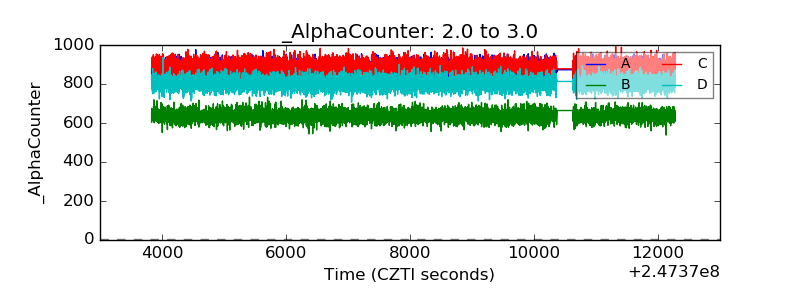 |
| _CPM_Rate | 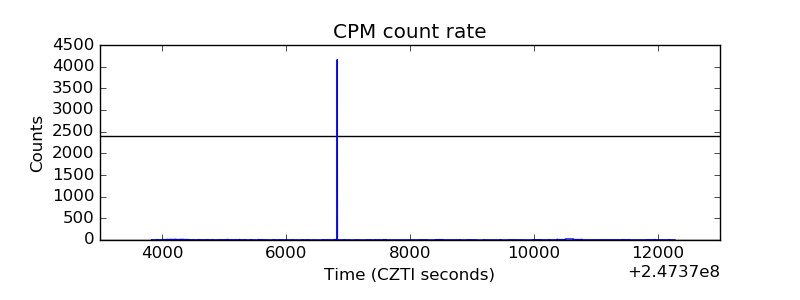 |
| CZT Counter |  |
| +2.5 Volts monitor |  |
| +5 Volts monitor |  |
| _ROLL_ROT | 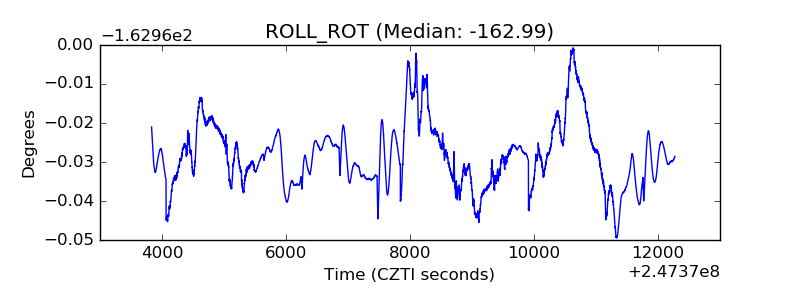 |
| _Roll_DEC | 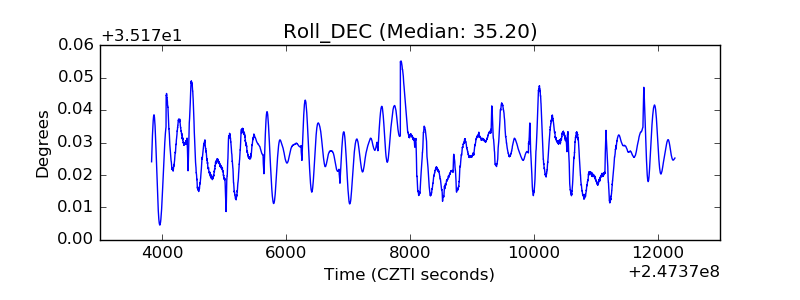 |
| _Roll_RA |  |
| Veto Counter | 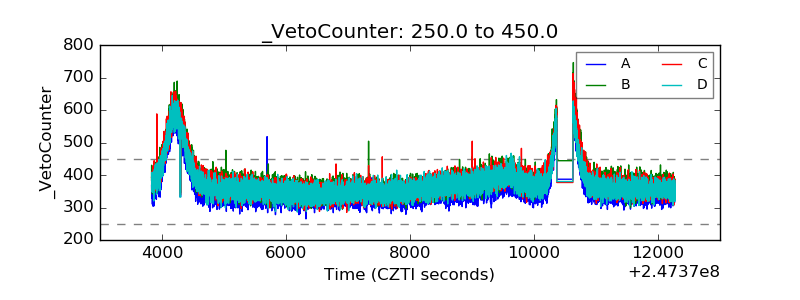 |