| Param | Original file | Final file |
|---|---|---|
| Filename | modeM0/AS1G08_062T01_9000001660_11356cztM0_level2.evt | modeM0/AS1G08_062T01_9000001660_11356cztM0_level2_quad_clean.evt |
| Size (bytes) | 730,437,120 | 115,113,600 |
| Size | 696.6 MB | 109.8 MB |
| Events in quadrant A | 4,207,950 | 740,291 |
| Events in quadrant B | 6,109,028 | 714,693 |
| Events in quadrant C | 4,028,124 | 737,171 |
| Events in quadrant D | 7,170,886 | 673,495 |
| Mode M0 | |||
|---|---|---|---|
| Quadrant | BADHDUFLAG | Total packets | Discarded packets |
| A | 0 | 18329 | 3 |
| B | 0 | 23853 | 2 |
| C | 0 | 18172 | 2 |
| D | 0 | 27364 | 2 |
| Mode SS | |||
|---|---|---|---|
| Quadrant | BADHDUFLAG | Total packets | Discarded packets |
| A | 0 | 180 | 0 |
| B | 0 | 180 | 0 |
| C | 0 | 180 | 0 |
| D | 0 | 180 | 0 |
| Mode M9 | |||
|---|---|---|---|
| Quadrant | BADHDUFLAG | Total packets | Discarded packets |
| A | 0 | 16 | 0 |
| B | 0 | 16 | 0 |
| C | 0 | 16 | 0 |
| D | 0 | 16 | 0 |
| Quadrant | Total seconds | Saturated seconds | Saturation percentage |
|---|---|---|---|
| A | 8945 | 107 | 1.196199% |
| B | 8945 | 611 | 6.830632% |
| C | 8945 | 48 | 0.536613% |
| D | 8945 | 1105 | 12.353270% |
Noise dominated data is calculated using 1-second bins in cleaned event files. If a bin has >2000 counts, and if more than 50% of those come from <1% of pixels, then it is considered to be noise-dominated and hence unusable.
| Quadrant | # 1 sec bins | Bins with >0 counts | Bins with >2000 counts | High rate bins dominated by noise | Noise dominated (total time) | Noise dominated (detector-on time) | Marked lightcurve |
|---|---|---|---|---|---|---|---|
| A | 10405 | 8947 | 1 | 1 | 0.01% | 0.01% | 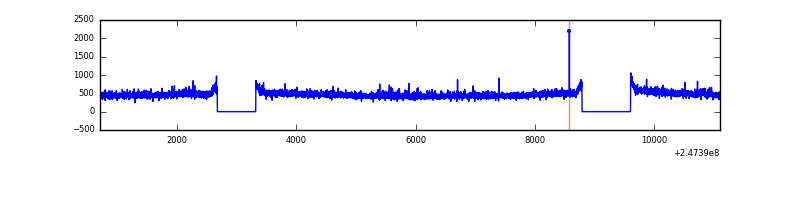 |
| B | 10405 | 8947 | 405 | 405 | 3.89% | 4.53% | 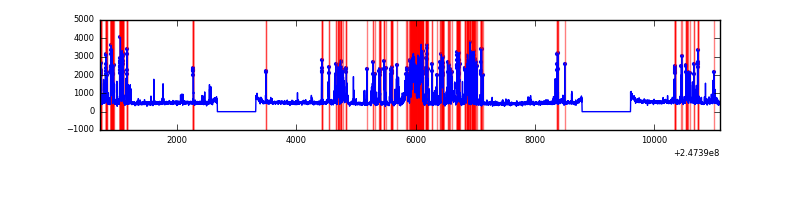 |
| C | 10405 | 8947 | 0 | 0 | 0.00% | 0.00% | 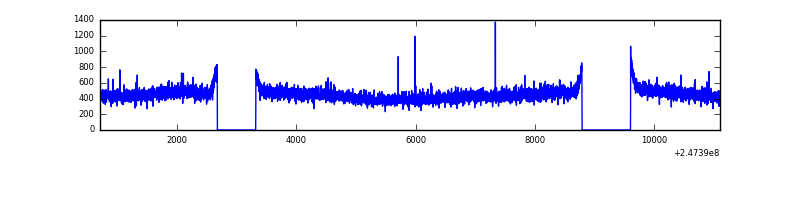 |
| D | 10405 | 8947 | 802 | 802 | 7.71% | 8.96% | 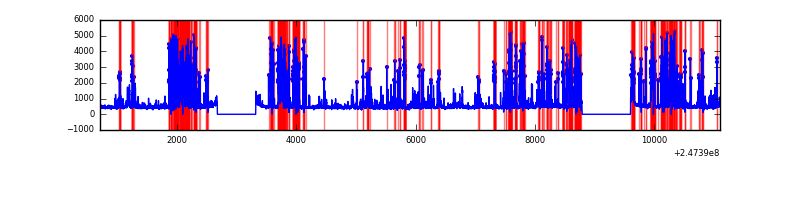 |
Top three noisy pixels from each quadrant. If the there are fewer than three noisy pixels in the level2.evt file, extra rows are filled as -1
| Pixel properties | Quadrant properties | ||||||
|---|---|---|---|---|---|---|---|
| Quadrant | DetID | PixID | Counts | Sigma | Mean | Median | Sigma |
| A | 1 | 162 | 41656 | 185.82 | 1057 | 1032 | 218.6 |
| A | 1 | 178 | 22715 | 99.18 | 1057 | 1032 | 218.6 |
| A | 13 | 251 | 22218 | 96.91 | 1057 | 1032 | 218.6 |
| B | 4 | 239 | 1915421 | 9650.14 | 1035 | 1009 | 198.4 |
| B | 3 | 189 | 37297 | 182.92 | 1035 | 1009 | 198.4 |
| B | 0 | 187 | 34896 | 170.82 | 1035 | 1009 | 198.4 |
| C | 13 | 61 | 7425 | 26.67 | 1032 | 1039 | 239.4 |
| C | 8 | 222 | 3849 | 11.74 | 1032 | 1039 | 239.4 |
| C | 3 | 202 | 2603 | 6.53 | 1032 | 1039 | 239.4 |
| D | 10 | 253 | 2612600 | 11417.92 | 953 | 927 | 228.7 |
| D | 2 | 120 | 279399 | 1217.44 | 953 | 927 | 228.7 |
| D | 13 | 152 | 242327 | 1055.37 | 953 | 927 | 228.7 |
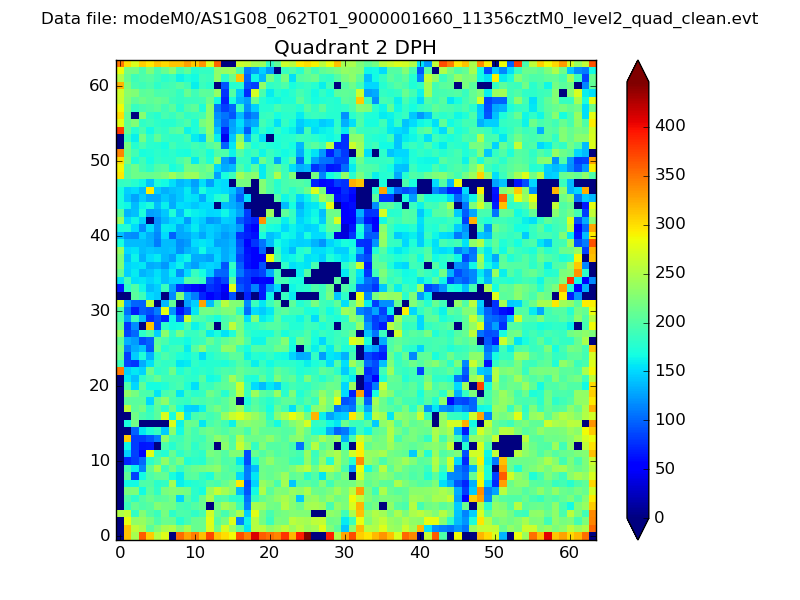
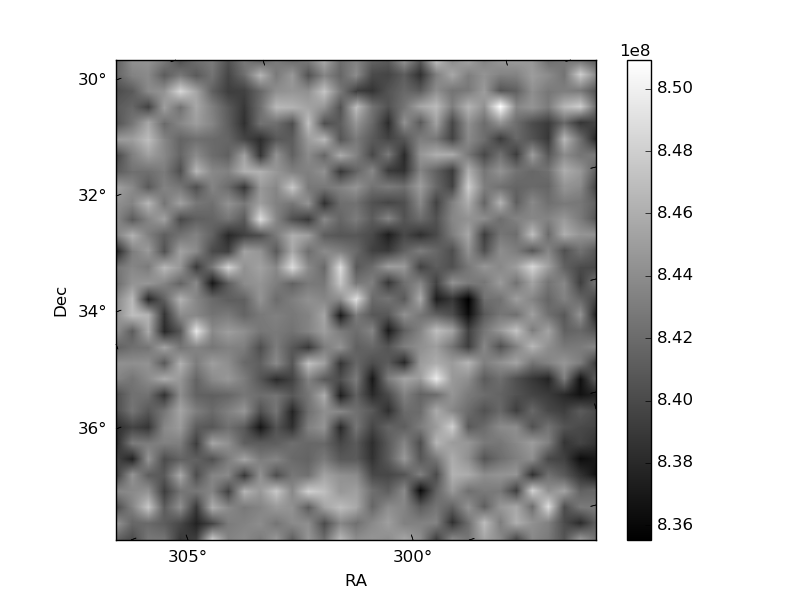
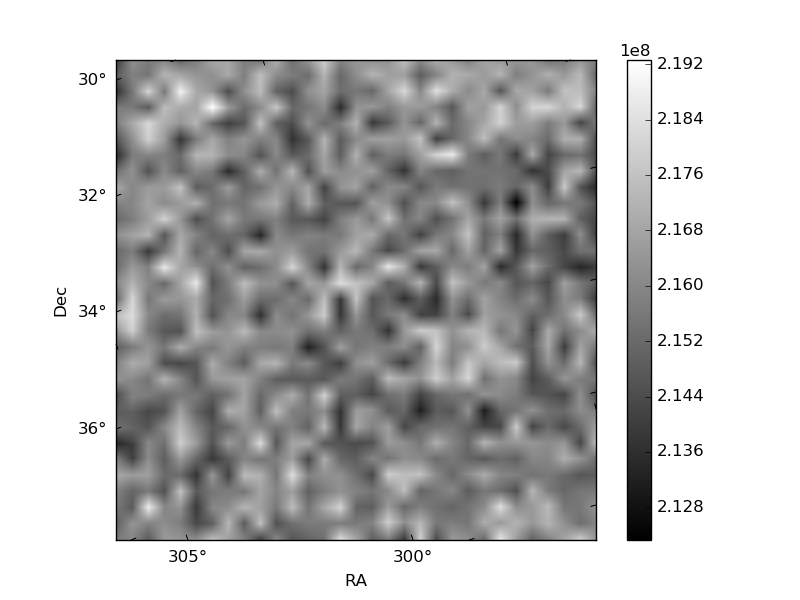
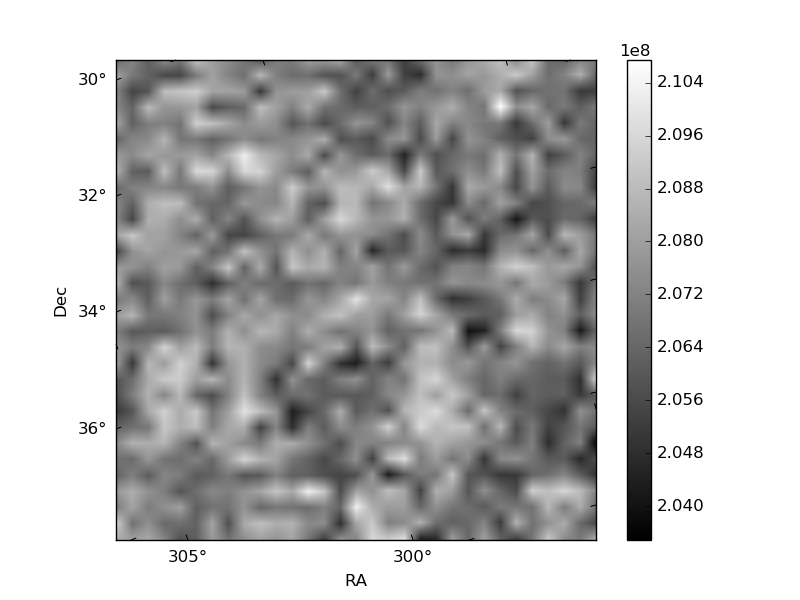
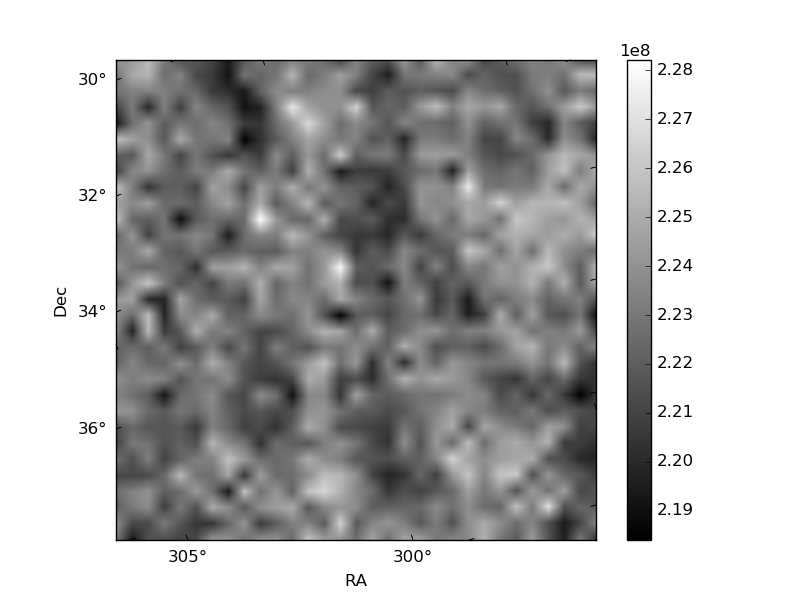
Histogram calculated using DETX and DETY for each event in the final _common_clean file
| Quadrant A | 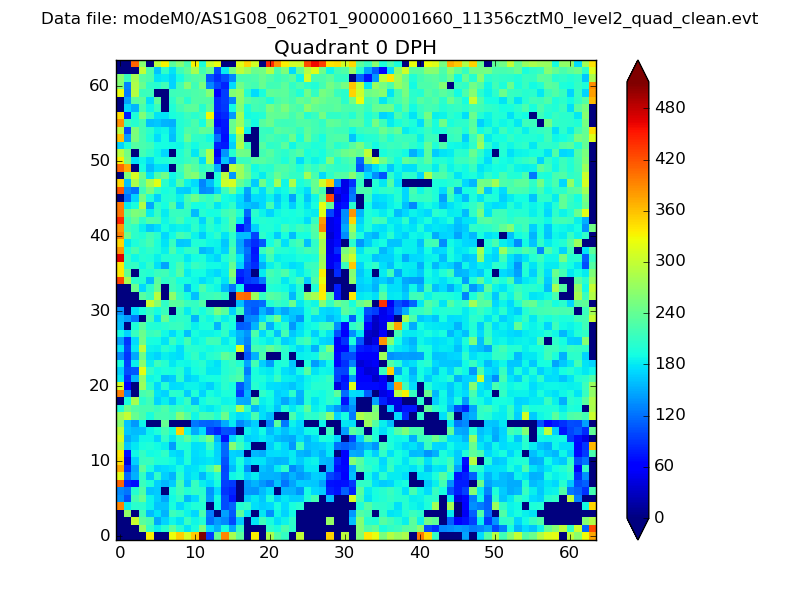 |
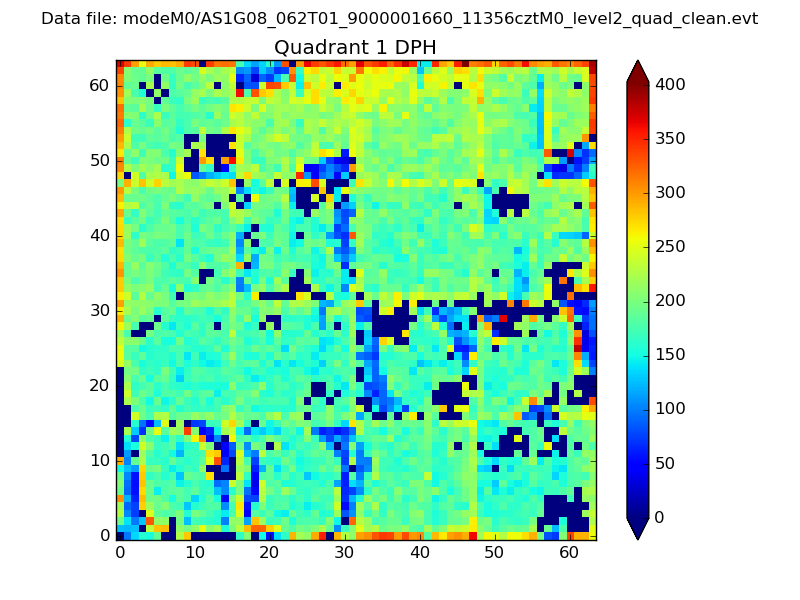 |
Quadrant B |
|---|---|---|---|
| Quadrant D | 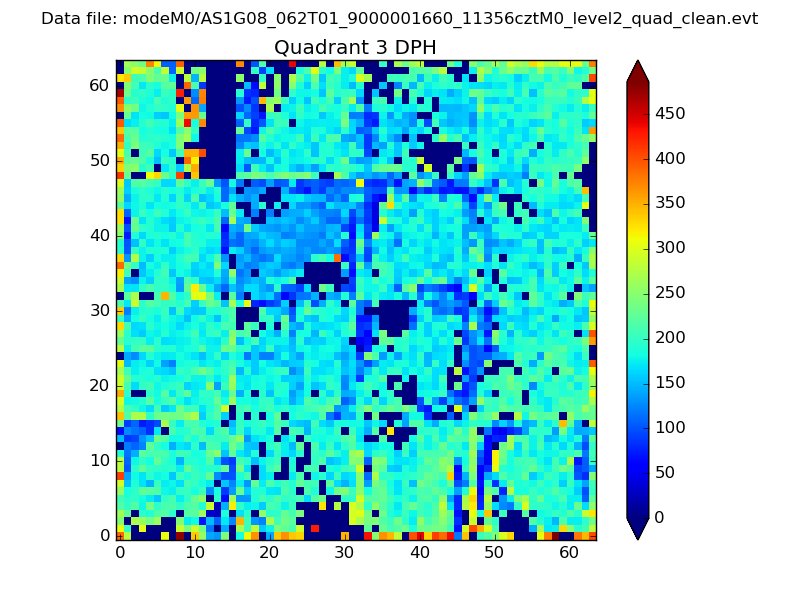 |
 |
Quadrant C |
| Plot type | Count rate plots | Images |
|---|---|---|
| Comparison with Poisson distribution Blue bars denote a histogram of data divided into 1 sec bins. Red curve is a Poisson curve with rate = median count rate of data. |
 |
 |
| Quadrant-wise count rates Data is divided into 100 sec bins |
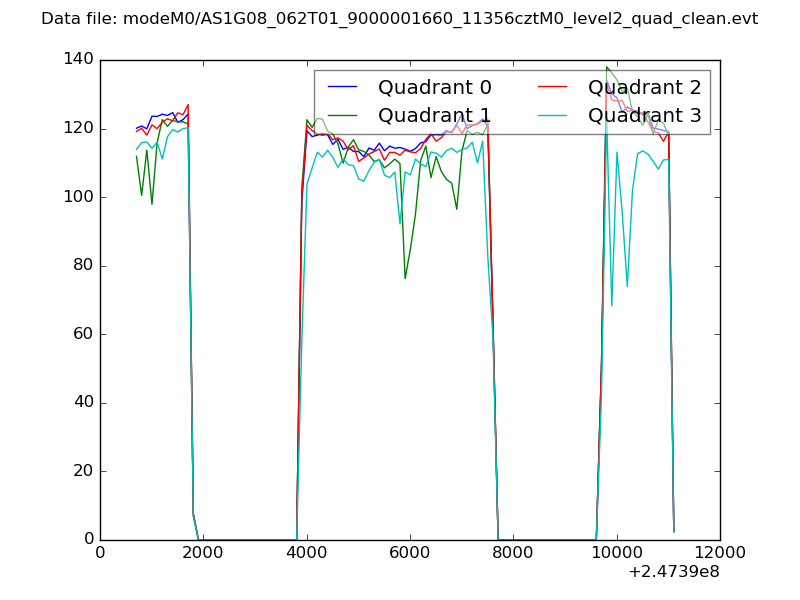 |
|
| Module-wise count rates for Quadrant A Data is divided into 100 sec bins |
 |
 |
| Module-wise count rates for Quadrant B Data is divided into 100 sec bins |
 |
 |
| Module-wise count rates for Quadrant C Data is divided into 100 sec bins |
 |
 |
| Module-wise count rates for Quadrant D Data is divided into 100 sec bins |
 |
 |
| Parameter | Plot |
|---|---|
| CZT HV Monitor | 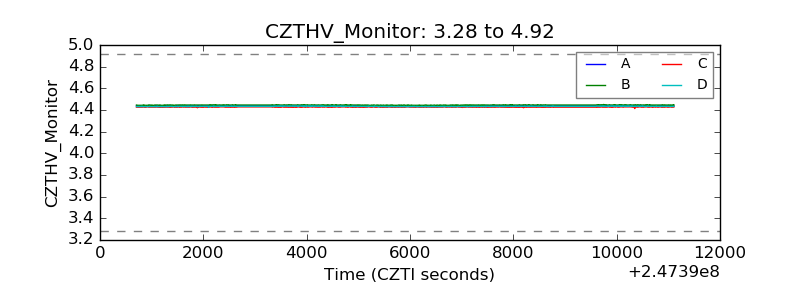 |
| D_VDD | 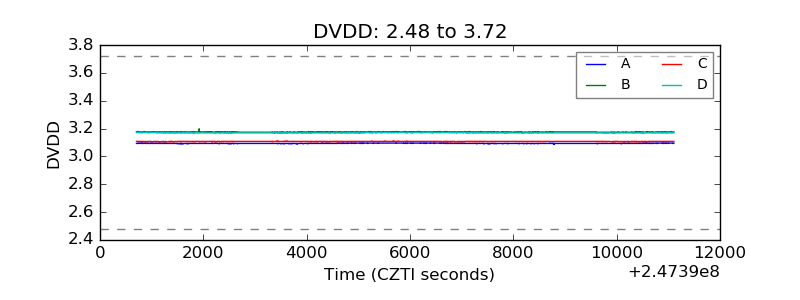 |
| Temperature 1 | 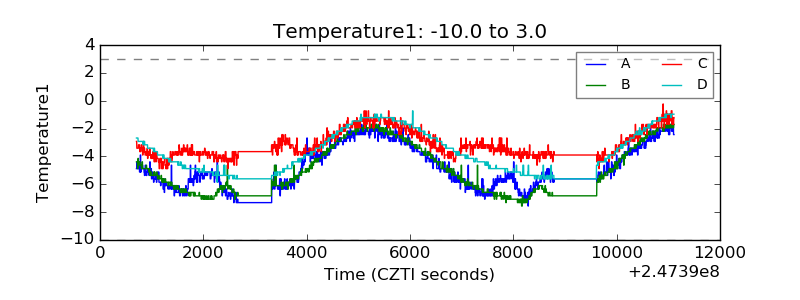 |
| Veto HV Monitor | 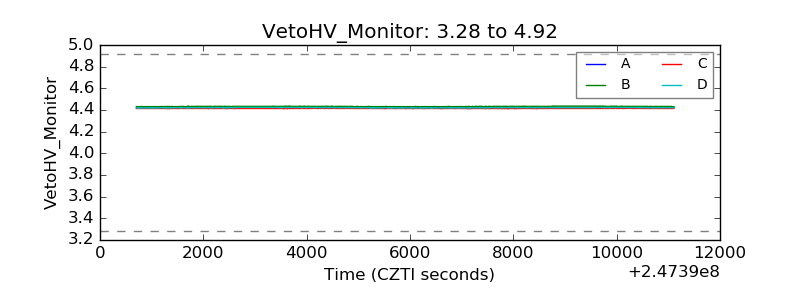 |
| Veto LLD | 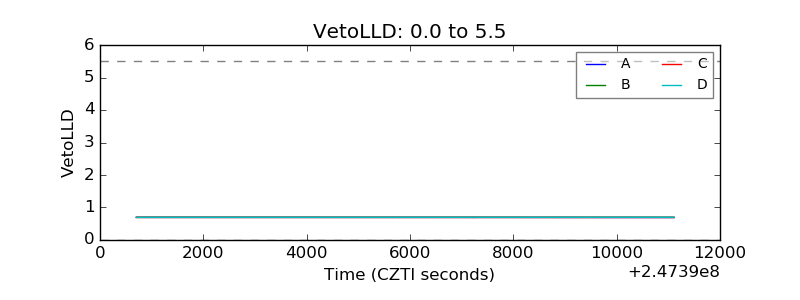 |
| Alpha Counter | 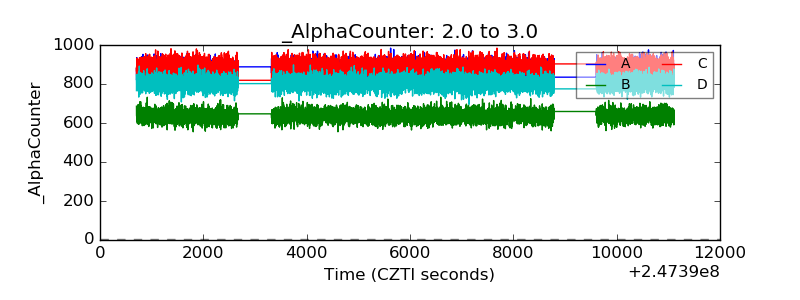 |
| _CPM_Rate | 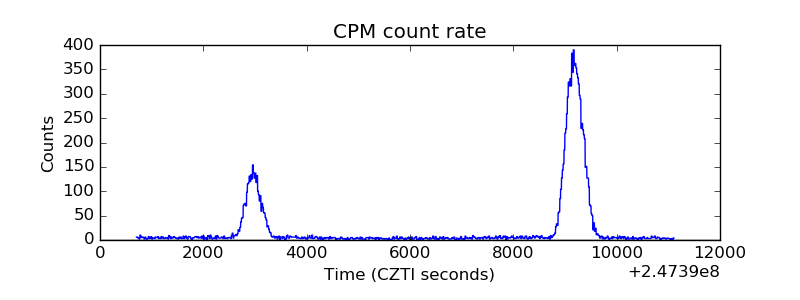 |
| CZT Counter | 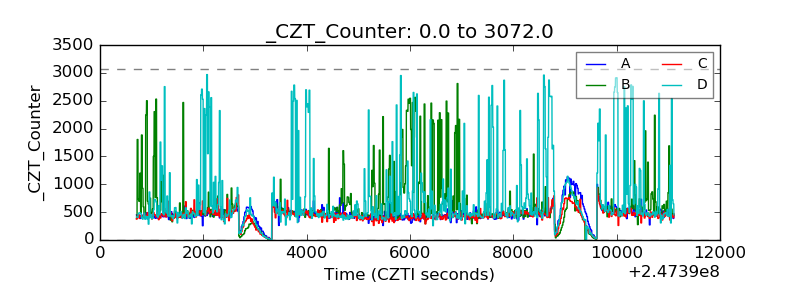 |
| +2.5 Volts monitor |  |
| +5 Volts monitor |  |
| _ROLL_ROT |  |
| _Roll_DEC |  |
| _Roll_RA | 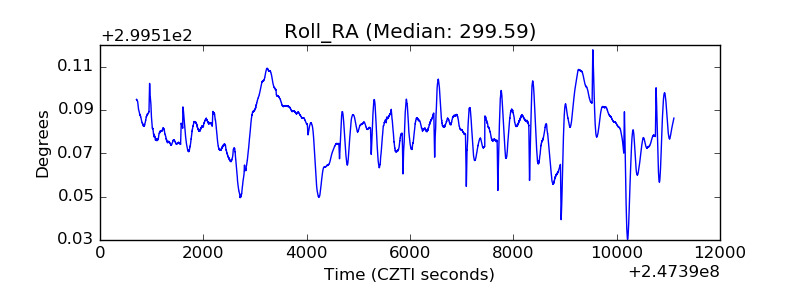 |
| Veto Counter |  |