| Param | Original file | Final file |
|---|---|---|
| Filename | modeM0/AS1G08_062T01_9000001660_11359cztM0_level2.evt | modeM0/AS1G08_062T01_9000001660_11359cztM0_level2_quad_clean.evt |
| Size (bytes) | 527,443,200 | 86,374,080 |
| Size | 503.0 MB | 82.4 MB |
| Events in quadrant A | 2,966,930 | 573,281 |
| Events in quadrant B | 5,367,583 | 521,324 |
| Events in quadrant C | 2,739,252 | 563,489 |
| Events in quadrant D | 4,487,151 | 532,614 |
| Mode M0 | |||
|---|---|---|---|
| Quadrant | BADHDUFLAG | Total packets | Discarded packets |
| A | 0 | 12952 | 2 |
| B | 0 | 20096 | 1 |
| C | 0 | 12440 | 1 |
| D | 0 | 17391 | 1 |
| Mode SS | |||
|---|---|---|---|
| Quadrant | BADHDUFLAG | Total packets | Discarded packets |
| A | 0 | 122 | 0 |
| B | 0 | 122 | 0 |
| C | 0 | 122 | 0 |
| D | 0 | 122 | 0 |
| Mode M9 | |||
|---|---|---|---|
| Quadrant | BADHDUFLAG | Total packets | Discarded packets |
| A | 0 | 12 | 0 |
| B | 0 | 12 | 0 |
| C | 0 | 12 | 0 |
| D | 0 | 12 | 0 |
| Quadrant | Total seconds | Saturated seconds | Saturation percentage |
|---|---|---|---|
| A | 6089 | 53 | 0.870422% |
| B | 6089 | 791 | 12.990639% |
| C | 6089 | 23 | 0.377730% |
| D | 6089 | 457 | 7.505337% |
Noise dominated data is calculated using 1-second bins in cleaned event files. If a bin has >2000 counts, and if more than 50% of those come from <1% of pixels, then it is considered to be noise-dominated and hence unusable.
| Quadrant | # 1 sec bins | Bins with >0 counts | Bins with >2000 counts | High rate bins dominated by noise | Noise dominated (total time) | Noise dominated (detector-on time) | Marked lightcurve |
|---|---|---|---|---|---|---|---|
| A | 7209 | 6090 | 11 | 11 | 0.15% | 0.18% | 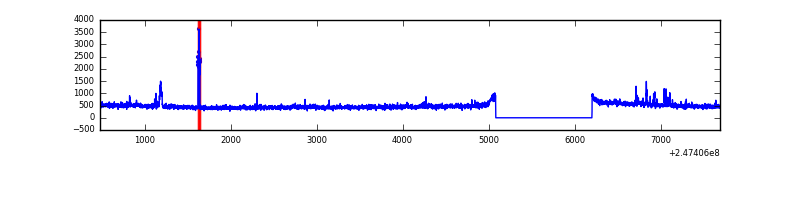 |
| B | 7209 | 6090 | 506 | 506 | 7.02% | 8.31% | 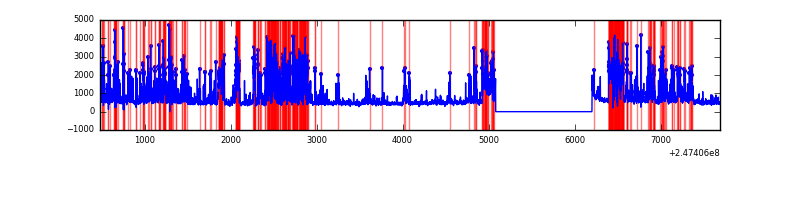 |
| C | 7209 | 6090 | 1 | 1 | 0.01% | 0.02% | 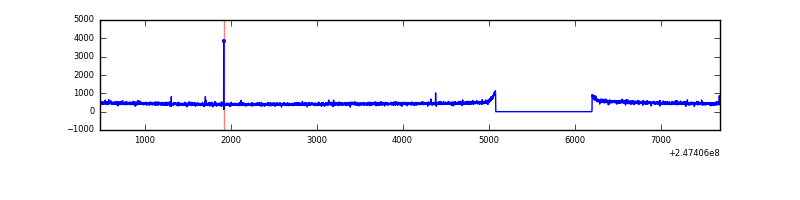 |
| D | 7209 | 6089 | 322 | 322 | 4.47% | 5.29% | 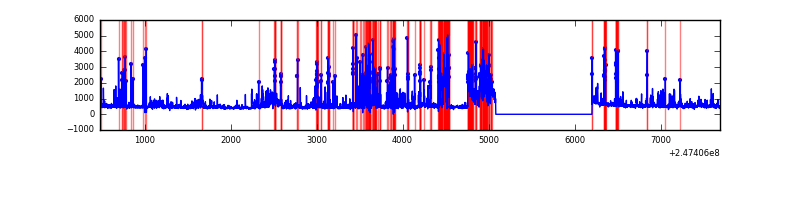 |
Top three noisy pixels from each quadrant. If the there are fewer than three noisy pixels in the level2.evt file, extra rows are filled as -1
| Pixel properties | Quadrant properties | ||||||
|---|---|---|---|---|---|---|---|
| Quadrant | DetID | PixID | Counts | Sigma | Mean | Median | Sigma |
| A | 15 | 174 | 101482 | 688.22 | 724 | 709 | 146.4 |
| A | 1 | 162 | 30181 | 201.28 | 724 | 709 | 146.4 |
| A | 1 | 178 | 16042 | 104.71 | 724 | 709 | 146.4 |
| B | 3 | 64 | 1561945 | 12257.64 | 672 | 655 | 127.4 |
| B | 4 | 239 | 1027037 | 8058.1 | 672 | 655 | 127.4 |
| B | 15 | 204 | 66390 | 516.08 | 672 | 655 | 127.4 |
| C | 14 | 234 | 5954 | 32.39 | 700 | 704 | 162.1 |
| C | 13 | 61 | 5220 | 27.86 | 700 | 704 | 162.1 |
| C | 8 | 222 | 3011 | 14.23 | 700 | 704 | 162.1 |
| D | 10 | 253 | 1307140 | 8061.01 | 679 | 661 | 162.1 |
| D | 1 | 52 | 262947 | 1618.31 | 679 | 661 | 162.1 |
| D | 2 | 120 | 82097 | 502.46 | 679 | 661 | 162.1 |
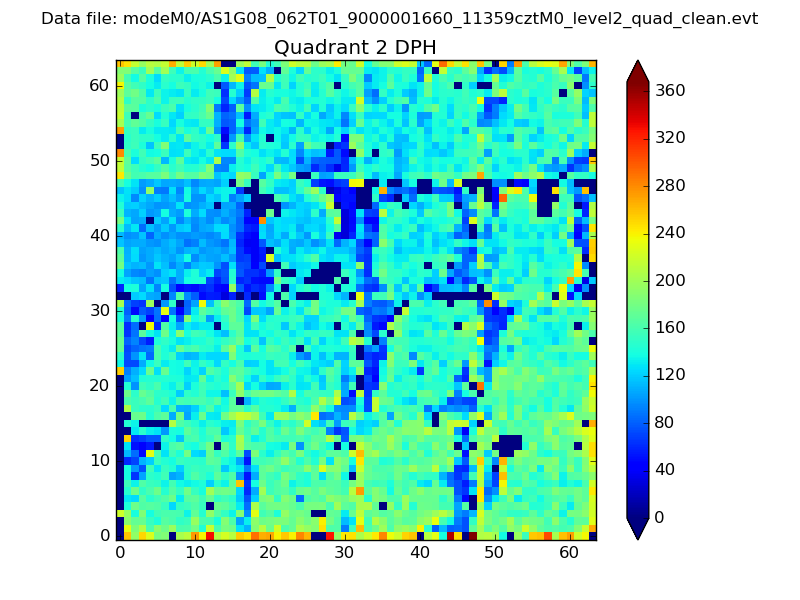
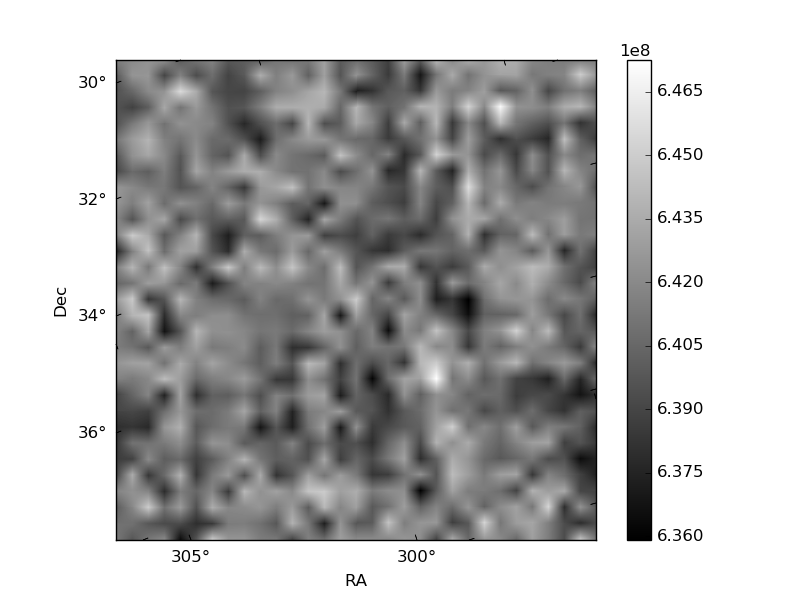
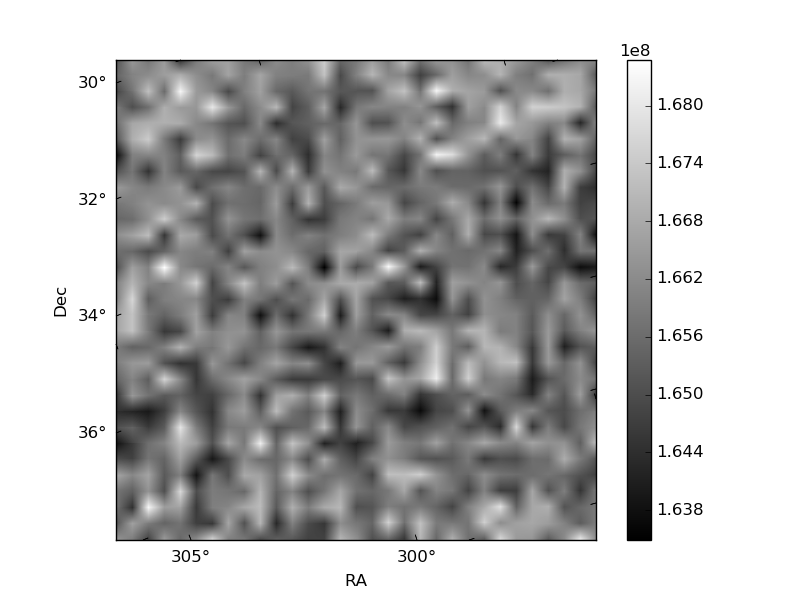
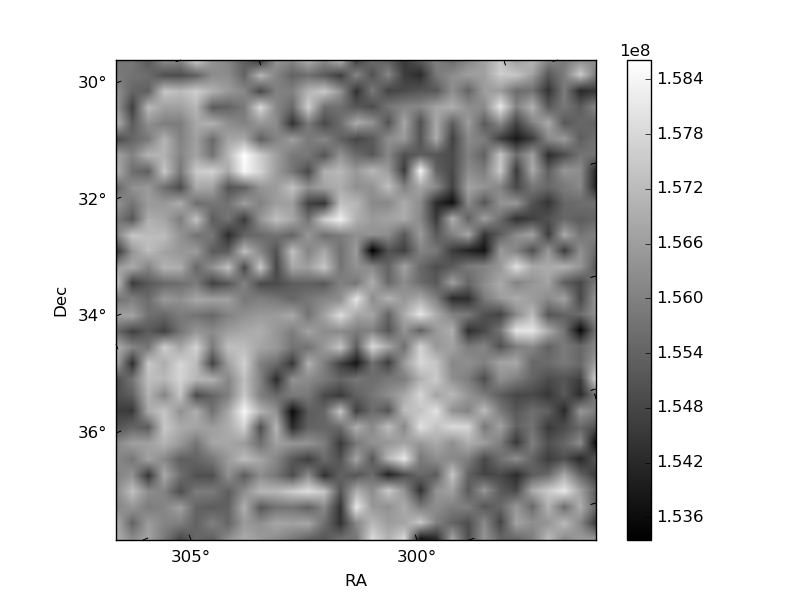
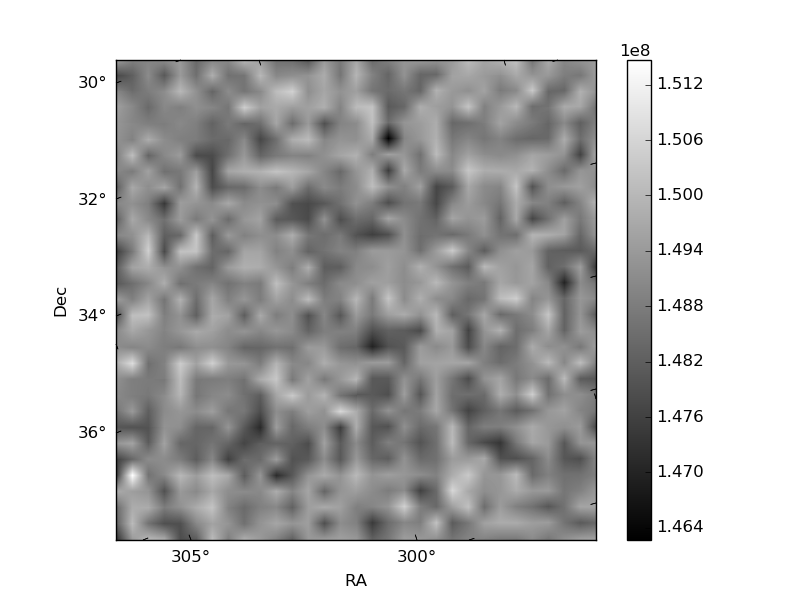
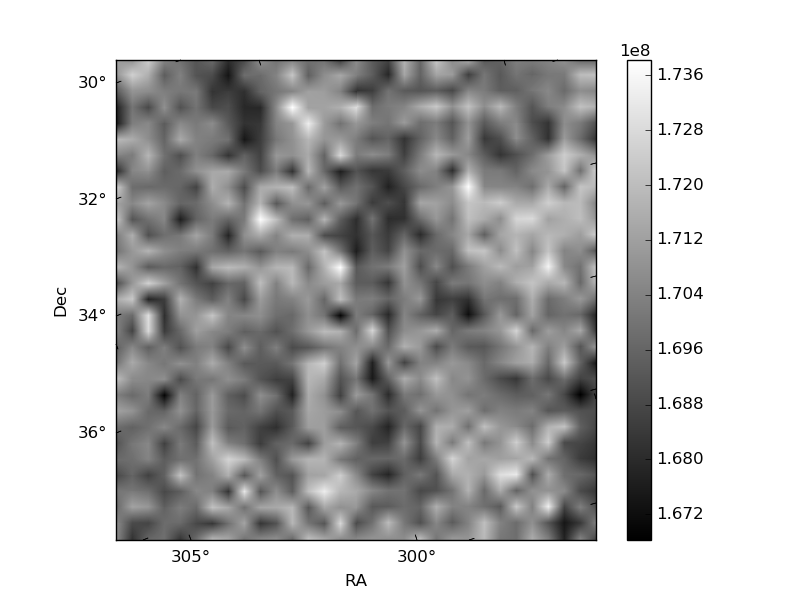
Histogram calculated using DETX and DETY for each event in the final _common_clean file
| Quadrant A | 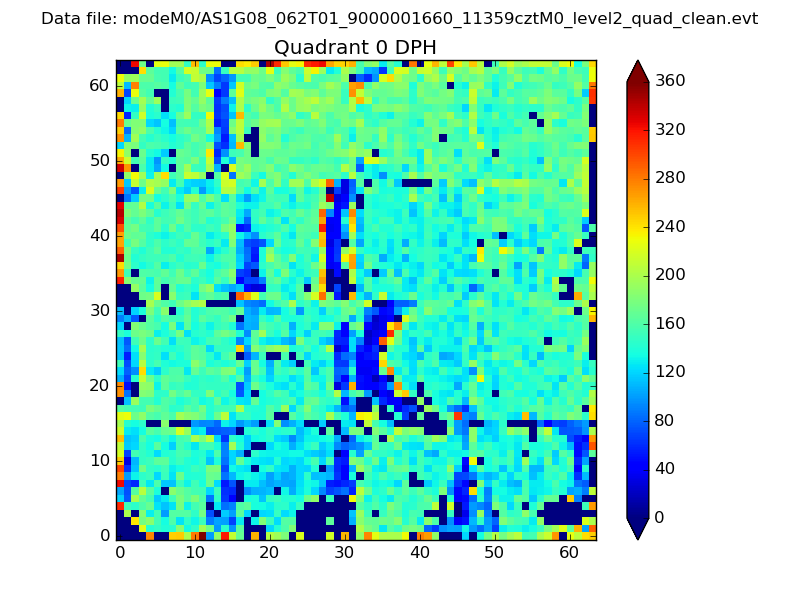 |
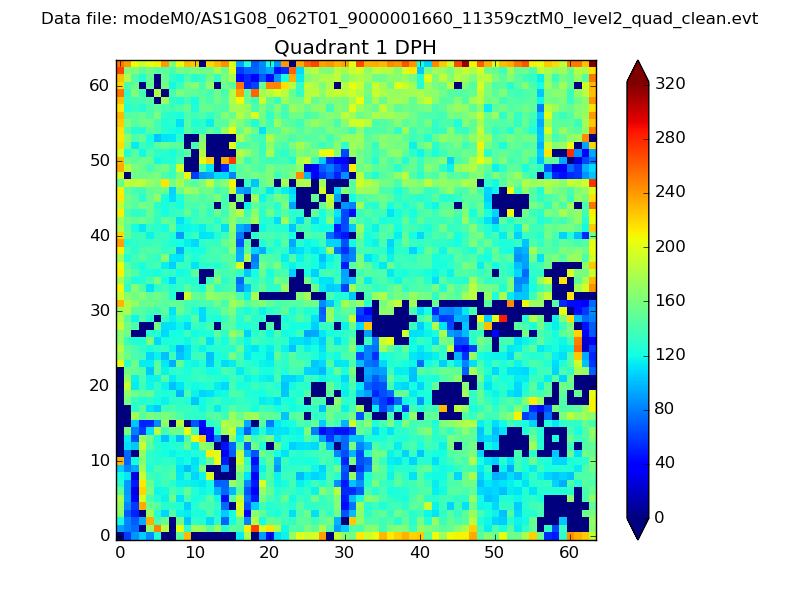 |
Quadrant B |
|---|---|---|---|
| Quadrant D | 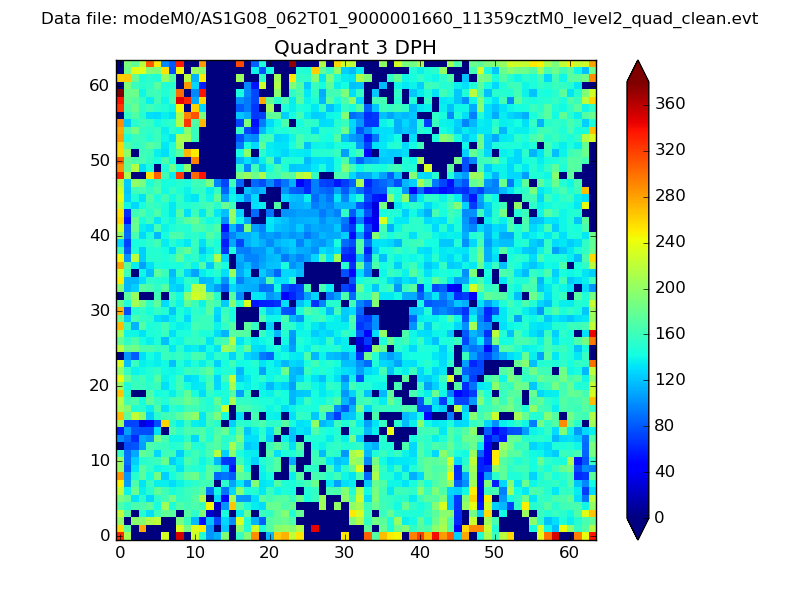 |
 |
Quadrant C |
| Plot type | Count rate plots | Images |
|---|---|---|
| Comparison with Poisson distribution Blue bars denote a histogram of data divided into 1 sec bins. Red curve is a Poisson curve with rate = median count rate of data. |
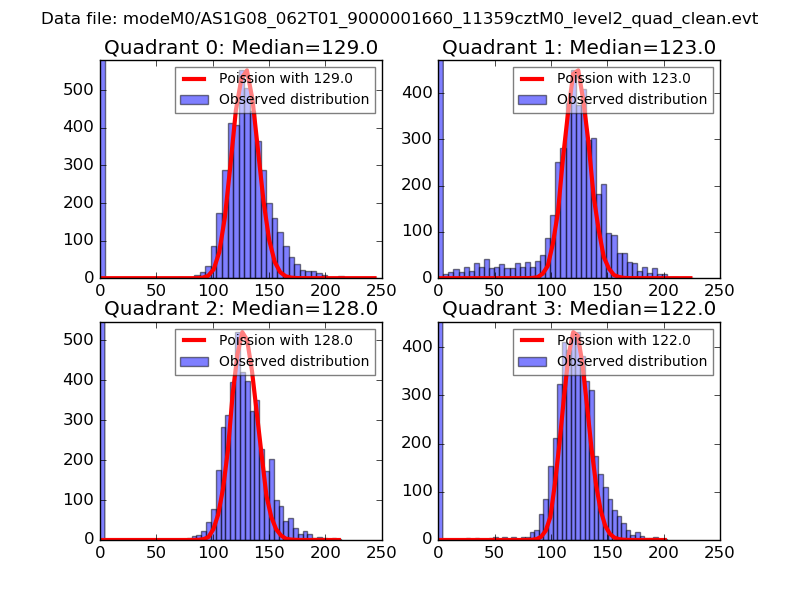 |
 |
| Quadrant-wise count rates Data is divided into 100 sec bins |
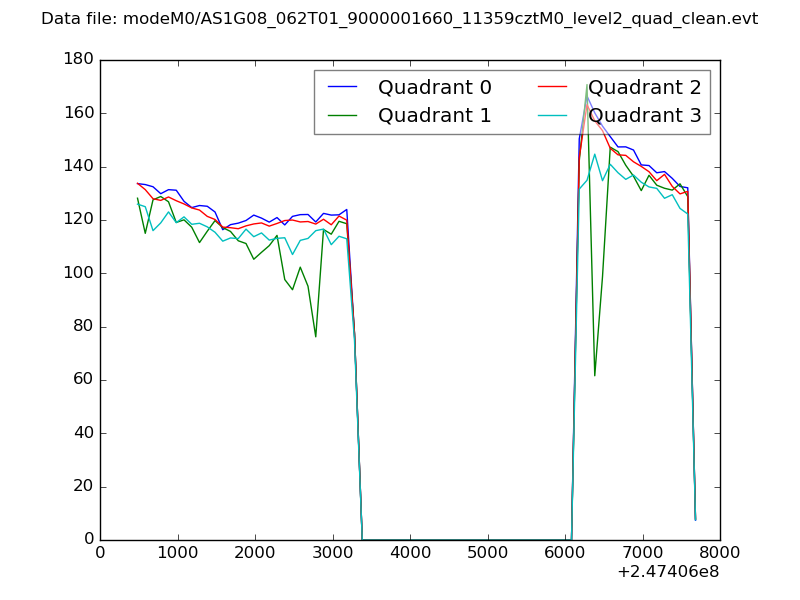 |
|
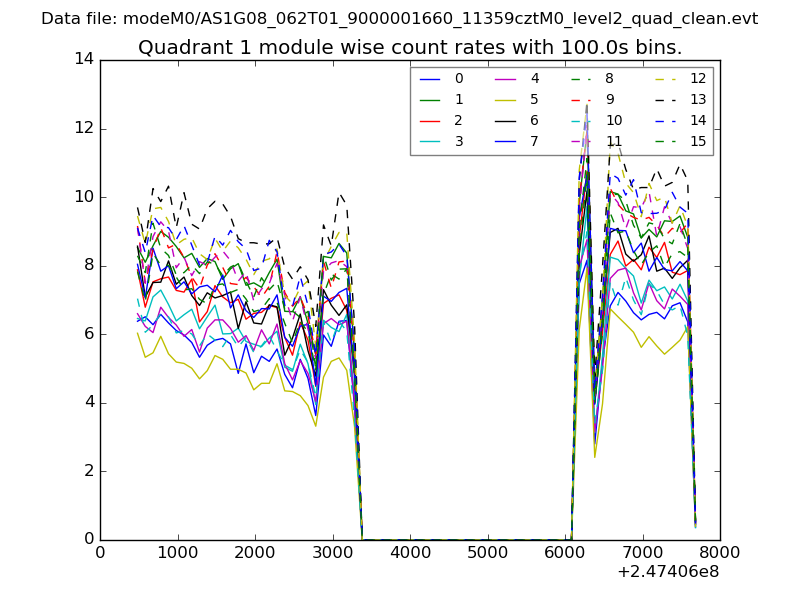
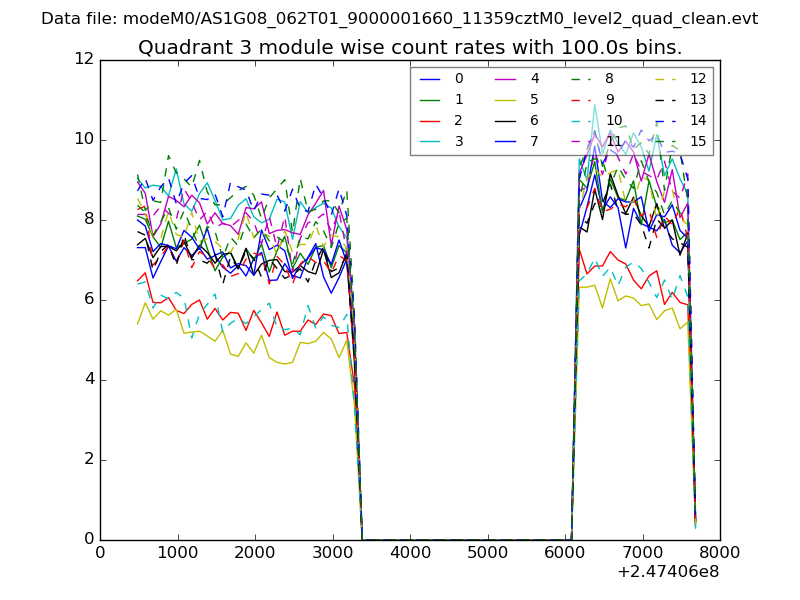
| Module-wise count rates for Quadrant A Data is divided into 100 sec bins |
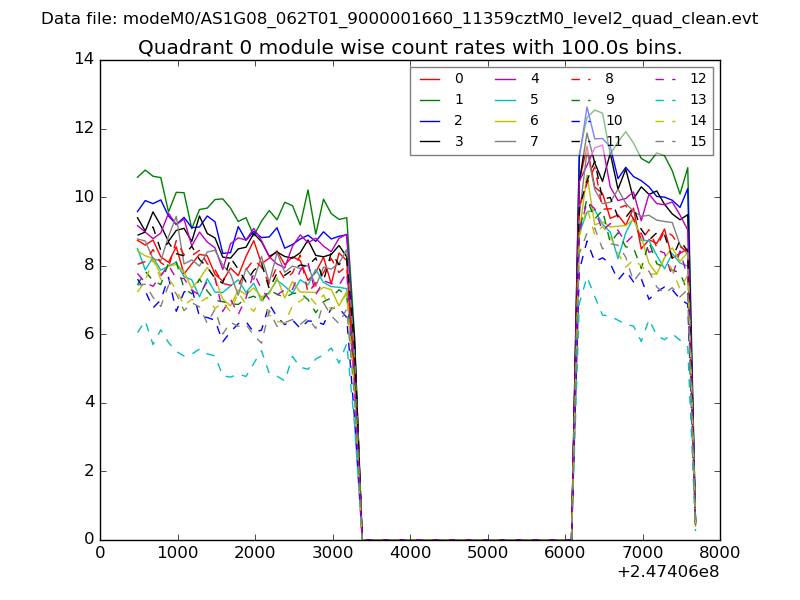 |
 |
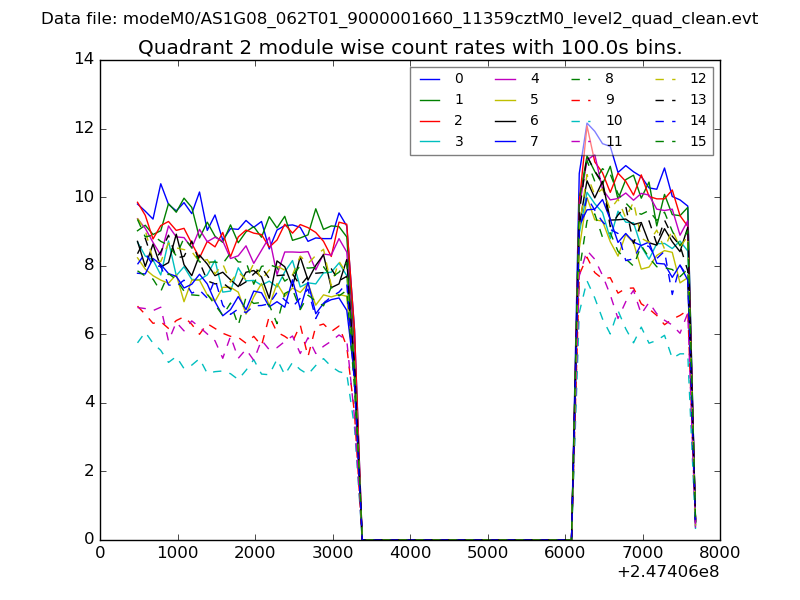
| Module-wise count rates for Quadrant B Data is divided into 100 sec bins |
 |
 |
| Module-wise count rates for Quadrant C Data is divided into 100 sec bins |
 |
 |
| Module-wise count rates for Quadrant D Data is divided into 100 sec bins |
 |
 |
| Parameter | Plot |
|---|---|
| CZT HV Monitor | 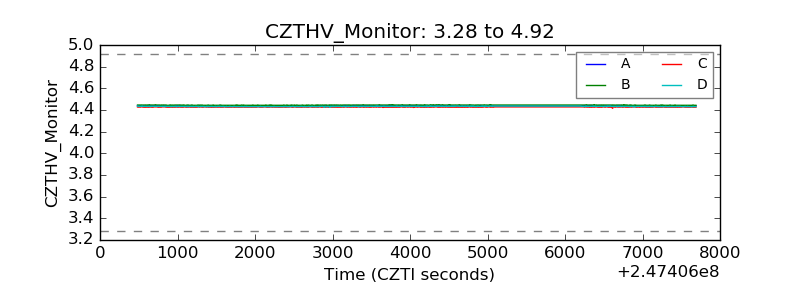 |
| D_VDD | 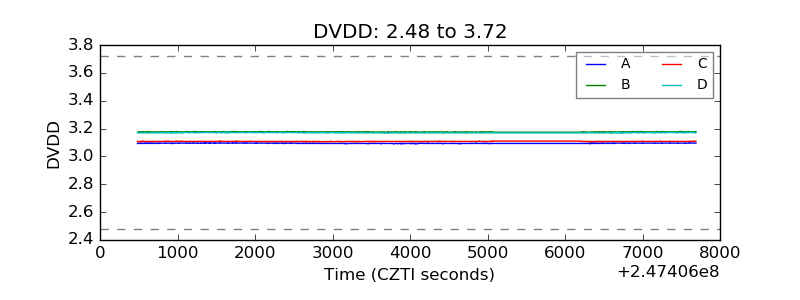 |
| Temperature 1 | 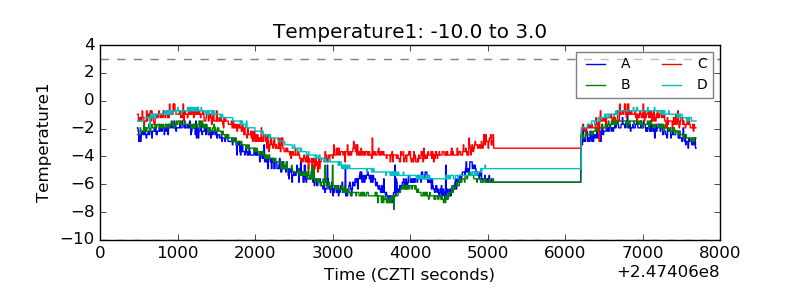 |
| Veto HV Monitor | 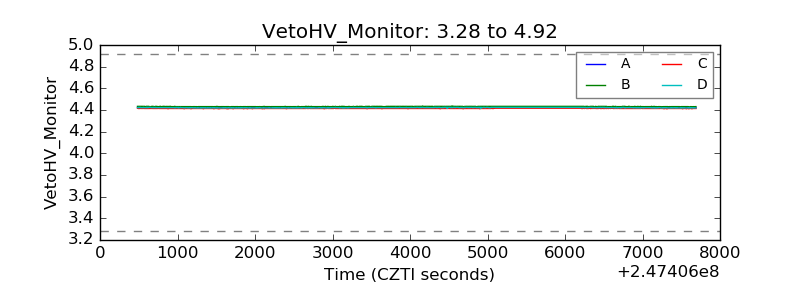 |
| Veto LLD | 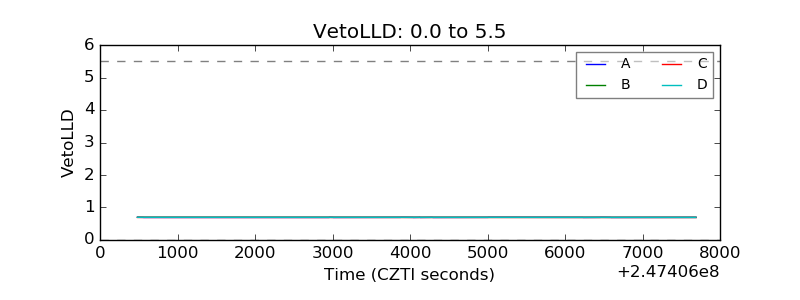 |
| Alpha Counter | 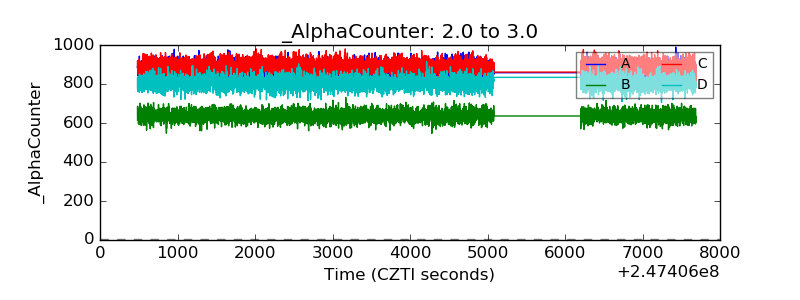 |
| _CPM_Rate |  |
| CZT Counter | 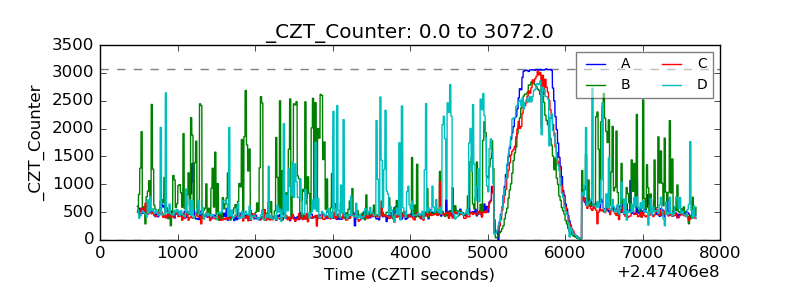 |
| +2.5 Volts monitor |  |
| +5 Volts monitor |  |
| _ROLL_ROT | 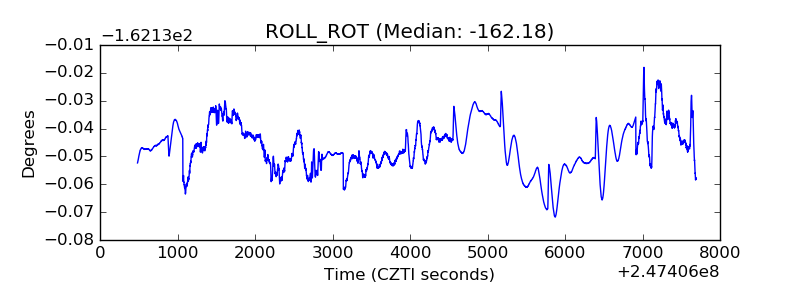 |
| _Roll_DEC |  |
| _Roll_RA | 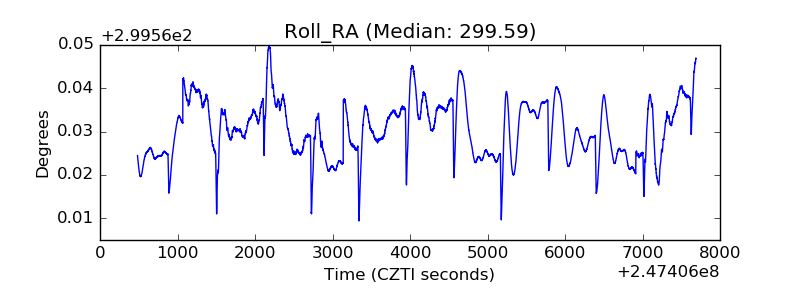 |
| Veto Counter | 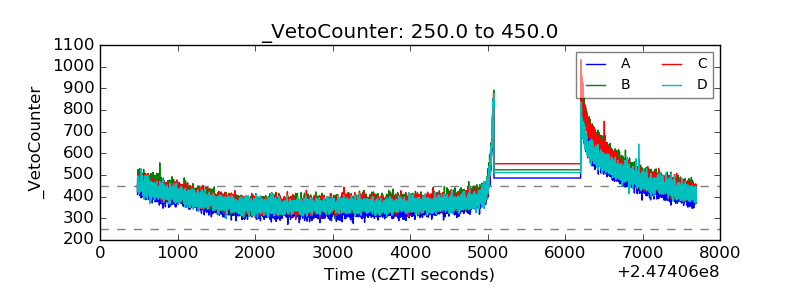 |