| Param | Original file | Final file |
|---|---|---|
| Filename | modeM0/AS1G08_062T01_9000001660_11361cztM0_level2.evt | modeM0/AS1G08_062T01_9000001660_11361cztM0_level2_quad_clean.evt |
| Size (bytes) | 482,181,120 | 82,609,920 |
| Size | 459.8 MB | 78.8 MB |
| Events in quadrant A | 2,870,401 | 539,351 |
| Events in quadrant B | 4,234,921 | 512,666 |
| Events in quadrant C | 2,759,609 | 537,141 |
| Events in quadrant D | 4,340,922 | 503,509 |
| Mode M0 | |||
|---|---|---|---|
| Quadrant | BADHDUFLAG | Total packets | Discarded packets |
| A | 0 | 12181 | 2 |
| B | 0 | 16385 | 1 |
| C | 0 | 11983 | 1 |
| D | 0 | 16876 | 1 |
| Mode SS | |||
|---|---|---|---|
| Quadrant | BADHDUFLAG | Total packets | Discarded packets |
| A | 0 | 118 | 0 |
| B | 0 | 118 | 0 |
| C | 0 | 118 | 0 |
| D | 0 | 118 | 0 |
| Mode M9 | |||
|---|---|---|---|
| Quadrant | BADHDUFLAG | Total packets | Discarded packets |
| A | 0 | 13 | 0 |
| B | 0 | 13 | 0 |
| C | 0 | 13 | 0 |
| D | 0 | 13 | 0 |
| Quadrant | Total seconds | Saturated seconds | Saturation percentage |
|---|---|---|---|
| A | 5844 | 31 | 0.530459% |
| B | 5844 | 412 | 7.049966% |
| C | 5844 | 19 | 0.325120% |
| D | 5844 | 448 | 7.665982% |
Noise dominated data is calculated using 1-second bins in cleaned event files. If a bin has >2000 counts, and if more than 50% of those come from <1% of pixels, then it is considered to be noise-dominated and hence unusable.
| Quadrant | # 1 sec bins | Bins with >0 counts | Bins with >2000 counts | High rate bins dominated by noise | Noise dominated (total time) | Noise dominated (detector-on time) | Marked lightcurve |
|---|---|---|---|---|---|---|---|
| A | 7164 | 5845 | 0 | 0 | 0.00% | 0.00% | 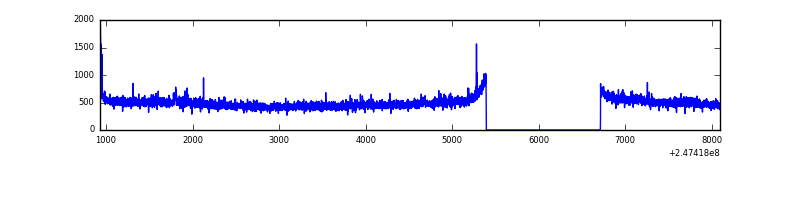 |
| B | 7164 | 5845 | 279 | 279 | 3.89% | 4.77% | 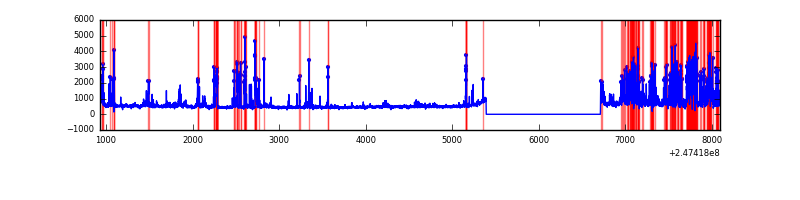 |
| C | 7164 | 5845 | 0 | 0 | 0.00% | 0.00% | 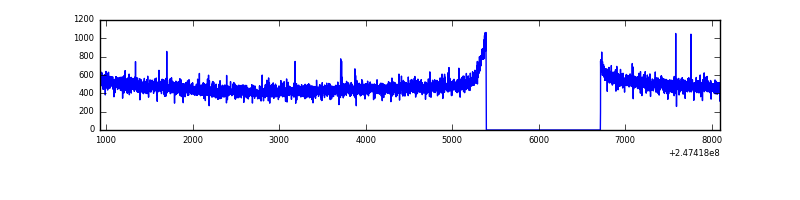 |
| D | 7164 | 5845 | 320 | 320 | 4.47% | 5.47% | 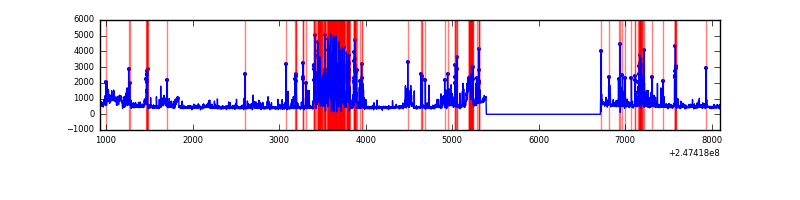 |
Top three noisy pixels from each quadrant. If the there are fewer than three noisy pixels in the level2.evt file, extra rows are filled as -1
| Pixel properties | Quadrant properties | ||||||
|---|---|---|---|---|---|---|---|
| Quadrant | DetID | PixID | Counts | Sigma | Mean | Median | Sigma |
| A | 11 | 29 | 27407 | 185.25 | 717 | 704 | 144.1 |
| A | 15 | 174 | 19556 | 130.79 | 717 | 704 | 144.1 |
| A | 1 | 162 | 19073 | 127.44 | 717 | 704 | 144.1 |
| B | 3 | 64 | 946856 | 7275.58 | 699 | 682 | 130.0 |
| B | 4 | 239 | 460325 | 3534.41 | 699 | 682 | 130.0 |
| B | 15 | 204 | 40009 | 302.4 | 699 | 682 | 130.0 |
| C | 14 | 67 | 9360 | 53.3 | 704 | 709 | 162.3 |
| C | 13 | 61 | 5163 | 27.44 | 704 | 709 | 162.3 |
| C | 8 | 222 | 4774 | 25.05 | 704 | 709 | 162.3 |
| D | 10 | 253 | 880684 | 5460.72 | 677 | 661 | 161.2 |
| D | 13 | 152 | 431413 | 2672.9 | 677 | 661 | 161.2 |
| D | 2 | 14 | 195455 | 1208.73 | 677 | 661 | 161.2 |
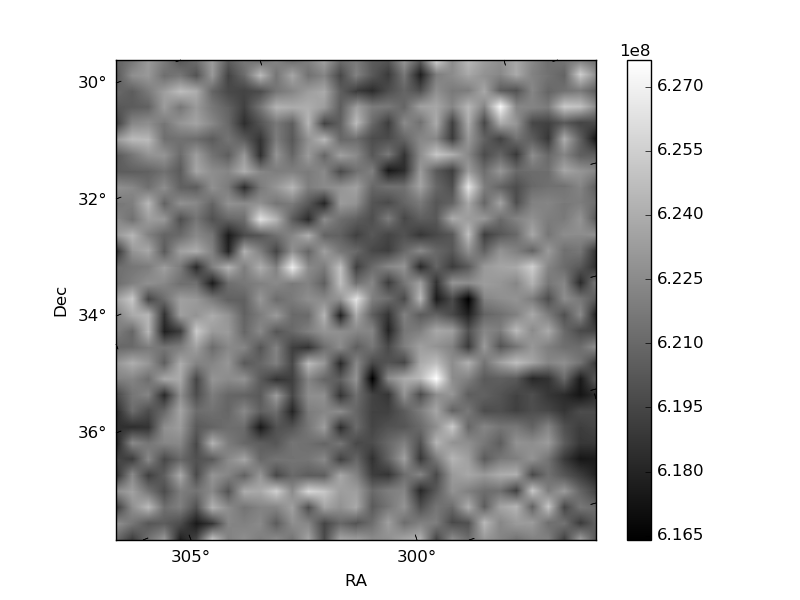
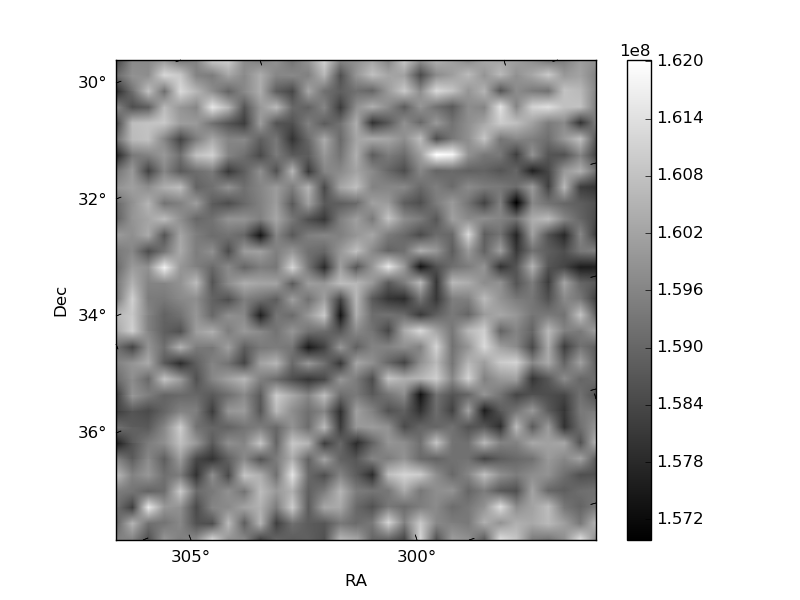
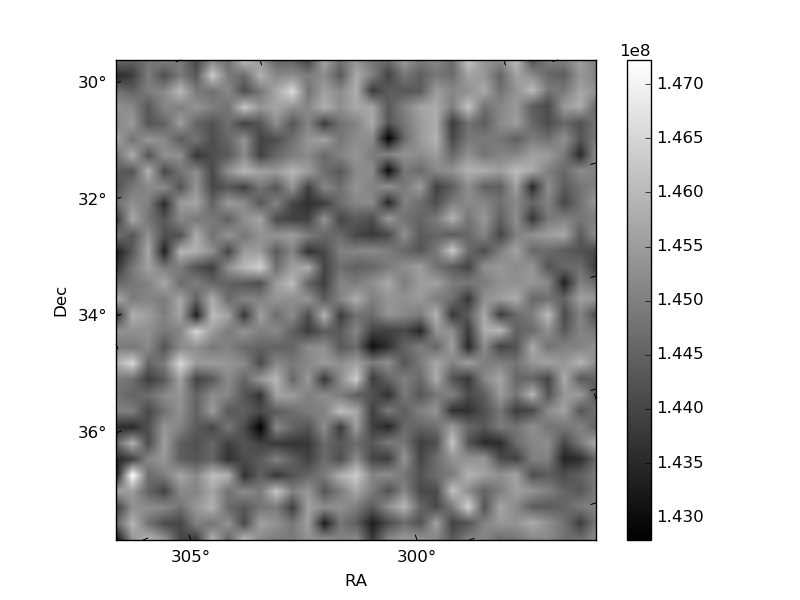
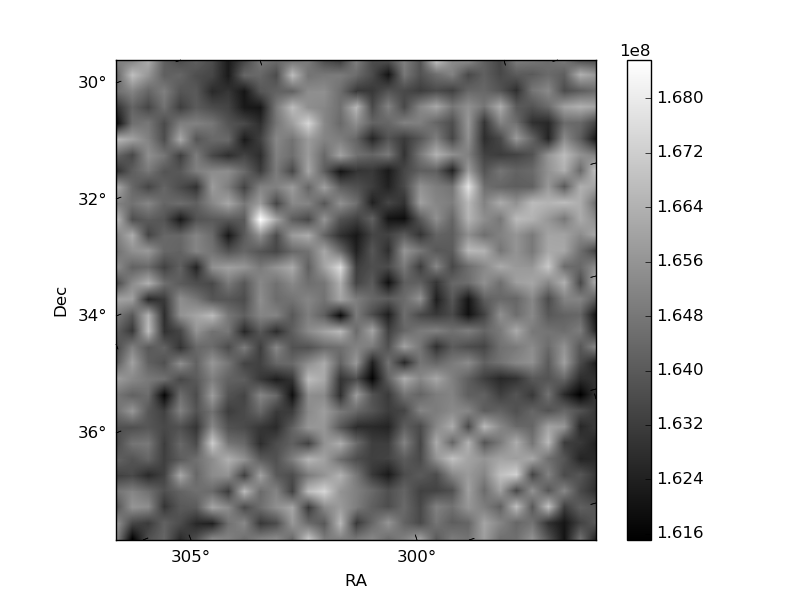
Histogram calculated using DETX and DETY for each event in the final _common_clean file
| Quadrant A | 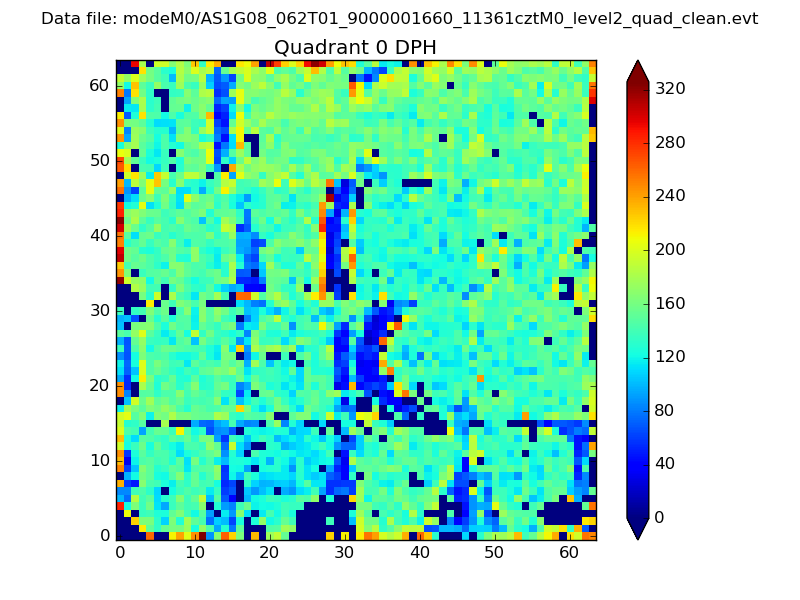 |
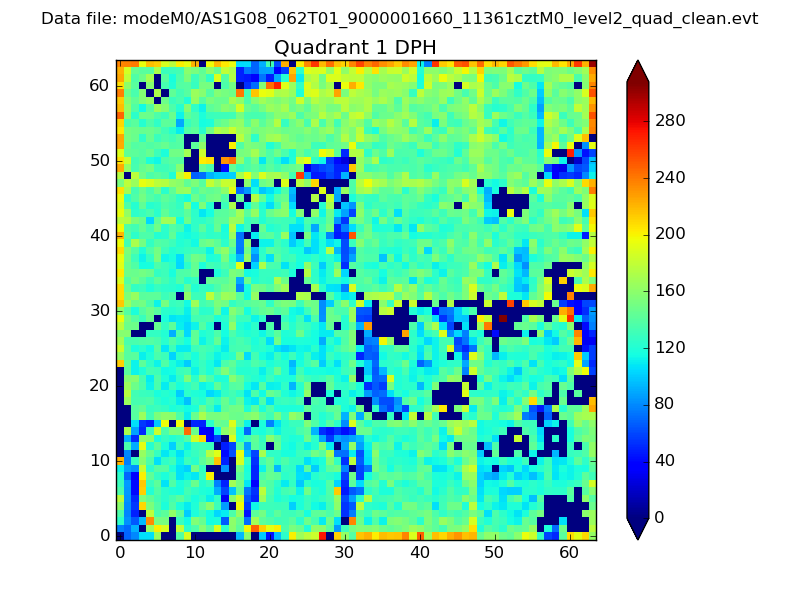 |
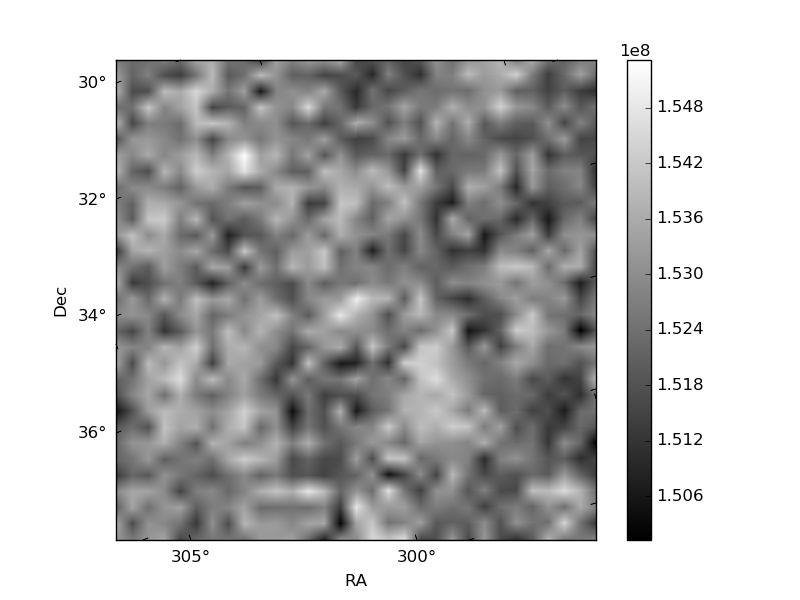
Quadrant B |
|---|---|---|---|
| Quadrant D | 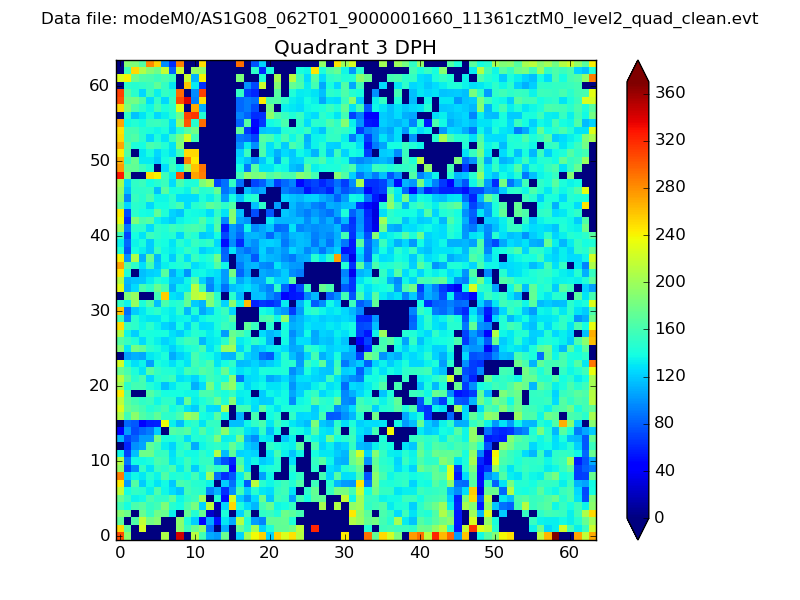 |
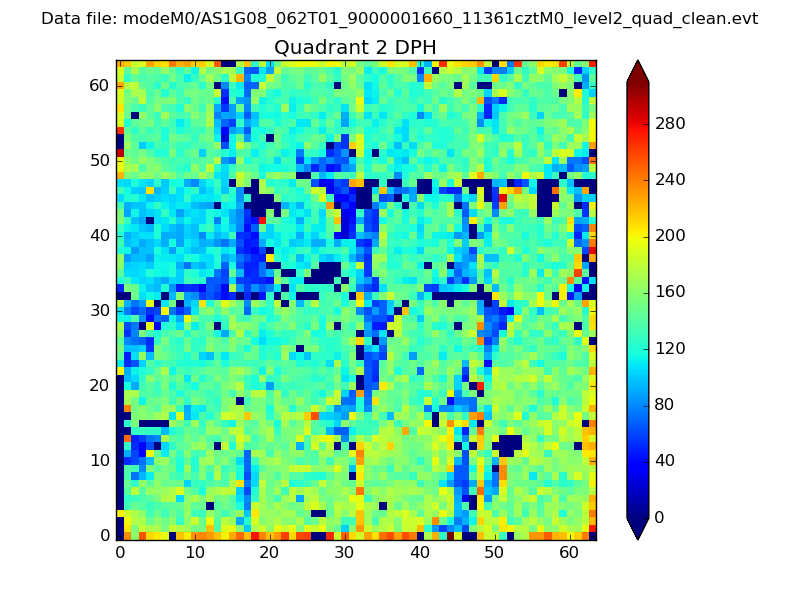 |
Quadrant C |
| Plot type | Count rate plots | Images |
|---|---|---|
| Comparison with Poisson distribution Blue bars denote a histogram of data divided into 1 sec bins. Red curve is a Poisson curve with rate = median count rate of data. |
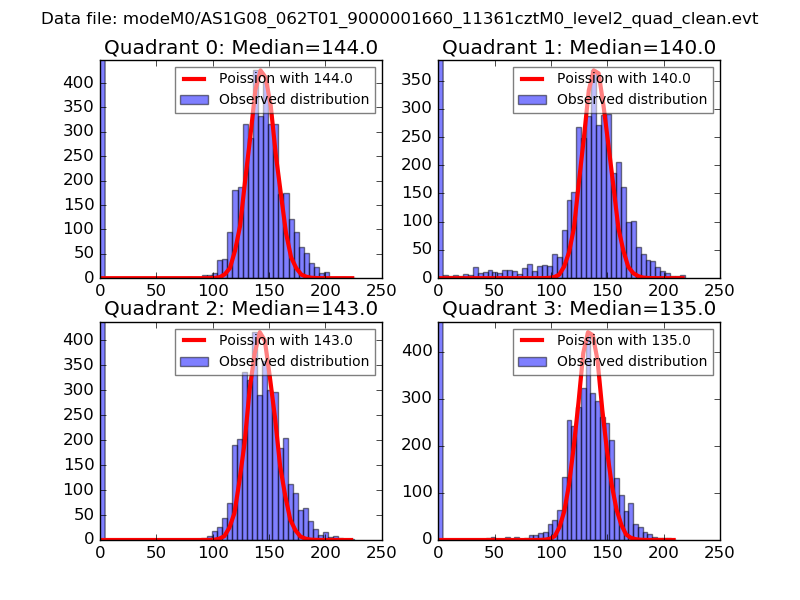 |
 |
| Quadrant-wise count rates Data is divided into 100 sec bins |
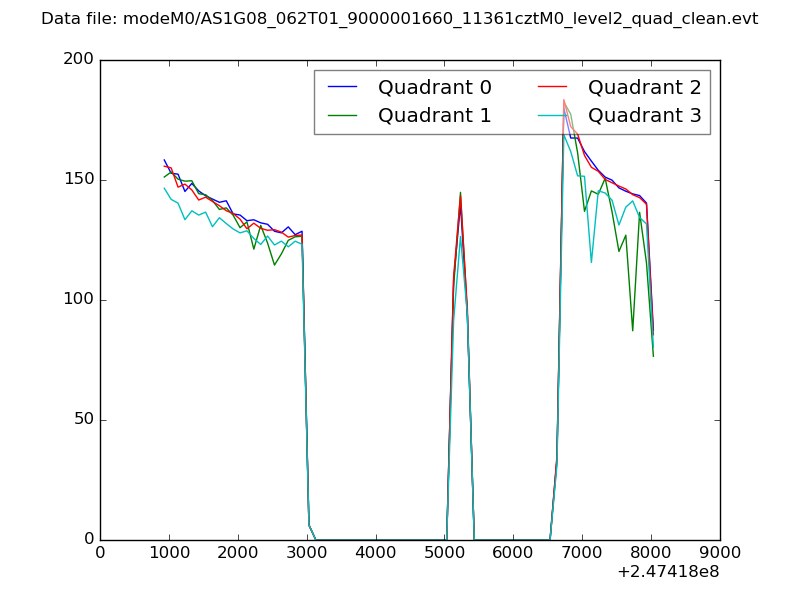 |
|
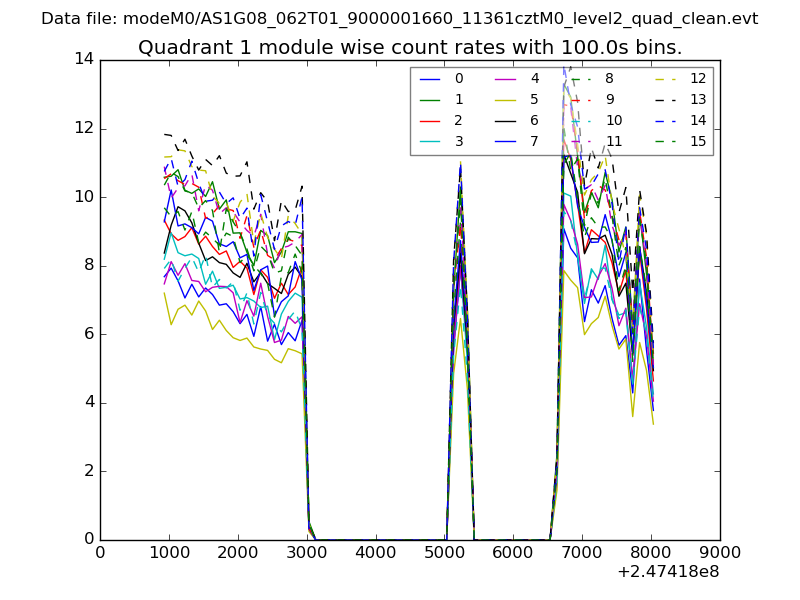
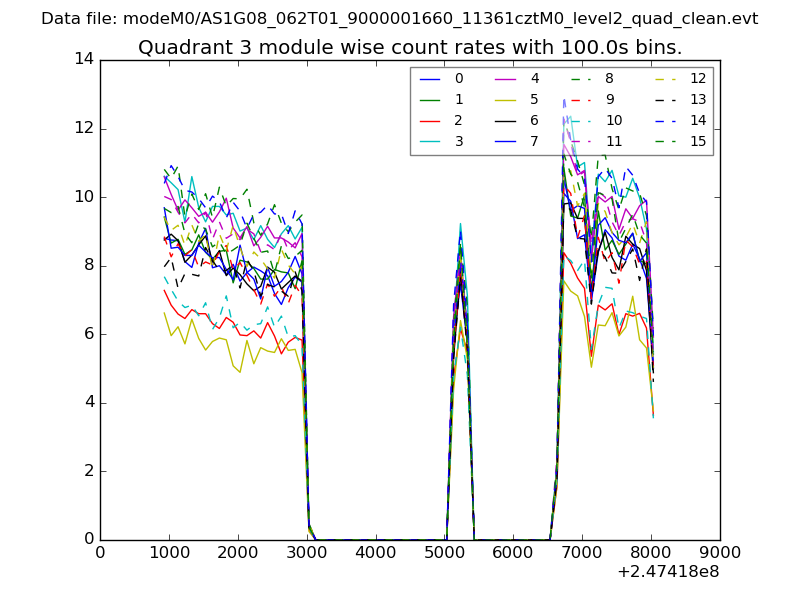
| Module-wise count rates for Quadrant A Data is divided into 100 sec bins |
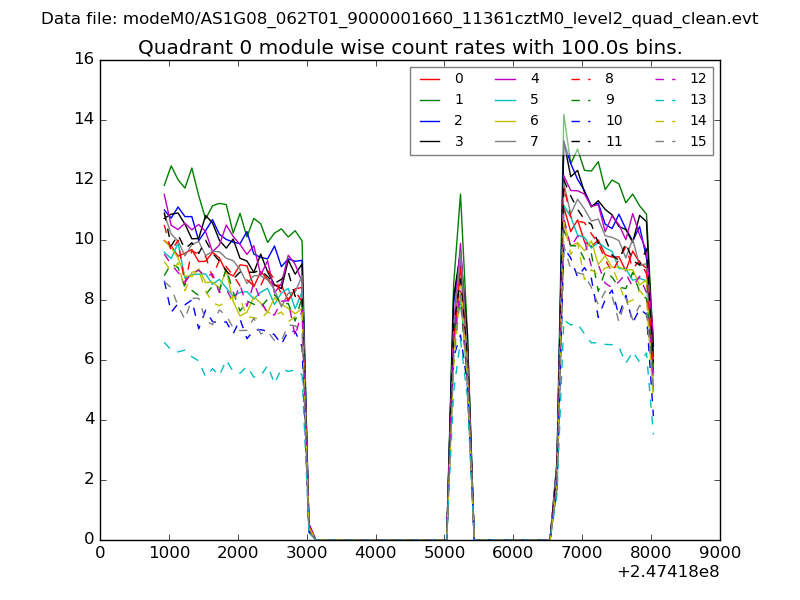 |
 |
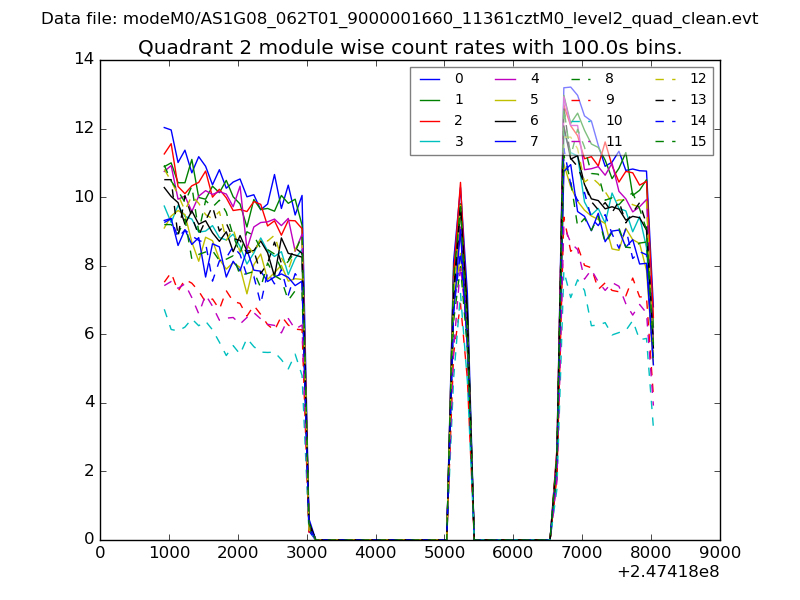
| Module-wise count rates for Quadrant B Data is divided into 100 sec bins |
 |
 |
| Module-wise count rates for Quadrant C Data is divided into 100 sec bins |
 |
 |
| Module-wise count rates for Quadrant D Data is divided into 100 sec bins |
 |
 |
| Parameter | Plot |
|---|---|
| CZT HV Monitor | 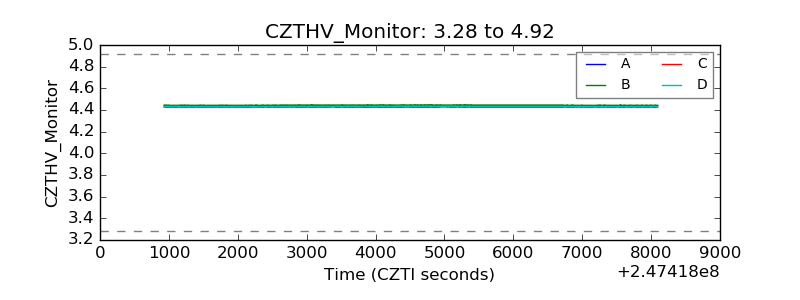 |
| D_VDD | 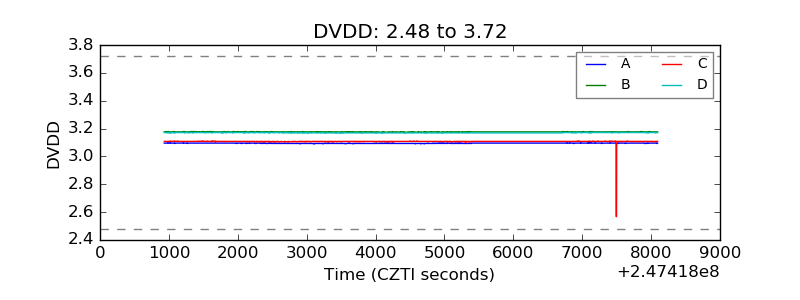 |
| Temperature 1 | 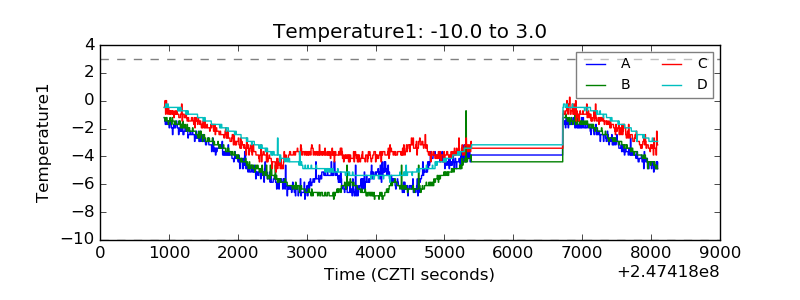 |
| Veto HV Monitor | 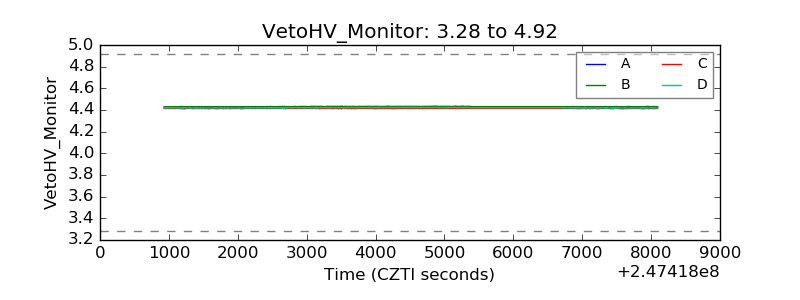 |
| Veto LLD | 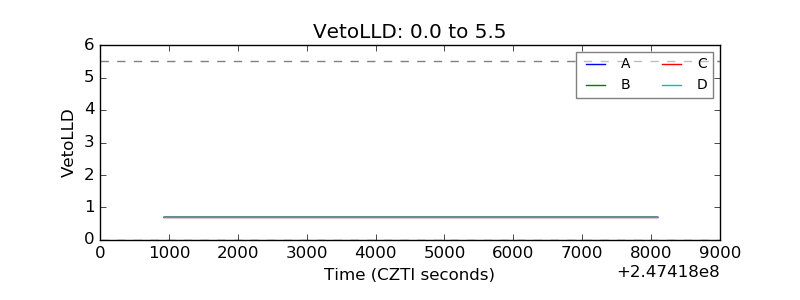 |
| Alpha Counter | 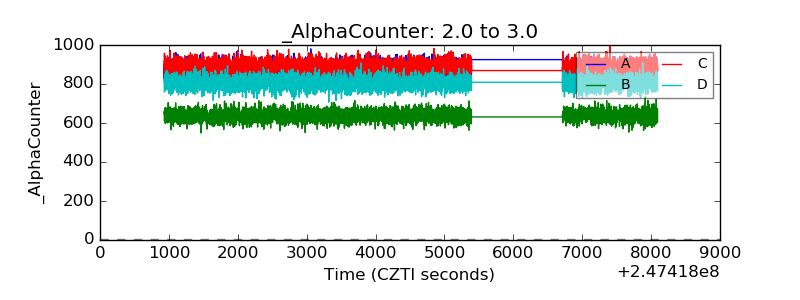 |
| _CPM_Rate | 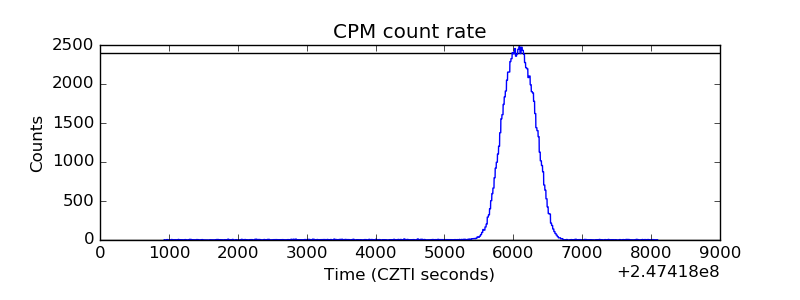 |
| CZT Counter | 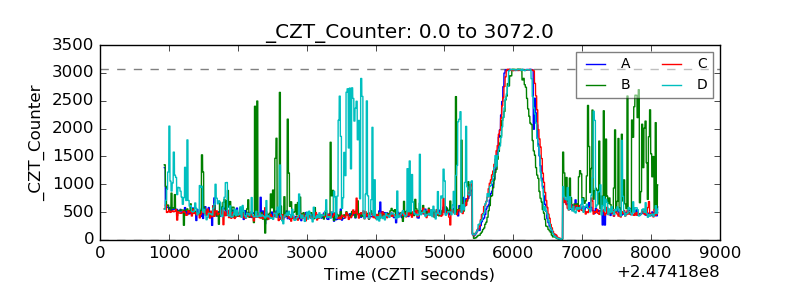 |
| +2.5 Volts monitor |  |
| +5 Volts monitor |  |
| _ROLL_ROT | 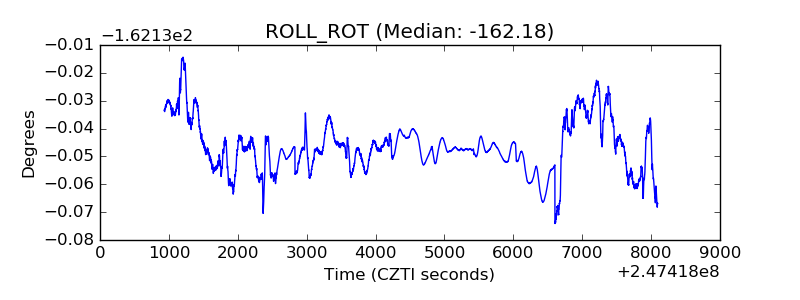 |
| _Roll_DEC | 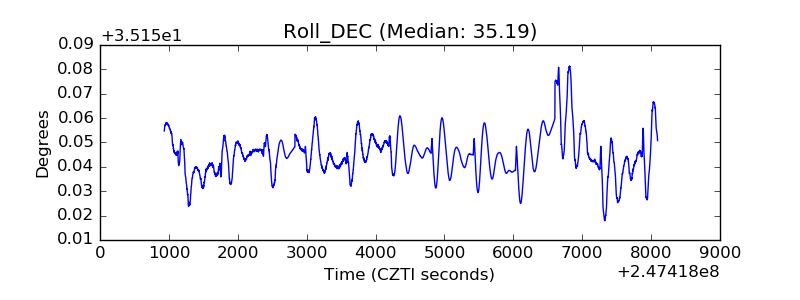 |
| _Roll_RA | 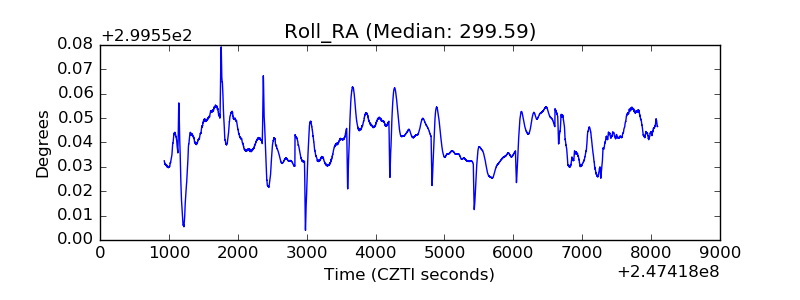 |
| Veto Counter | 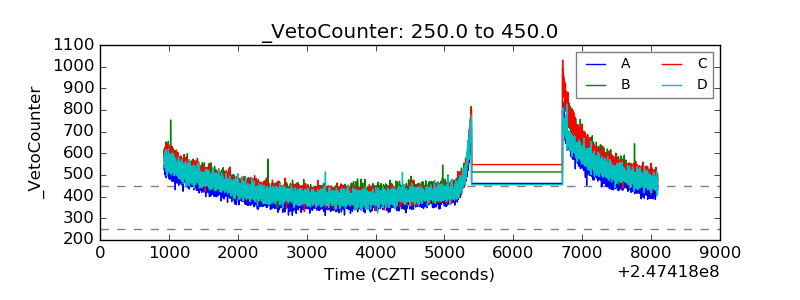 |