| Param | Original file | Final file |
|---|---|---|
| Filename | modeM0/AS1G08_062T01_9000001660_11362cztM0_level2.evt | modeM0/AS1G08_062T01_9000001660_11362cztM0_level2_quad_clean.evt |
| Size (bytes) | 583,758,720 | 85,504,320 |
| Size | 556.7 MB | 81.5 MB |
| Events in quadrant A | 3,475,068 | 566,805 |
| Events in quadrant B | 5,781,220 | 507,333 |
| Events in quadrant C | 2,876,550 | 569,842 |
| Events in quadrant D | 5,138,064 | 523,904 |
| Mode M0 | |||
|---|---|---|---|
| Quadrant | BADHDUFLAG | Total packets | Discarded packets |
| A | 0 | 14123 | 2 |
| B | 0 | 21167 | 1 |
| C | 0 | 12386 | 1 |
| D | 0 | 19297 | 1 |
| Mode SS | |||
|---|---|---|---|
| Quadrant | BADHDUFLAG | Total packets | Discarded packets |
| A | 0 | 122 | 0 |
| B | 0 | 122 | 0 |
| C | 0 | 122 | 0 |
| D | 0 | 122 | 0 |
| Mode M9 | |||
|---|---|---|---|
| Quadrant | BADHDUFLAG | Total packets | Discarded packets |
| A | 0 | 13 | 0 |
| B | 0 | 13 | 0 |
| C | 0 | 13 | 0 |
| D | 0 | 13 | 0 |
| Quadrant | Total seconds | Saturated seconds | Saturation percentage |
|---|---|---|---|
| A | 6028 | 62 | 1.028534% |
| B | 6028 | 1012 | 16.788321% |
| C | 6028 | 27 | 0.447910% |
| D | 6028 | 764 | 12.674187% |
Noise dominated data is calculated using 1-second bins in cleaned event files. If a bin has >2000 counts, and if more than 50% of those come from <1% of pixels, then it is considered to be noise-dominated and hence unusable.
| Quadrant | # 1 sec bins | Bins with >0 counts | Bins with >2000 counts | High rate bins dominated by noise | Noise dominated (total time) | Noise dominated (detector-on time) | Marked lightcurve |
|---|---|---|---|---|---|---|---|
| A | 7348 | 6029 | 7 | 7 | 0.10% | 0.12% | 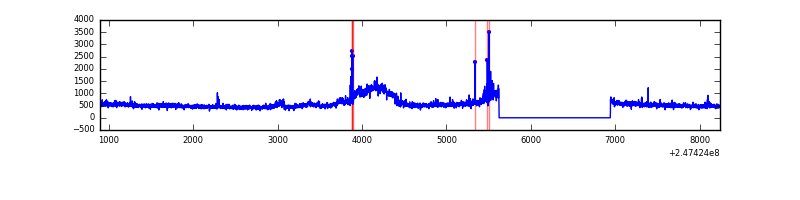 |
| B | 7348 | 6028 | 678 | 678 | 9.23% | 11.25% | 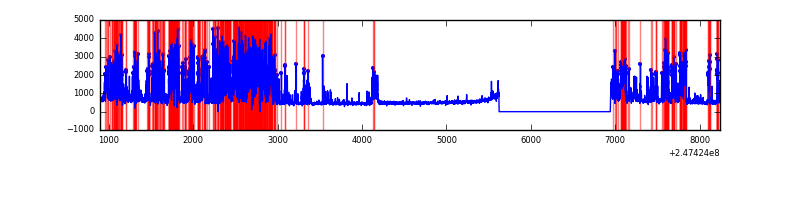 |
| C | 7348 | 6029 | 0 | 0 | 0.00% | 0.00% | 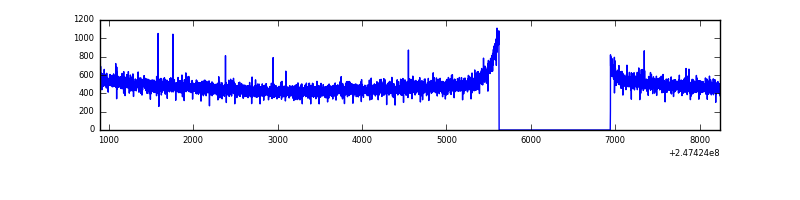 |
| D | 7348 | 6029 | 515 | 515 | 7.01% | 8.54% | 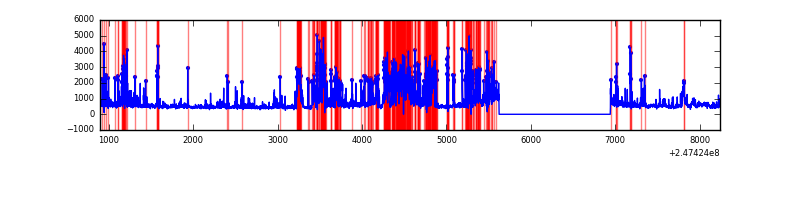 |
Top three noisy pixels from each quadrant. If the there are fewer than three noisy pixels in the level2.evt file, extra rows are filled as -1
| Pixel properties | Quadrant properties | ||||||
|---|---|---|---|---|---|---|---|
| Quadrant | DetID | PixID | Counts | Sigma | Mean | Median | Sigma |
| A | 15 | 174 | 407197 | 2695.93 | 742 | 727 | 150.8 |
| A | 13 | 251 | 154009 | 1016.65 | 742 | 727 | 150.8 |
| A | 1 | 162 | 12756 | 79.78 | 742 | 727 | 150.8 |
| B | 3 | 64 | 2109314 | 16189.9 | 700 | 685 | 130.2 |
| B | 4 | 239 | 811021 | 6221.7 | 700 | 685 | 130.2 |
| B | 15 | 204 | 49556 | 375.23 | 700 | 685 | 130.2 |
| C | 13 | 61 | 5415 | 27.41 | 737 | 742 | 170.5 |
| C | 8 | 222 | 3702 | 17.36 | 737 | 742 | 170.5 |
| C | 3 | 202 | 1810 | 6.27 | 737 | 742 | 170.5 |
| D | 1 | 52 | 1330150 | 8091.39 | 689 | 670 | 164.3 |
| D | 10 | 253 | 313333 | 1902.91 | 689 | 670 | 164.3 |
| D | 2 | 14 | 250835 | 1522.54 | 689 | 670 | 164.3 |
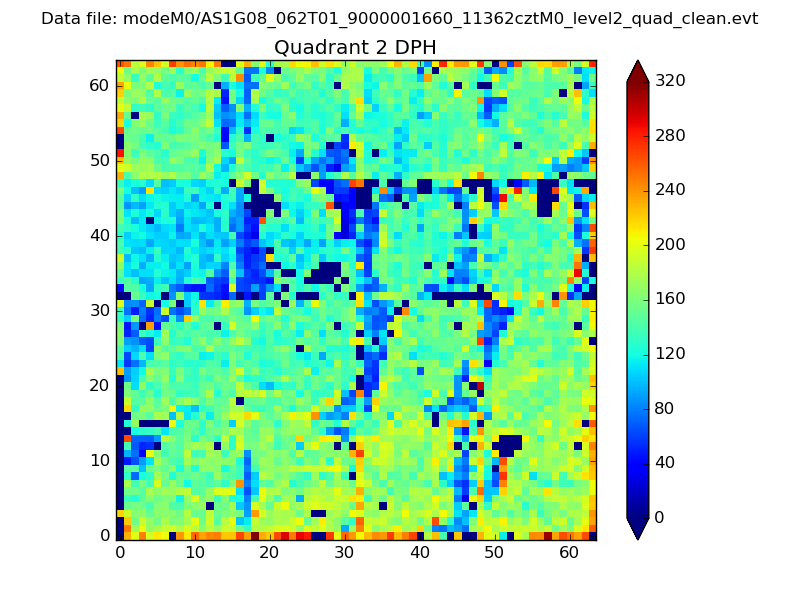
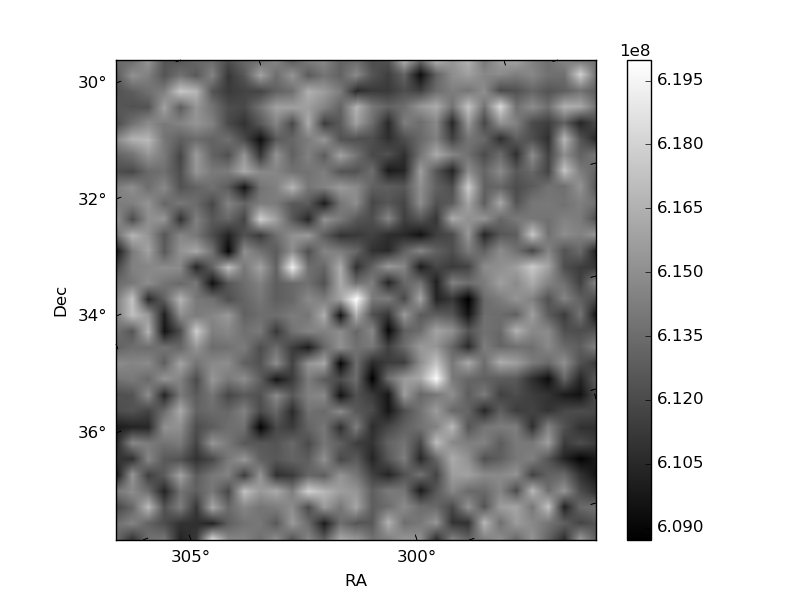
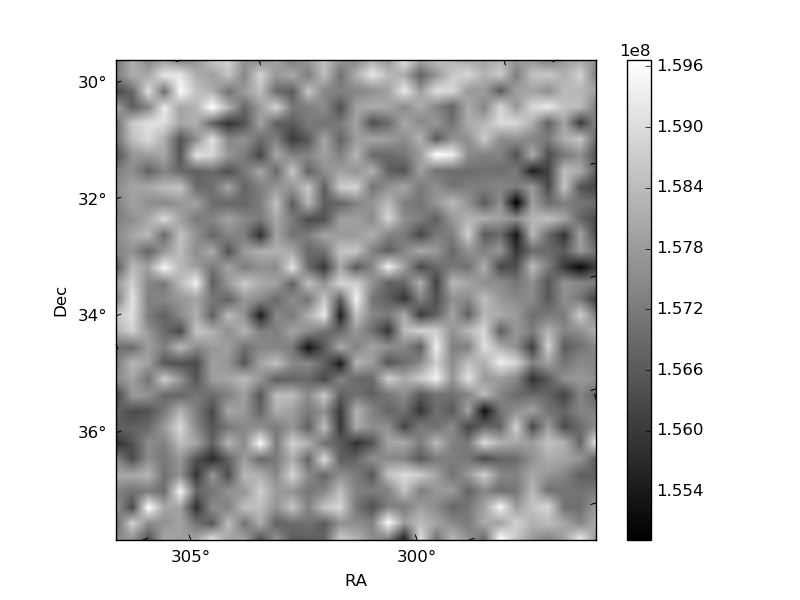
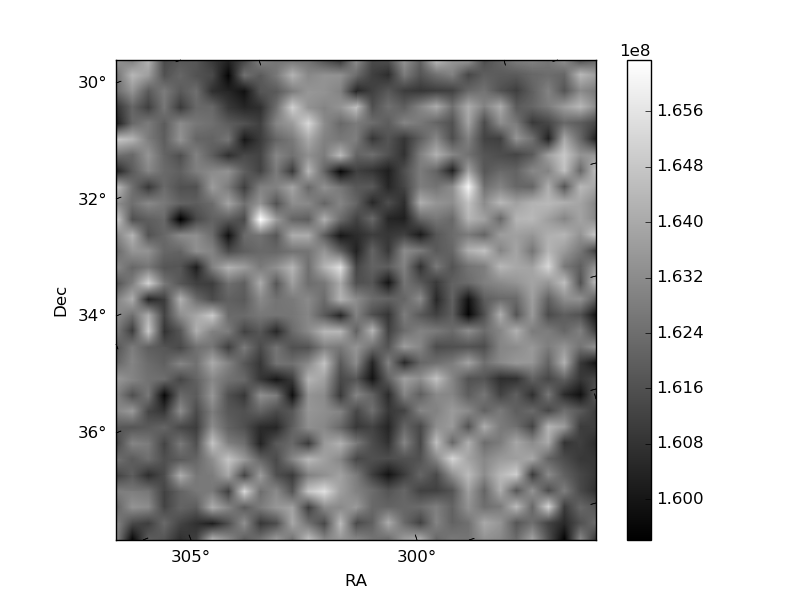
Histogram calculated using DETX and DETY for each event in the final _common_clean file
| Quadrant A | 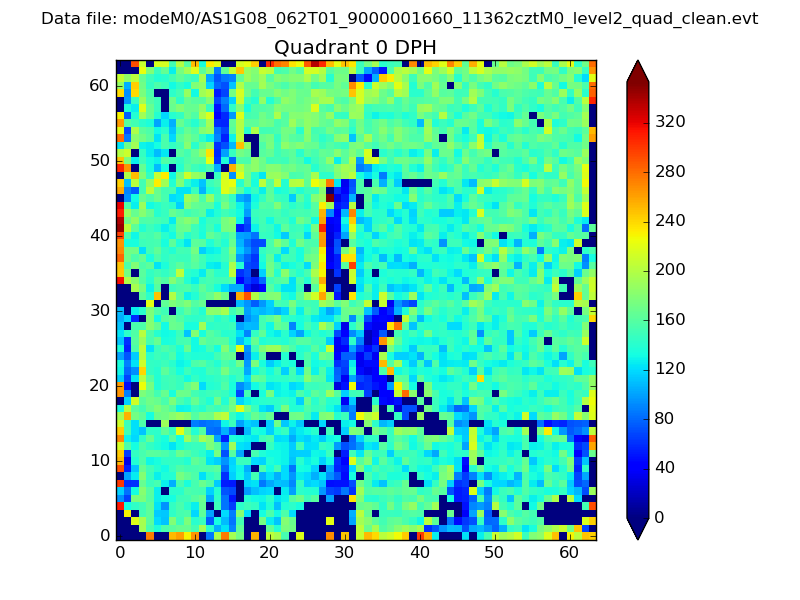 |
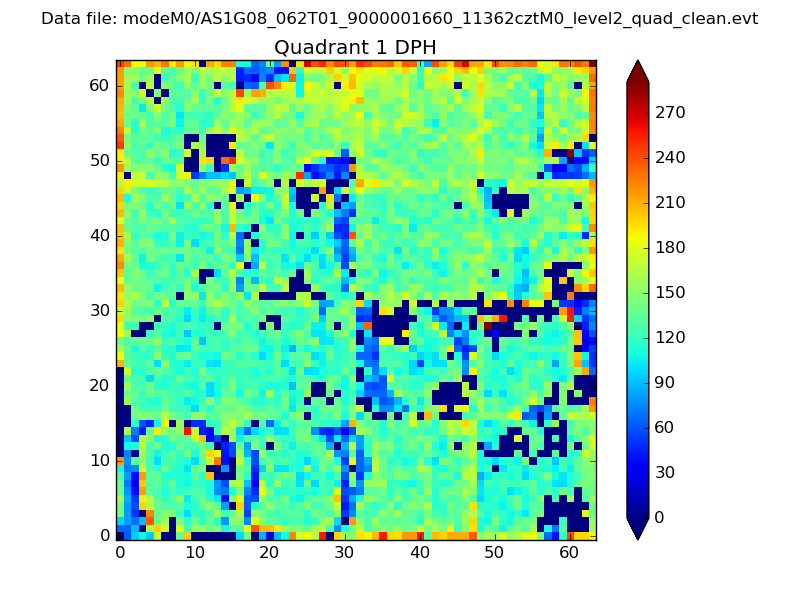 |
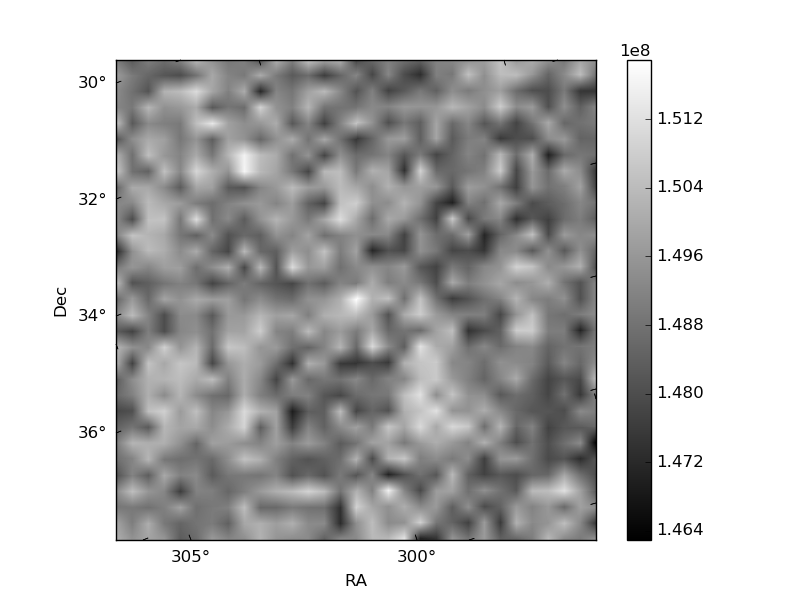
Quadrant B |
|---|---|---|---|
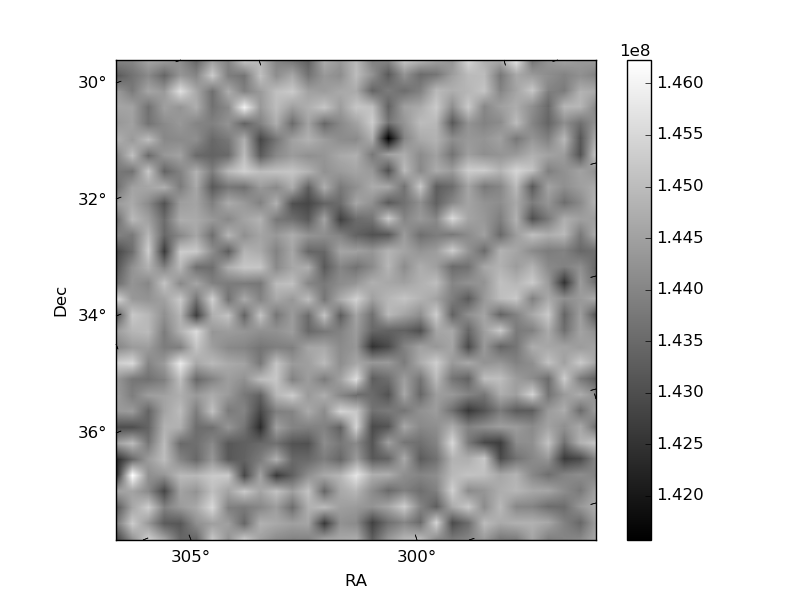
| Quadrant D | 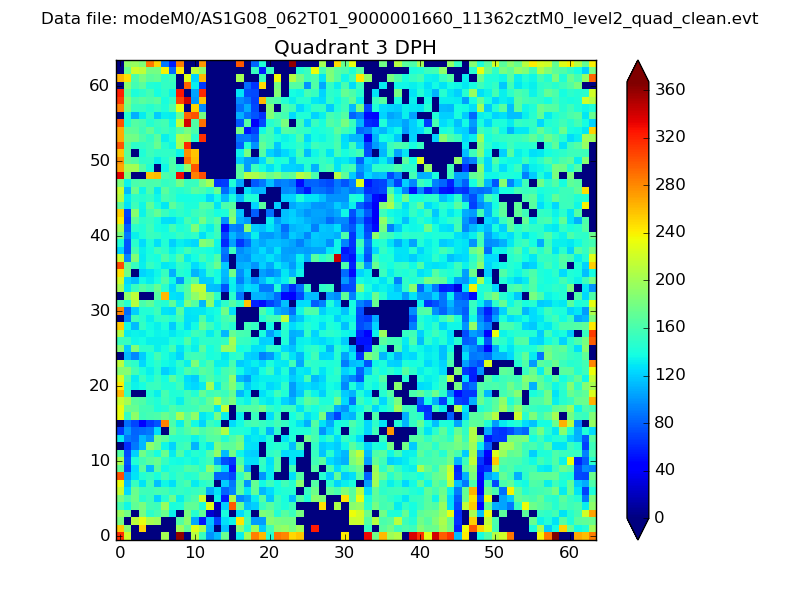 |
 |
Quadrant C |
| Plot type | Count rate plots | Images |
|---|---|---|
| Comparison with Poisson distribution Blue bars denote a histogram of data divided into 1 sec bins. Red curve is a Poisson curve with rate = median count rate of data. |
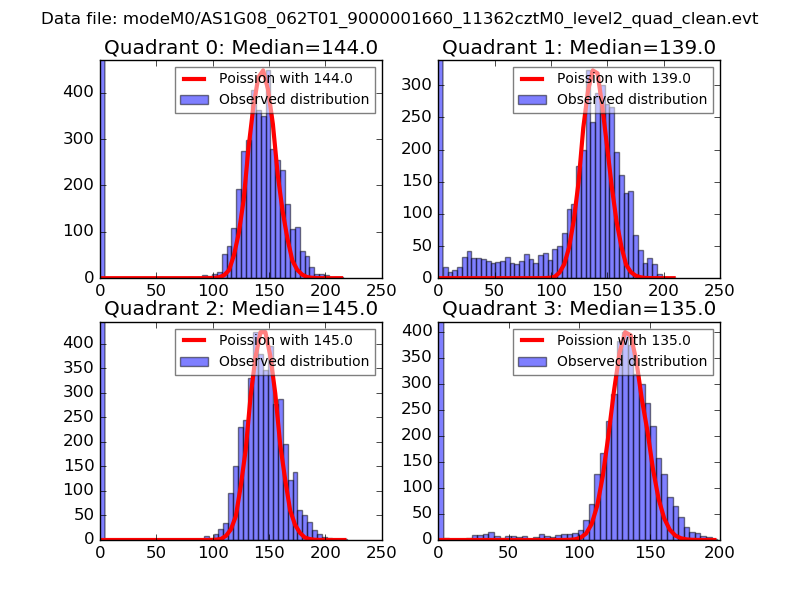 |
 |
| Quadrant-wise count rates Data is divided into 100 sec bins |
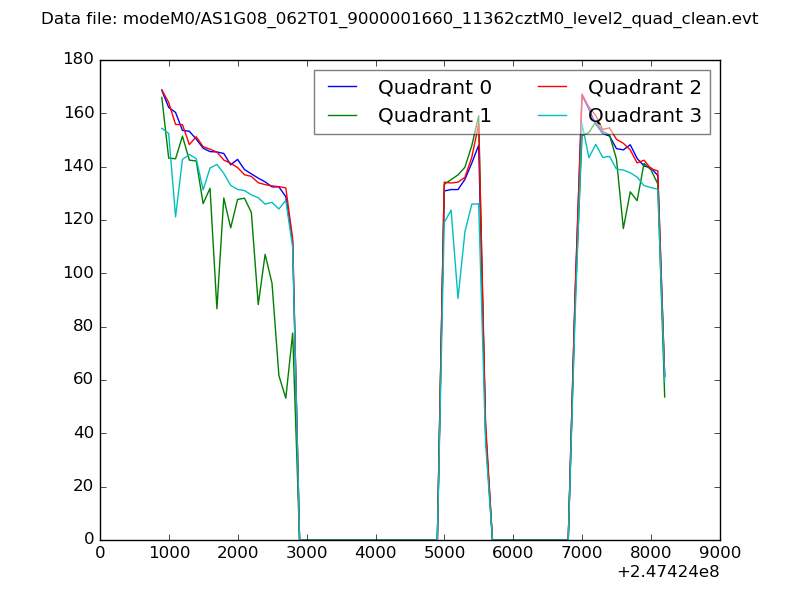 |
|
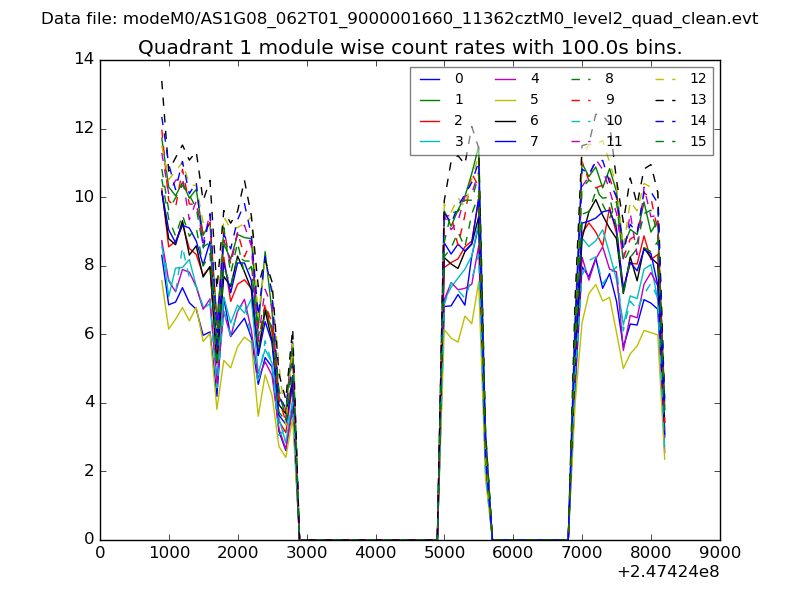
| Module-wise count rates for Quadrant A Data is divided into 100 sec bins |
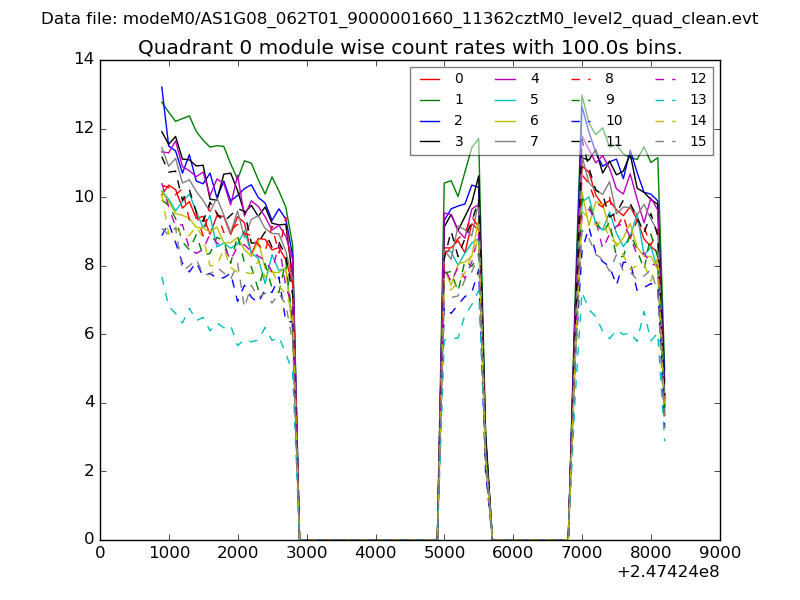 |
 |
| Module-wise count rates for Quadrant B Data is divided into 100 sec bins |
 |
 |
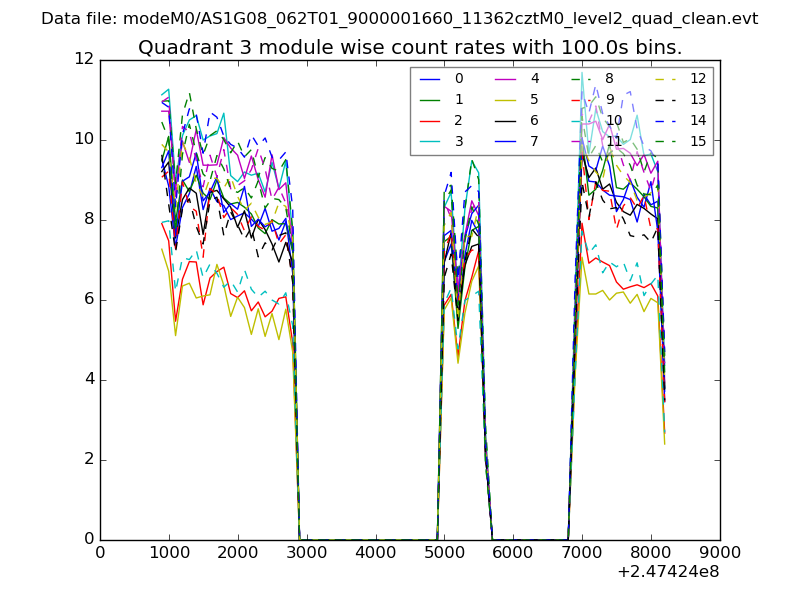
| Module-wise count rates for Quadrant C Data is divided into 100 sec bins |
 |
 |
| Module-wise count rates for Quadrant D Data is divided into 100 sec bins |
 |
 |
| Parameter | Plot |
|---|---|
| CZT HV Monitor | 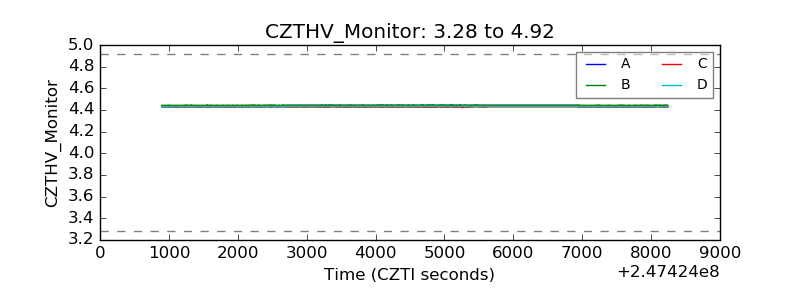 |
| D_VDD | 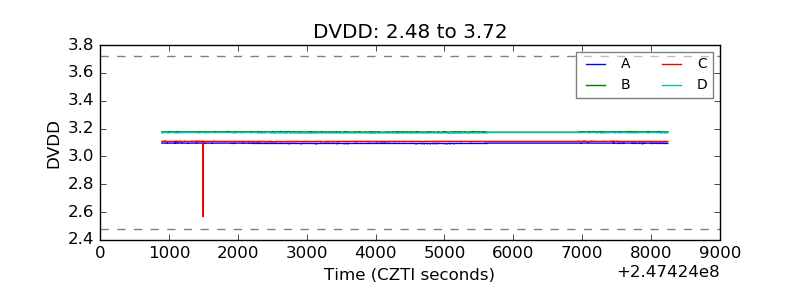 |
| Temperature 1 |  |
| Veto HV Monitor | 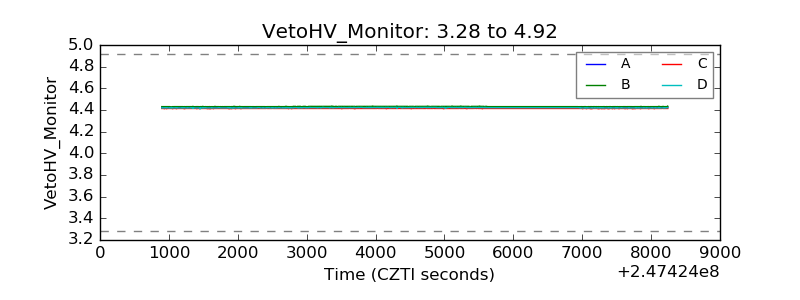 |
| Veto LLD | 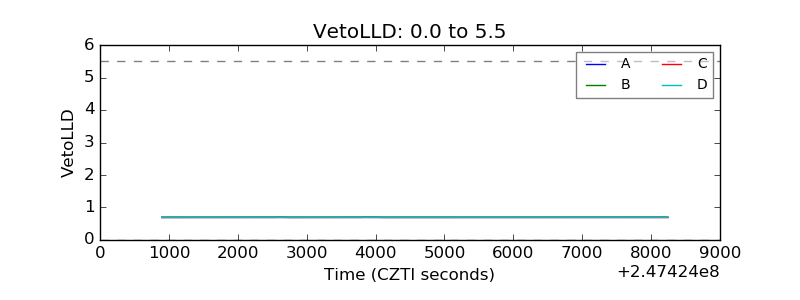 |
| Alpha Counter | 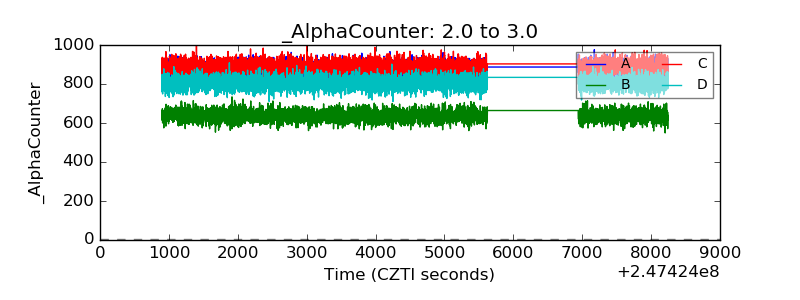 |
| _CPM_Rate | 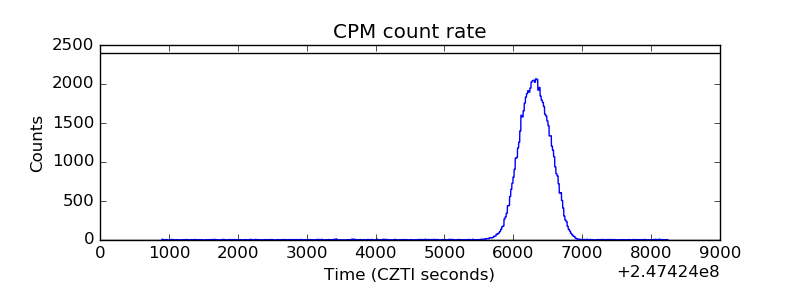 |
| CZT Counter | 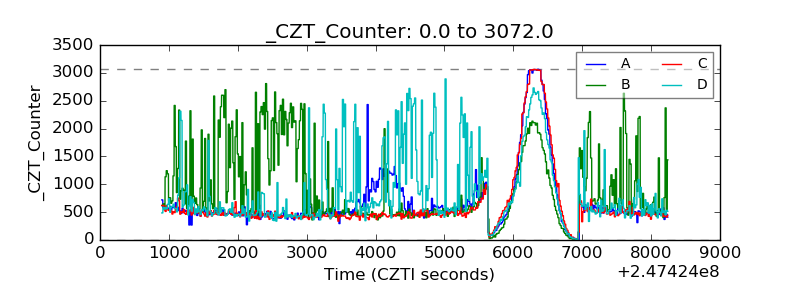 |
| +2.5 Volts monitor |  |
| +5 Volts monitor | 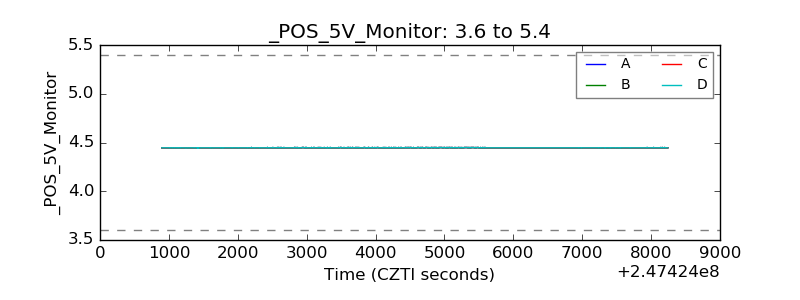 |
| _ROLL_ROT | 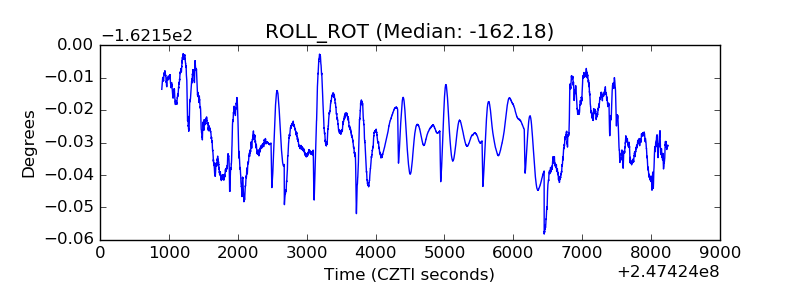 |
| _Roll_DEC | 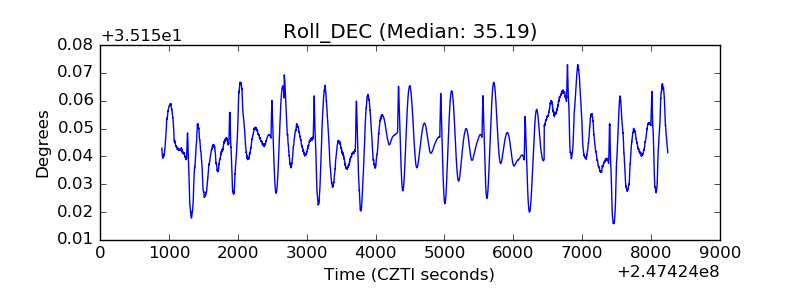 |
| _Roll_RA | 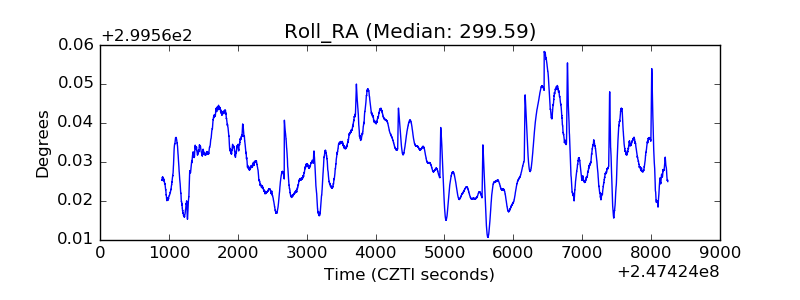 |
| Veto Counter | 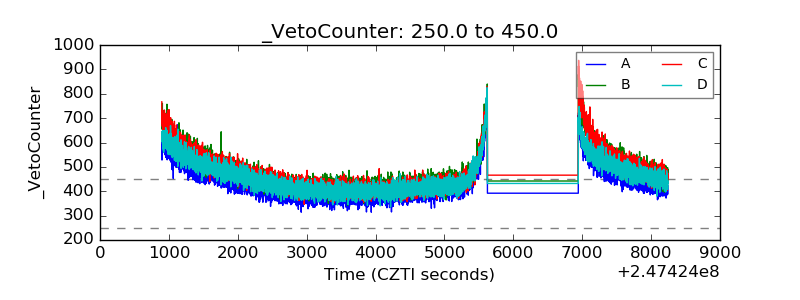 |