| Param | Original file | Final file |
|---|---|---|
| Filename | modeM0/AS1G08_062T01_9000001660_11363cztM0_level2.evt | modeM0/AS1G08_062T01_9000001660_11363cztM0_level2_quad_clean.evt |
| Size (bytes) | 482,725,440 | 88,096,320 |
| Size | 460.4 MB | 84.0 MB |
| Events in quadrant A | 3,167,642 | 569,384 |
| Events in quadrant B | 4,327,448 | 556,525 |
| Events in quadrant C | 2,896,460 | 573,451 |
| Events in quadrant D | 3,807,193 | 535,898 |
| Mode M0 | |||
|---|---|---|---|
| Quadrant | BADHDUFLAG | Total packets | Discarded packets |
| A | 0 | 13577 | 2 |
| B | 0 | 17019 | 1 |
| C | 0 | 12688 | 1 |
| D | 0 | 15493 | 1 |
| Mode SS | |||
|---|---|---|---|
| Quadrant | BADHDUFLAG | Total packets | Discarded packets |
| A | 0 | 124 | 0 |
| B | 0 | 124 | 0 |
| C | 0 | 124 | 0 |
| D | 0 | 124 | 0 |
| Mode M9 | |||
|---|---|---|---|
| Quadrant | BADHDUFLAG | Total packets | Discarded packets |
| A | 0 | 16 | 0 |
| B | 0 | 16 | 0 |
| C | 0 | 16 | 0 |
| D | 0 | 17 | 0 |
| Quadrant | Total seconds | Saturated seconds | Saturation percentage |
|---|---|---|---|
| A | 6202 | 38 | 0.612706% |
| B | 6202 | 359 | 5.788455% |
| C | 6202 | 7 | 0.112867% |
| D | 6202 | 166 | 2.676556% |
Noise dominated data is calculated using 1-second bins in cleaned event files. If a bin has >2000 counts, and if more than 50% of those come from <1% of pixels, then it is considered to be noise-dominated and hence unusable.
| Quadrant | # 1 sec bins | Bins with >0 counts | Bins with >2000 counts | High rate bins dominated by noise | Noise dominated (total time) | Noise dominated (detector-on time) | Marked lightcurve |
|---|---|---|---|---|---|---|---|
| A | 7507 | 6203 | 0 | 0 | 0.00% | 0.00% | 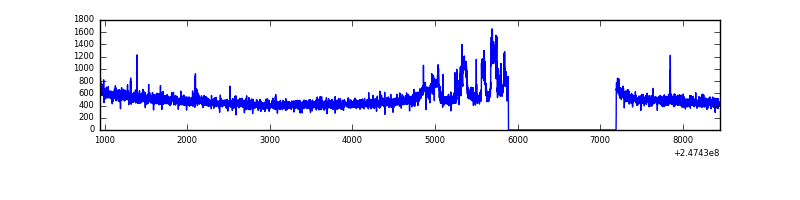 |
| B | 7507 | 6203 | 227 | 227 | 3.02% | 3.66% |  |
| C | 7507 | 6203 | 0 | 0 | 0.00% | 0.00% | 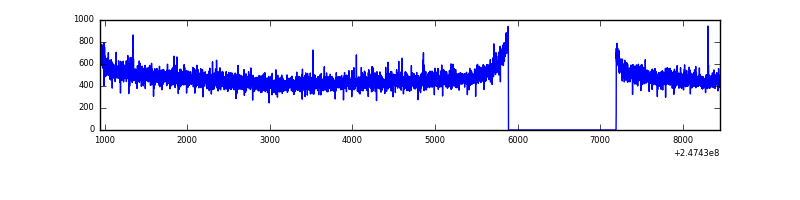 |
| D | 7507 | 6203 | 122 | 122 | 1.63% | 1.97% | 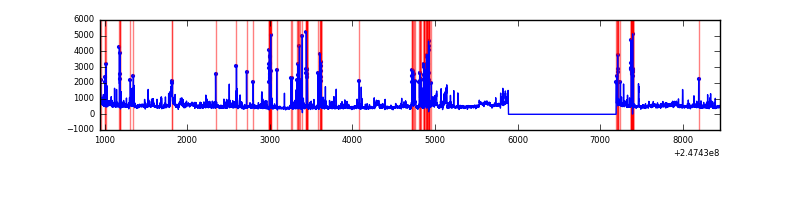 |
Top three noisy pixels from each quadrant. If the there are fewer than three noisy pixels in the level2.evt file, extra rows are filled as -1
| Pixel properties | Quadrant properties | ||||||
|---|---|---|---|---|---|---|---|
| Quadrant | DetID | PixID | Counts | Sigma | Mean | Median | Sigma |
| A | 15 | 174 | 226061 | 1488.48 | 749 | 733 | 151.4 |
| A | 1 | 162 | 15368 | 96.68 | 749 | 733 | 151.4 |
| A | 8 | 15 | 10606 | 65.22 | 749 | 733 | 151.4 |
| B | 4 | 239 | 1015232 | 7319.99 | 742 | 725 | 138.6 |
| B | 3 | 64 | 295059 | 2123.71 | 742 | 725 | 138.6 |
| B | 15 | 204 | 43317 | 307.31 | 742 | 725 | 138.6 |
| C | 13 | 61 | 5364 | 27.04 | 741 | 746 | 170.8 |
| C | 14 | 67 | 3302 | 14.97 | 741 | 746 | 170.8 |
| C | 12 | 4 | 2767 | 11.83 | 741 | 746 | 170.8 |
| D | 10 | 253 | 257160 | 1492.19 | 721 | 704 | 171.9 |
| D | 2 | 14 | 244307 | 1417.4 | 721 | 704 | 171.9 |
| D | 2 | 120 | 201097 | 1165.99 | 721 | 704 | 171.9 |
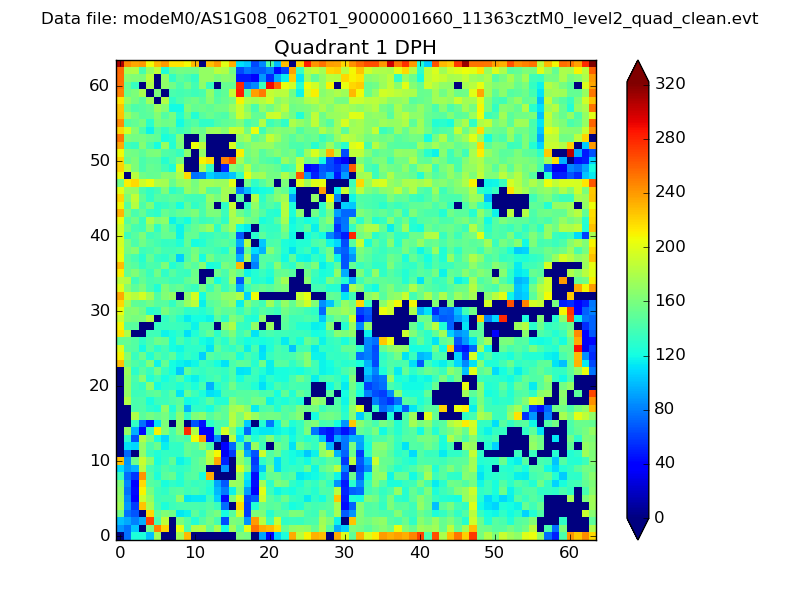
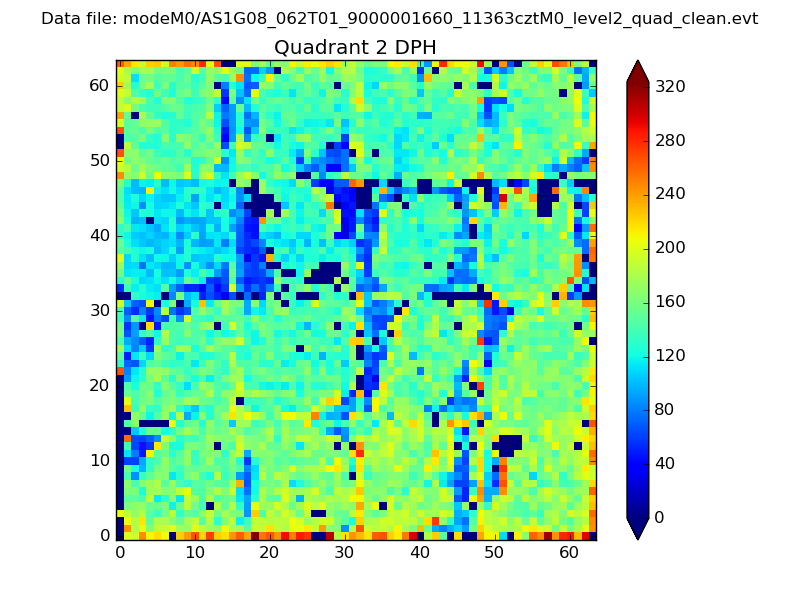
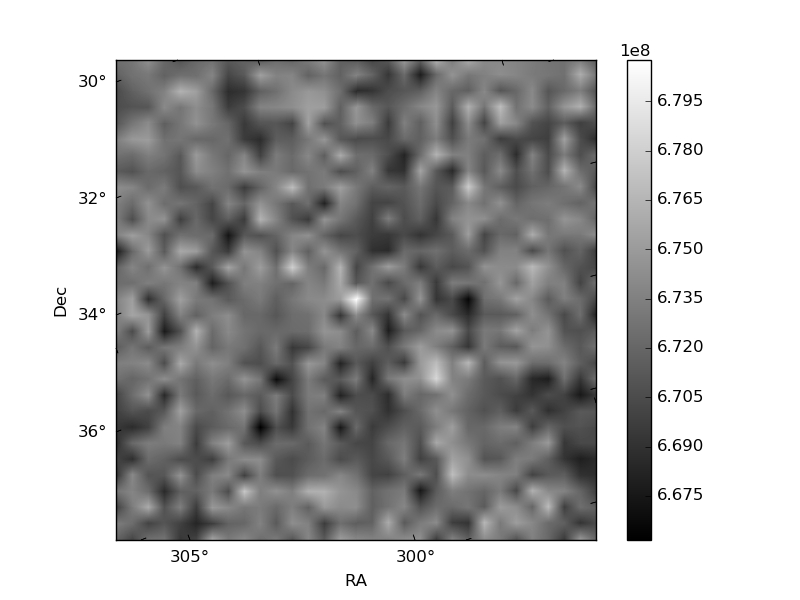
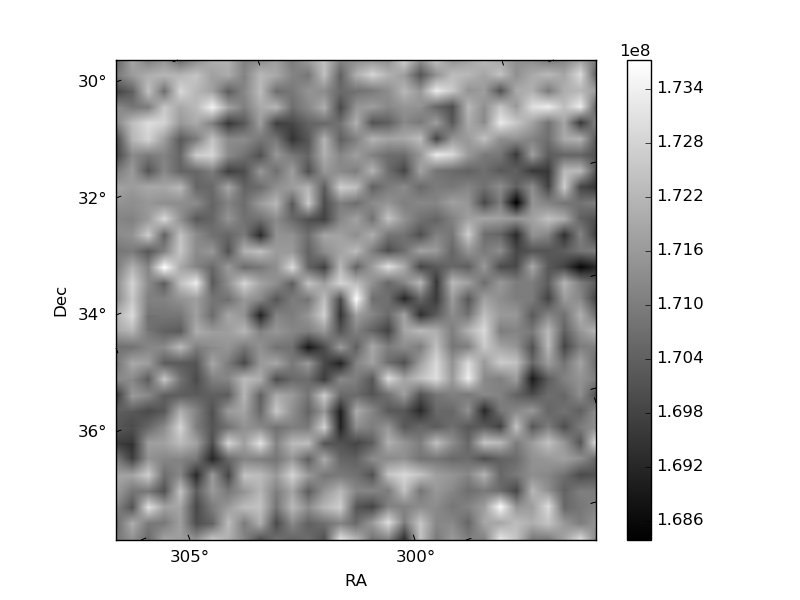
Histogram calculated using DETX and DETY for each event in the final _common_clean file
| Quadrant A | 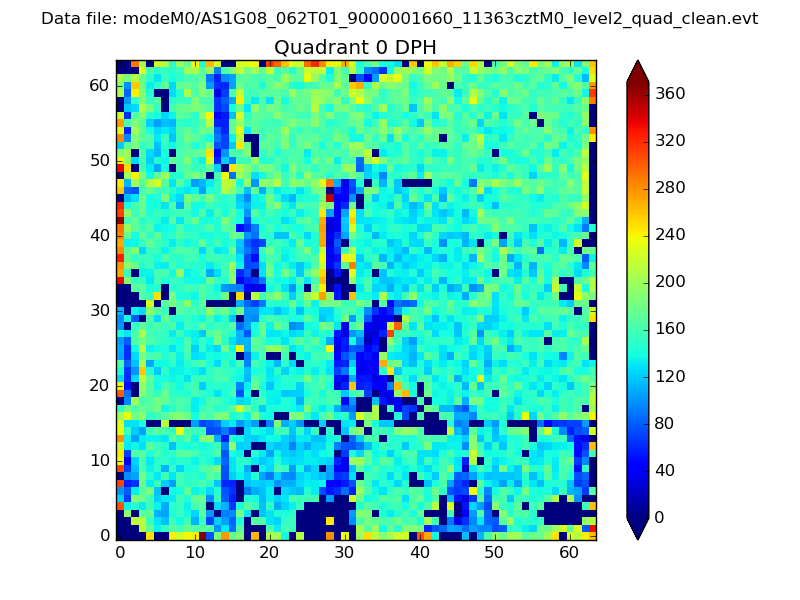 |
 |
Quadrant B |
|---|---|---|---|
| Quadrant D | 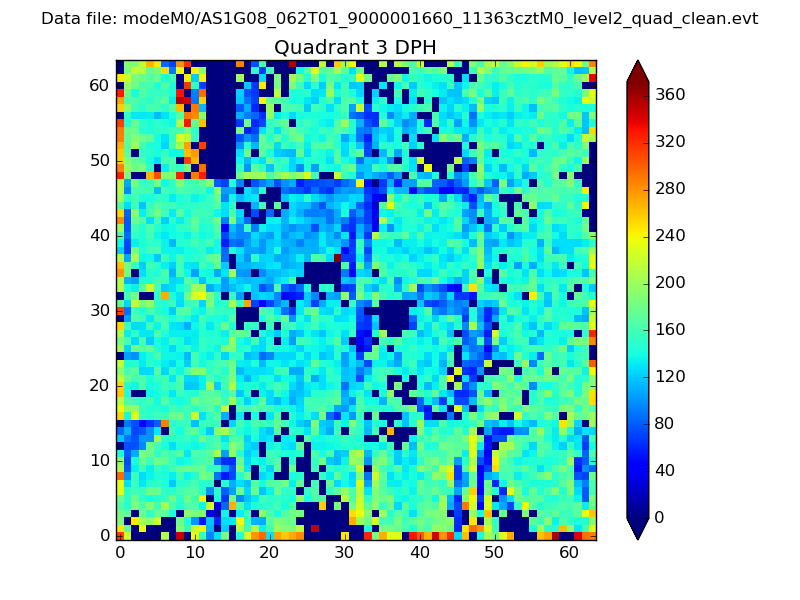 |
 |
Quadrant C |
| Plot type | Count rate plots | Images |
|---|---|---|
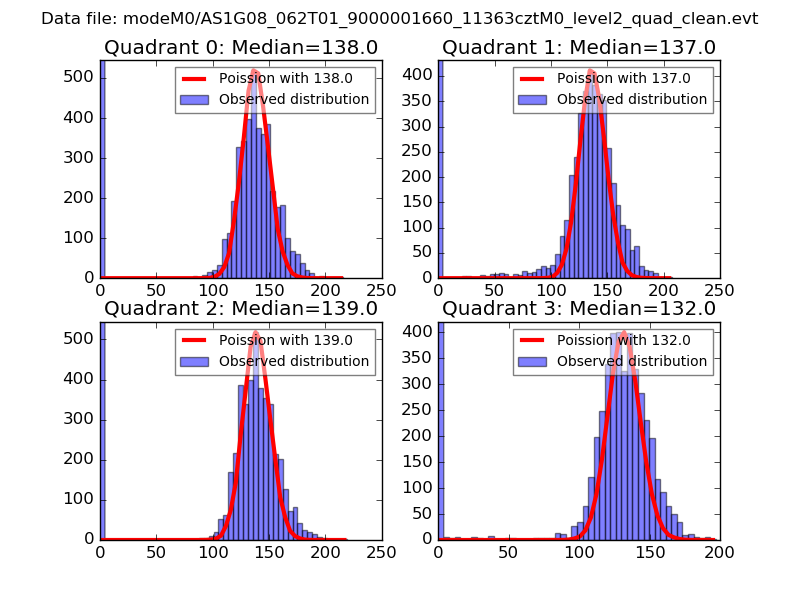
| Comparison with Poisson distribution Blue bars denote a histogram of data divided into 1 sec bins. Red curve is a Poisson curve with rate = median count rate of data. |
 |
 |
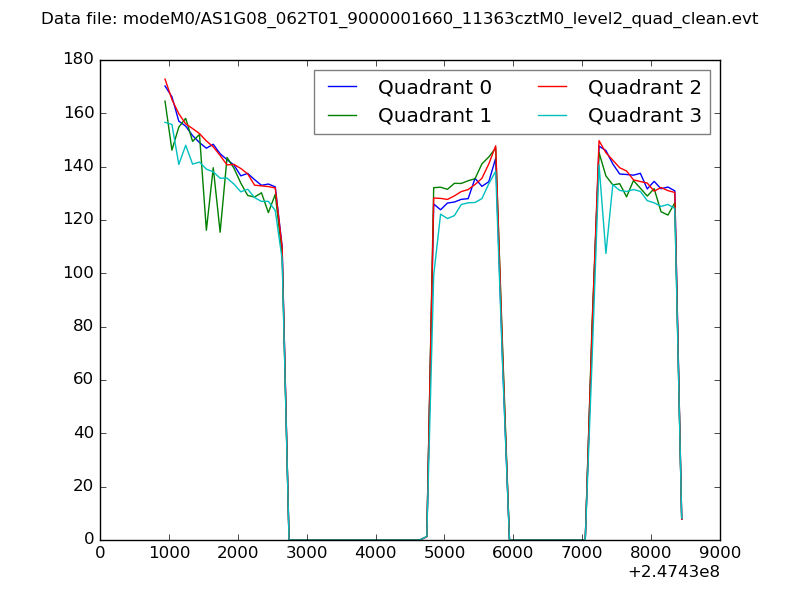
| Quadrant-wise count rates Data is divided into 100 sec bins |
 |
|
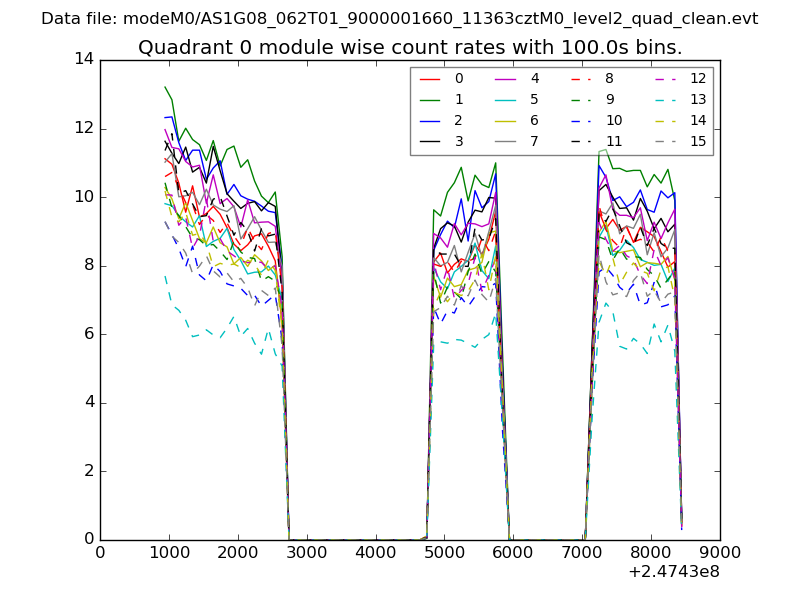
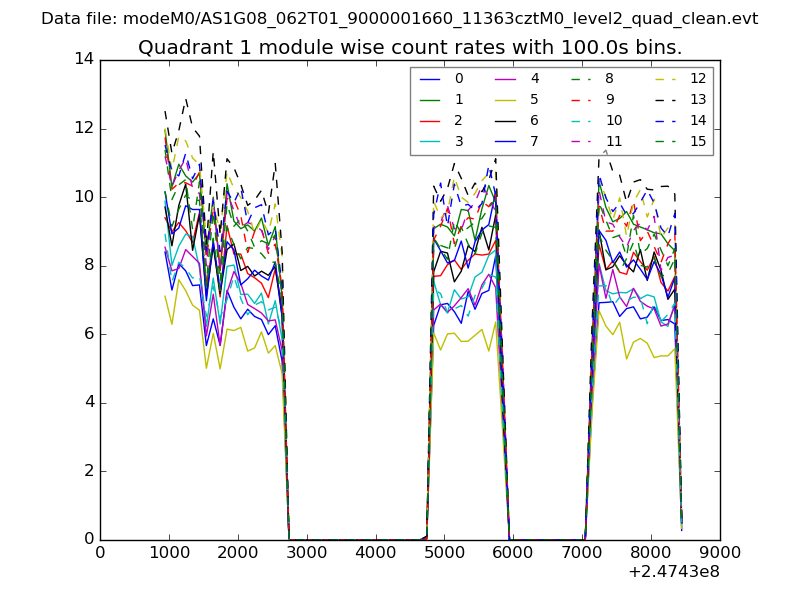
| Module-wise count rates for Quadrant A Data is divided into 100 sec bins |
 |
 |
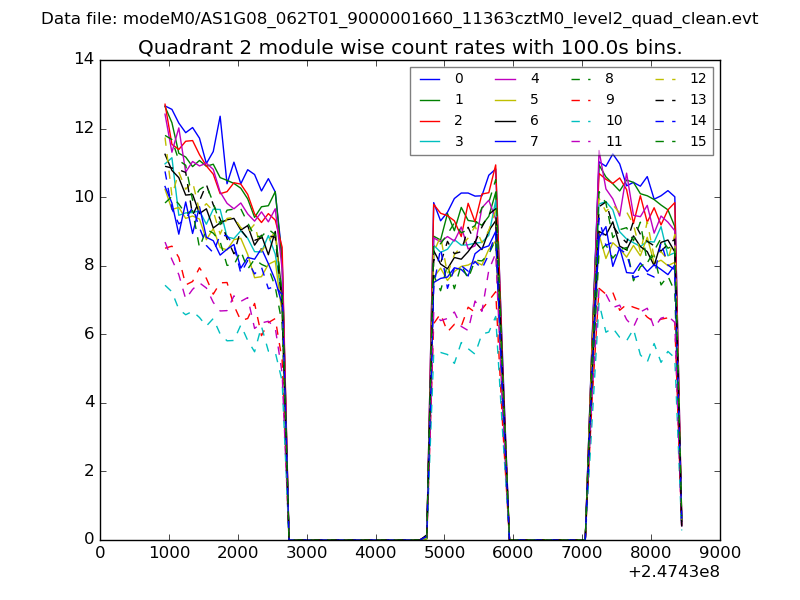
| Module-wise count rates for Quadrant B Data is divided into 100 sec bins |
 |
 |
| Module-wise count rates for Quadrant C Data is divided into 100 sec bins |
 |
 |
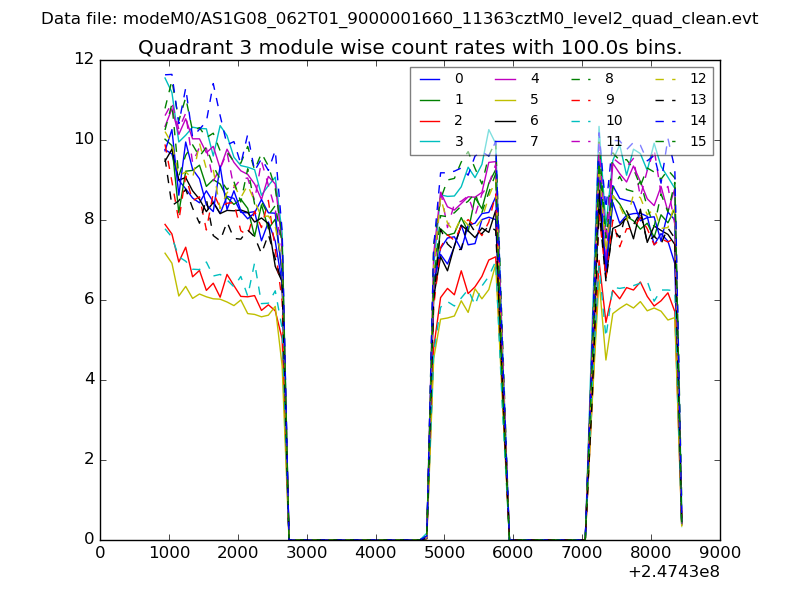
| Module-wise count rates for Quadrant D Data is divided into 100 sec bins |
 |
 |
| Parameter | Plot |
|---|---|
| CZT HV Monitor | 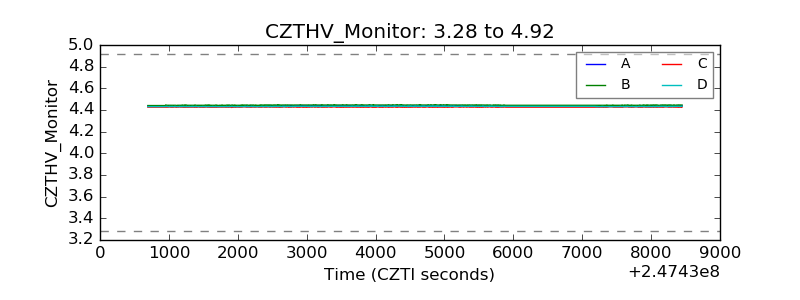 |
| D_VDD | 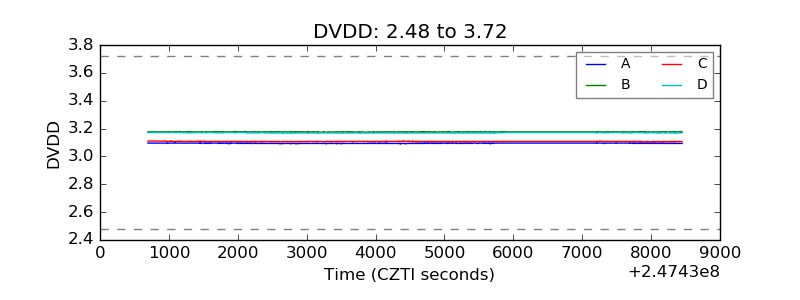 |
| Temperature 1 | 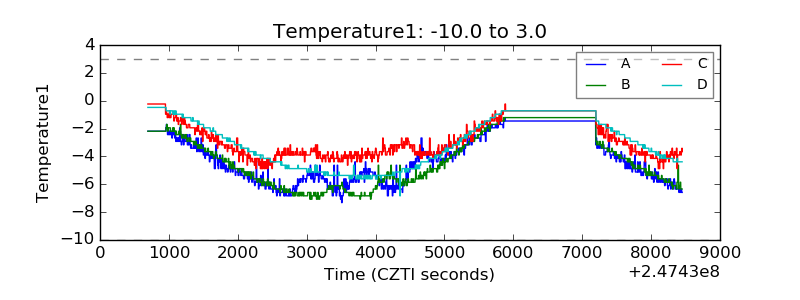 |
| Veto HV Monitor | 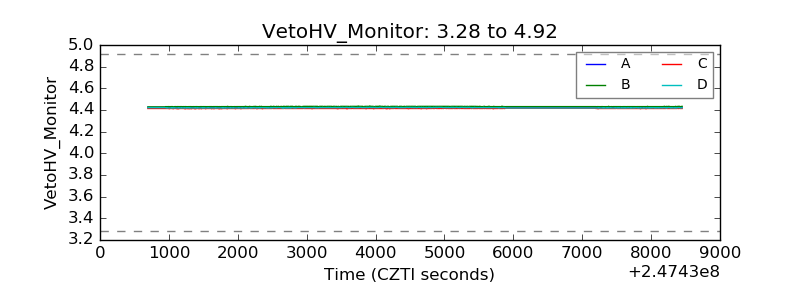 |
| Veto LLD | 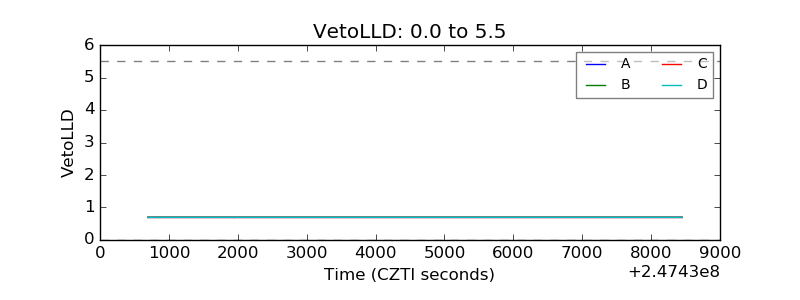 |
| Alpha Counter | 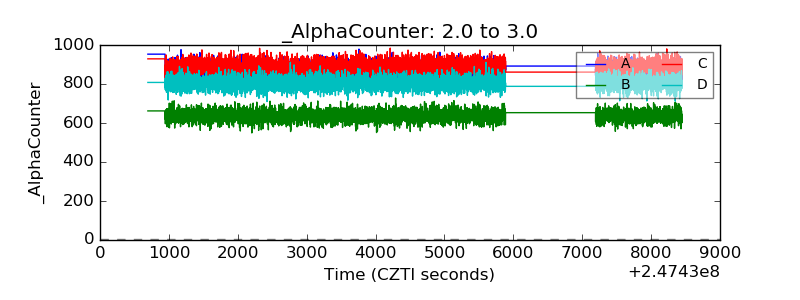 |
| _CPM_Rate | 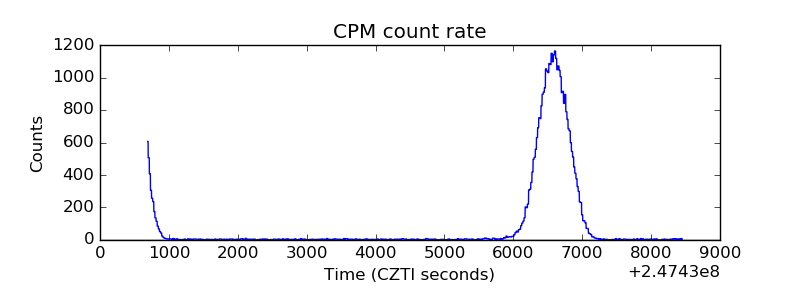 |
| CZT Counter | 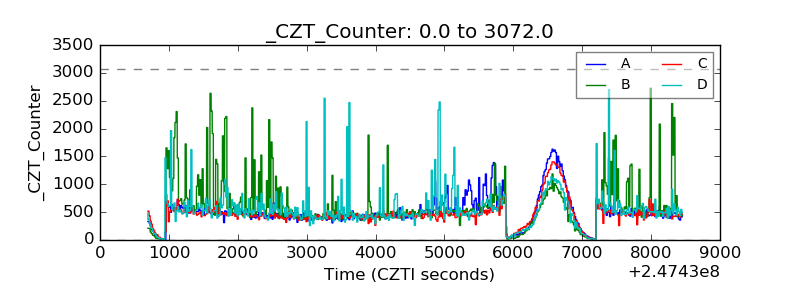 |
| +2.5 Volts monitor | 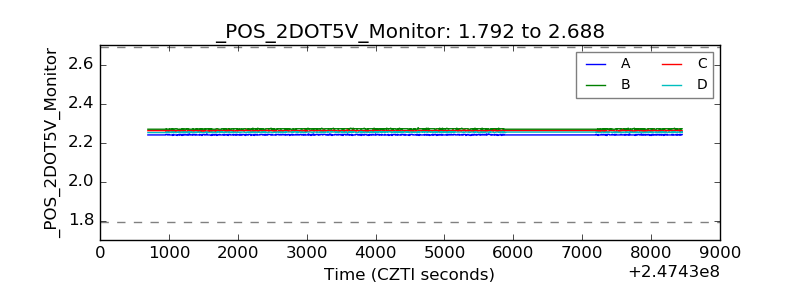 |
| +5 Volts monitor |  |
| _ROLL_ROT | 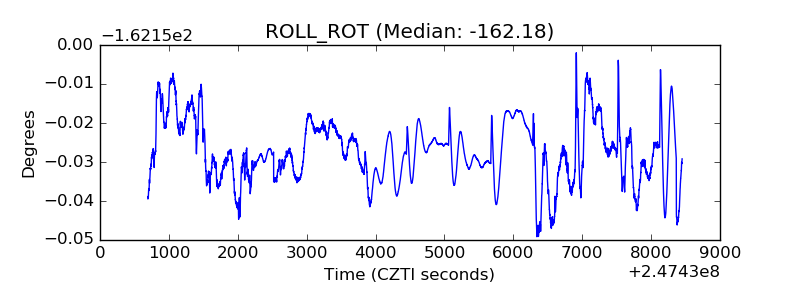 |
| _Roll_DEC |  |
| _Roll_RA | 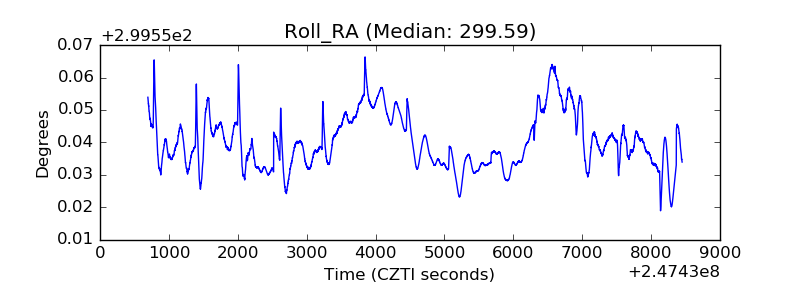 |
| Veto Counter | 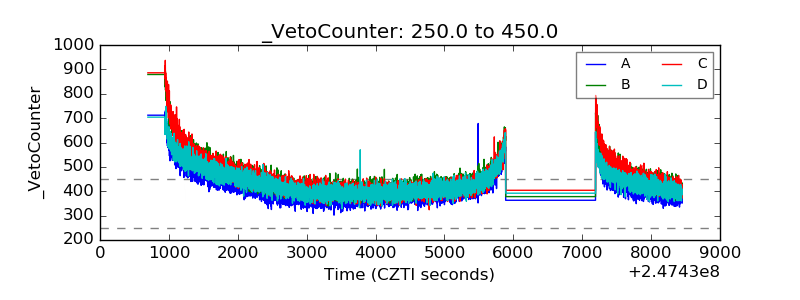 |