| Param | Original file | Final file |
|---|---|---|
| Filename | modeM0/AS1G08_062T01_9000001660_11364cztM0_level2.evt | modeM0/AS1G08_062T01_9000001660_11364cztM0_level2_quad_clean.evt |
| Size (bytes) | 505,722,240 | 85,400,640 |
| Size | 482.3 MB | 81.4 MB |
| Events in quadrant A | 3,082,115 | 543,960 |
| Events in quadrant B | 4,417,802 | 529,383 |
| Events in quadrant C | 2,981,819 | 545,951 |
| Events in quadrant D | 4,388,633 | 509,293 |
| Mode M0 | |||
|---|---|---|---|
| Quadrant | BADHDUFLAG | Total packets | Discarded packets |
| A | 0 | 13590 | 2 |
| B | 0 | 17531 | 1 |
| C | 0 | 13385 | 1 |
| D | 0 | 17608 | 1 |
| Mode SS | |||
|---|---|---|---|
| Quadrant | BADHDUFLAG | Total packets | Discarded packets |
| A | 0 | 132 | 0 |
| B | 0 | 132 | 0 |
| C | 0 | 132 | 0 |
| D | 0 | 132 | 0 |
| Mode M9 | |||
|---|---|---|---|
| Quadrant | BADHDUFLAG | Total packets | Discarded packets |
| A | 0 | 18 | 0 |
| B | 0 | 18 | 0 |
| C | 0 | 18 | 0 |
| D | 0 | 19 | 0 |
| Quadrant | Total seconds | Saturated seconds | Saturation percentage |
|---|---|---|---|
| A | 6565 | 28 | 0.426504% |
| B | 6565 | 333 | 5.072353% |
| C | 6565 | 18 | 0.274181% |
| D | 6565 | 353 | 5.376999% |
Noise dominated data is calculated using 1-second bins in cleaned event files. If a bin has >2000 counts, and if more than 50% of those come from <1% of pixels, then it is considered to be noise-dominated and hence unusable.
| Quadrant | # 1 sec bins | Bins with >0 counts | Bins with >2000 counts | High rate bins dominated by noise | Noise dominated (total time) | Noise dominated (detector-on time) | Marked lightcurve |
|---|---|---|---|---|---|---|---|
| A | 7580 | 6566 | 0 | 0 | 0.00% | 0.00% | 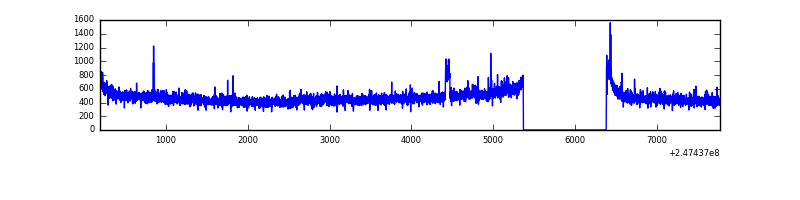 |
| B | 7580 | 6566 | 163 | 163 | 2.15% | 2.48% | 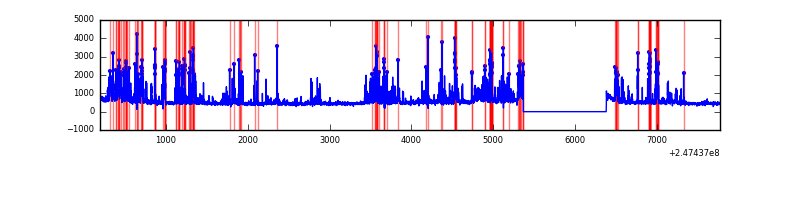 |
| C | 7580 | 6566 | 0 | 0 | 0.00% | 0.00% | 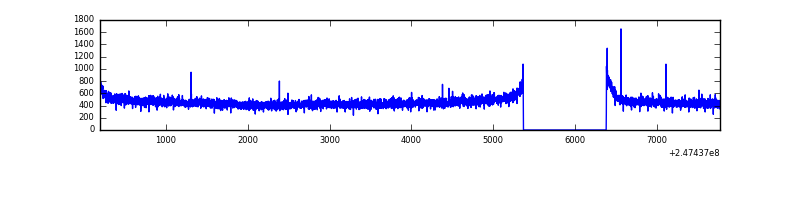 |
| D | 7580 | 6565 | 287 | 287 | 3.79% | 4.37% | 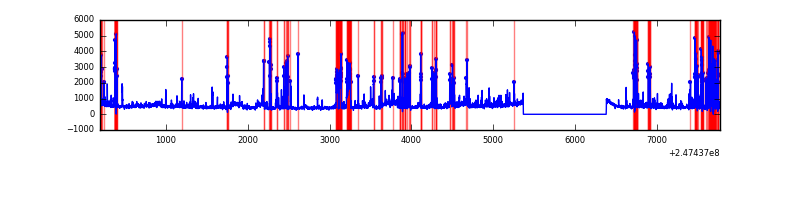 |
Top three noisy pixels from each quadrant. If the there are fewer than three noisy pixels in the level2.evt file, extra rows are filled as -1
| Pixel properties | Quadrant properties | ||||||
|---|---|---|---|---|---|---|---|
| Quadrant | DetID | PixID | Counts | Sigma | Mean | Median | Sigma |
| A | 15 | 174 | 43934 | 272.59 | 774 | 758 | 158.4 |
| A | 1 | 162 | 16120 | 96.99 | 774 | 758 | 158.4 |
| A | 8 | 5 | 12384 | 73.4 | 774 | 758 | 158.4 |
| B | 4 | 239 | 933659 | 6456.52 | 766 | 747 | 144.5 |
| B | 3 | 64 | 376426 | 2600.01 | 766 | 747 | 144.5 |
| B | 15 | 204 | 29525 | 199.17 | 766 | 747 | 144.5 |
| C | 13 | 61 | 5598 | 27.47 | 762 | 768 | 175.9 |
| C | 14 | 67 | 3961 | 18.16 | 762 | 768 | 175.9 |
| C | 14 | 234 | 3446 | 15.23 | 762 | 768 | 175.9 |
| D | 10 | 253 | 672602 | 3795.29 | 734 | 713 | 177.0 |
| D | 2 | 14 | 338949 | 1910.59 | 734 | 713 | 177.0 |
| D | 2 | 120 | 196169 | 1104.07 | 734 | 713 | 177.0 |
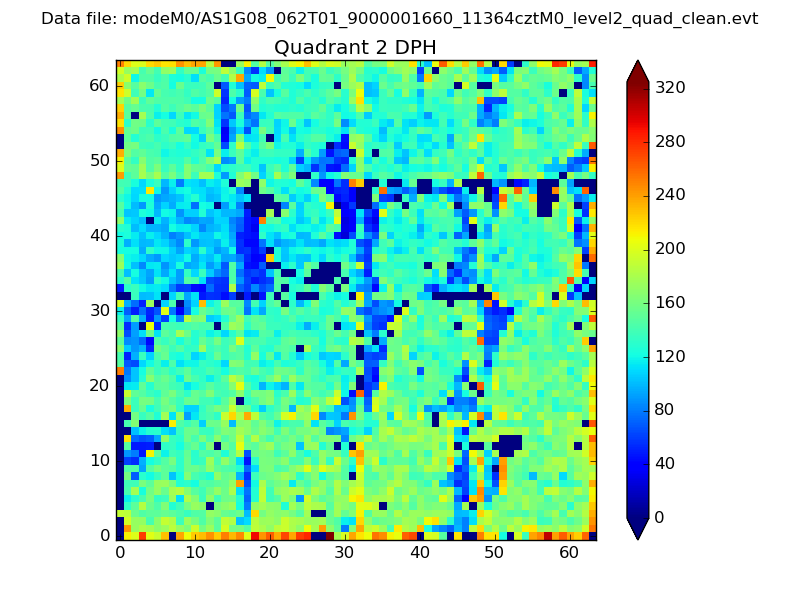
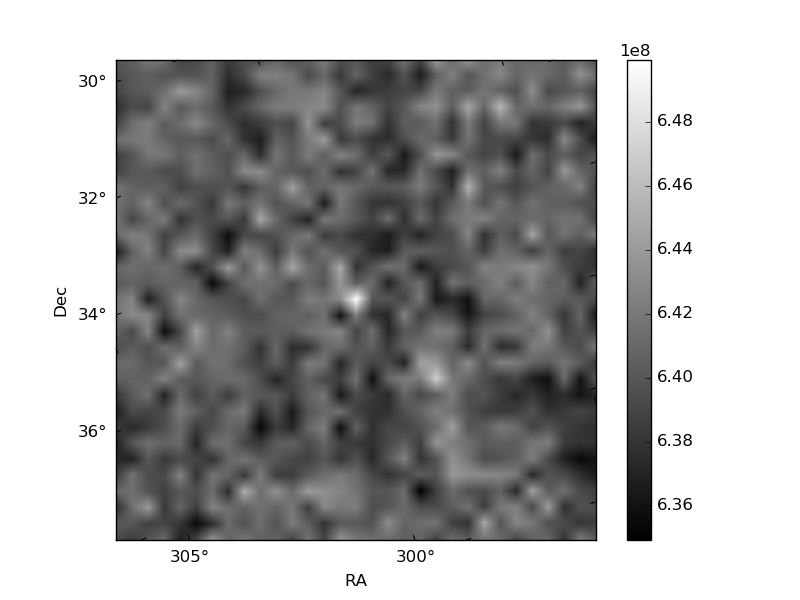
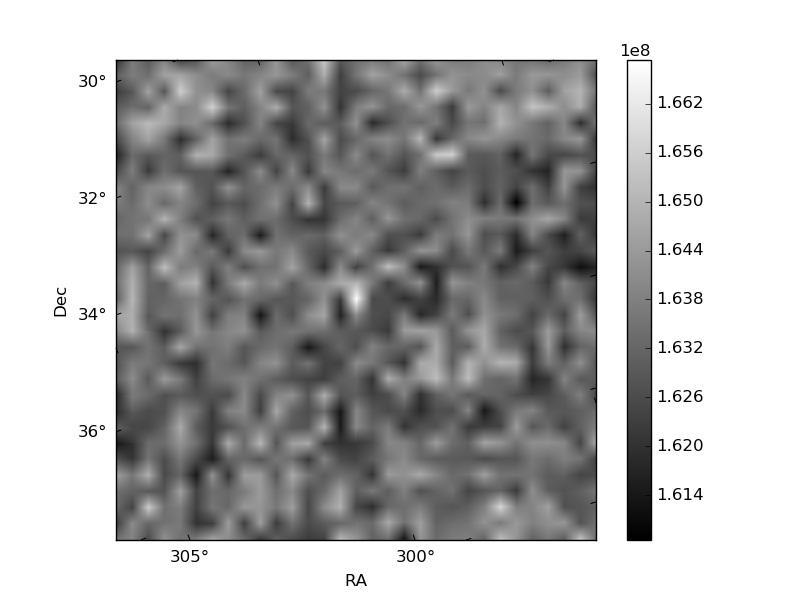
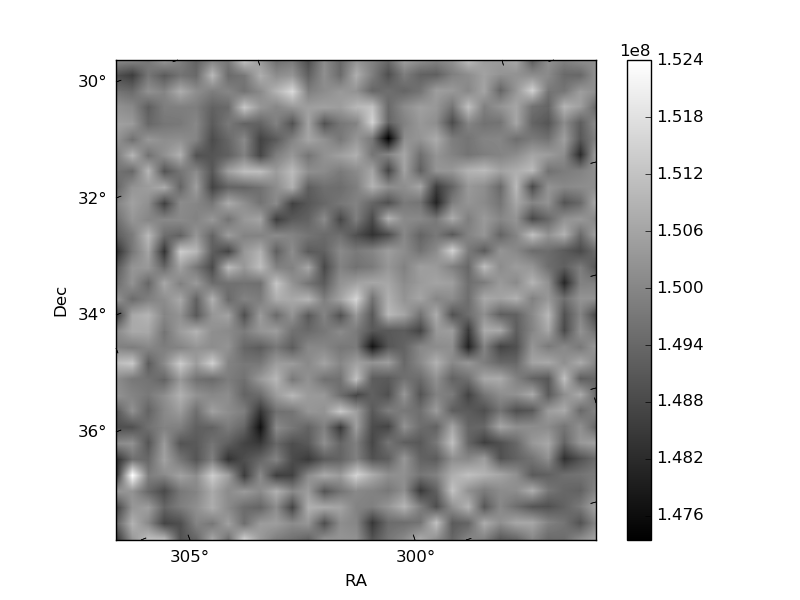
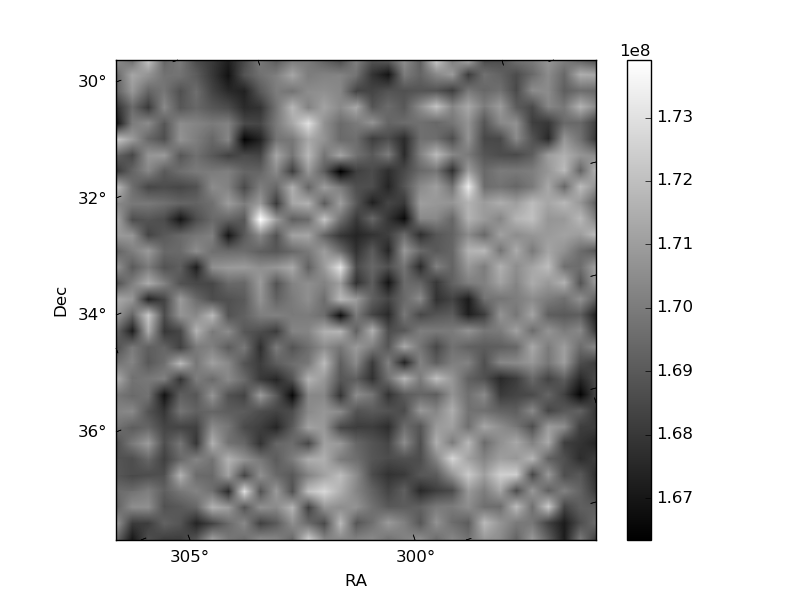
Histogram calculated using DETX and DETY for each event in the final _common_clean file
| Quadrant A | 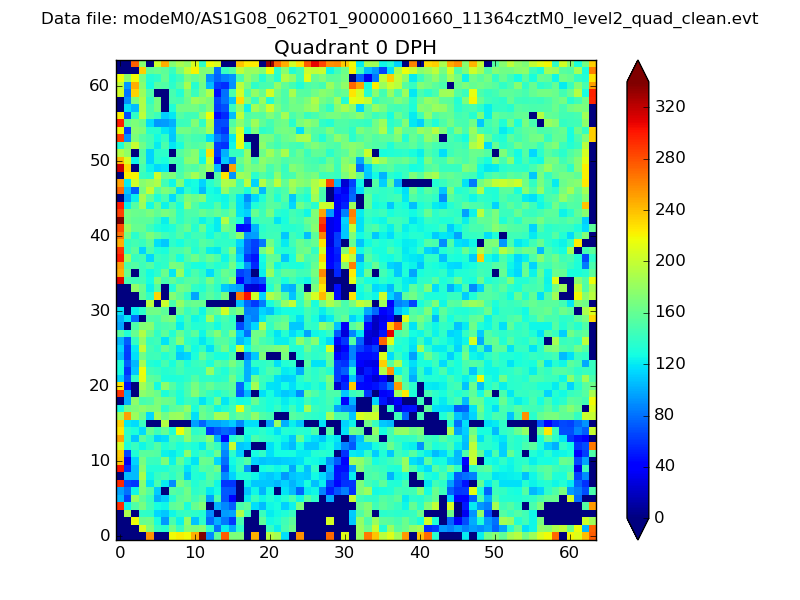 |
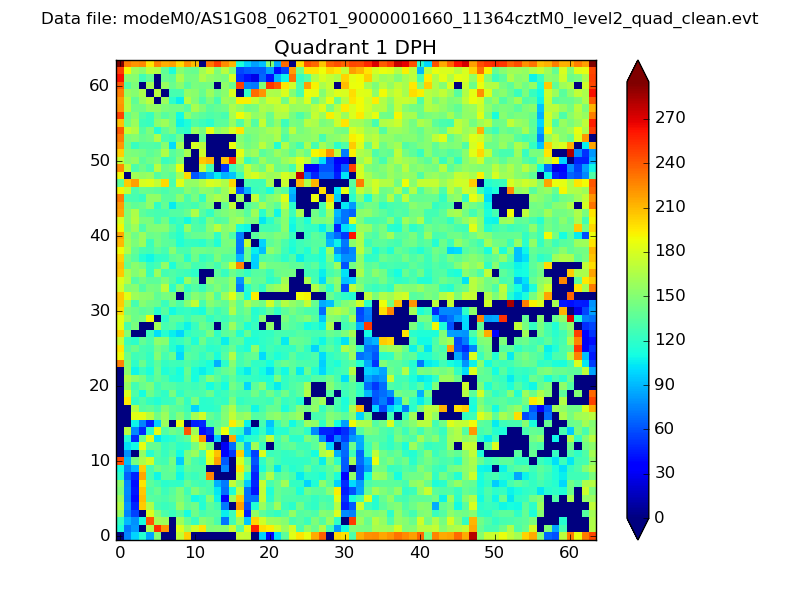 |
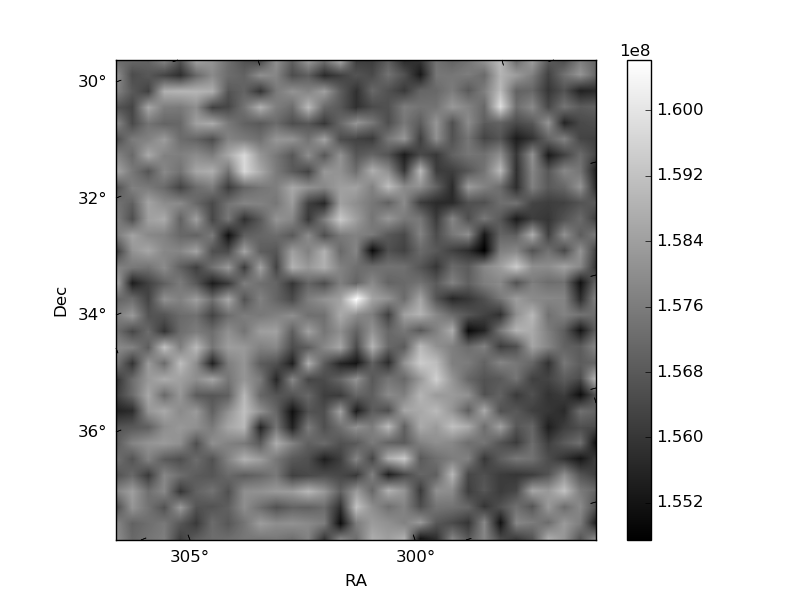
Quadrant B |
|---|---|---|---|
| Quadrant D | 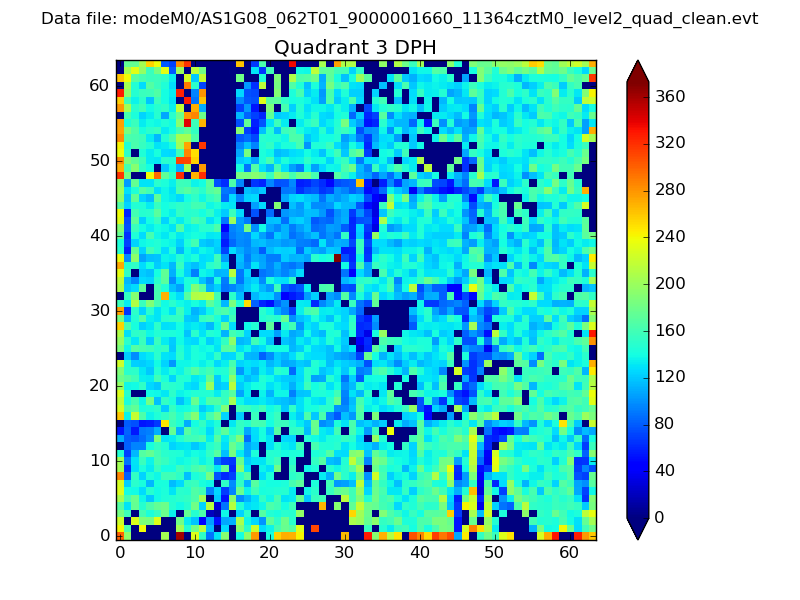 |
 |
Quadrant C |
| Plot type | Count rate plots | Images |
|---|---|---|
| Comparison with Poisson distribution Blue bars denote a histogram of data divided into 1 sec bins. Red curve is a Poisson curve with rate = median count rate of data. |
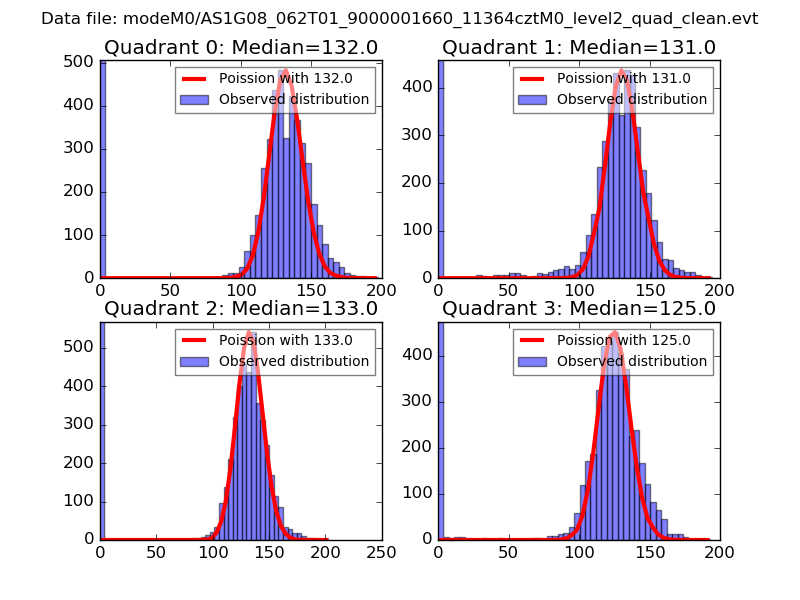 |
 |
| Quadrant-wise count rates Data is divided into 100 sec bins |
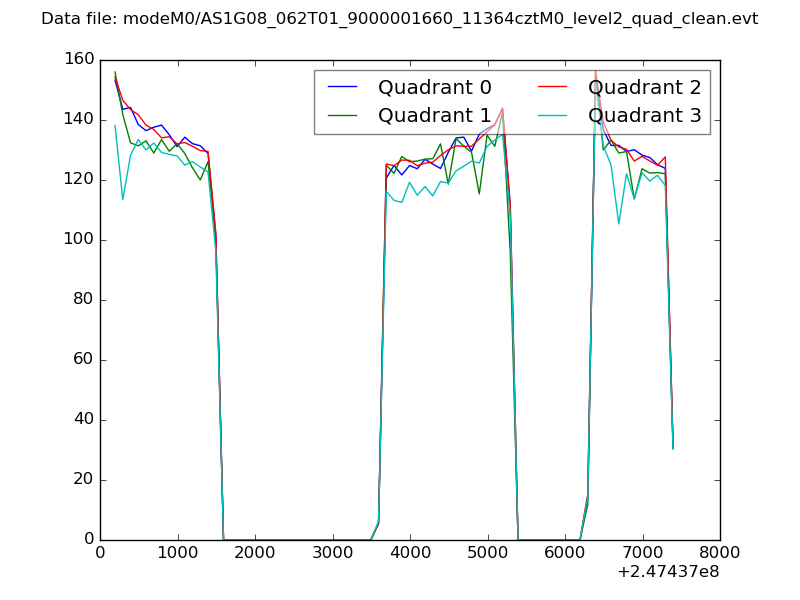 |
|
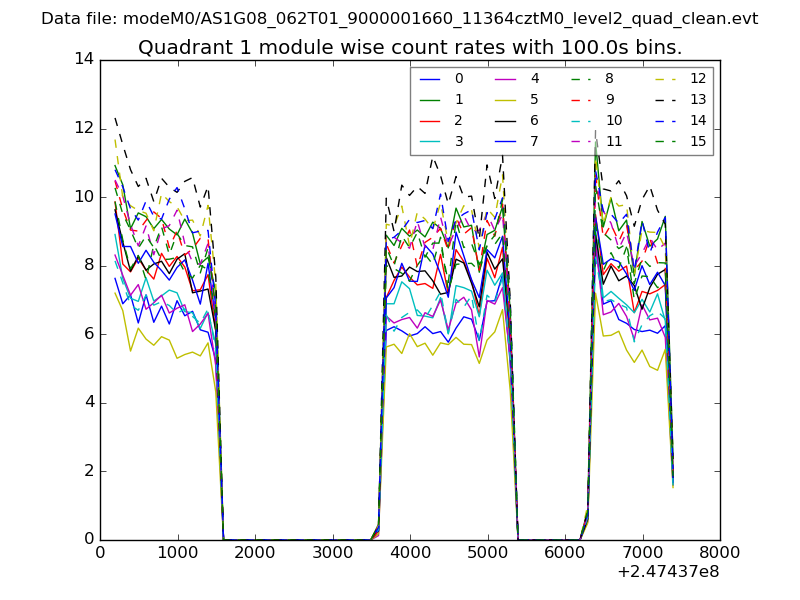
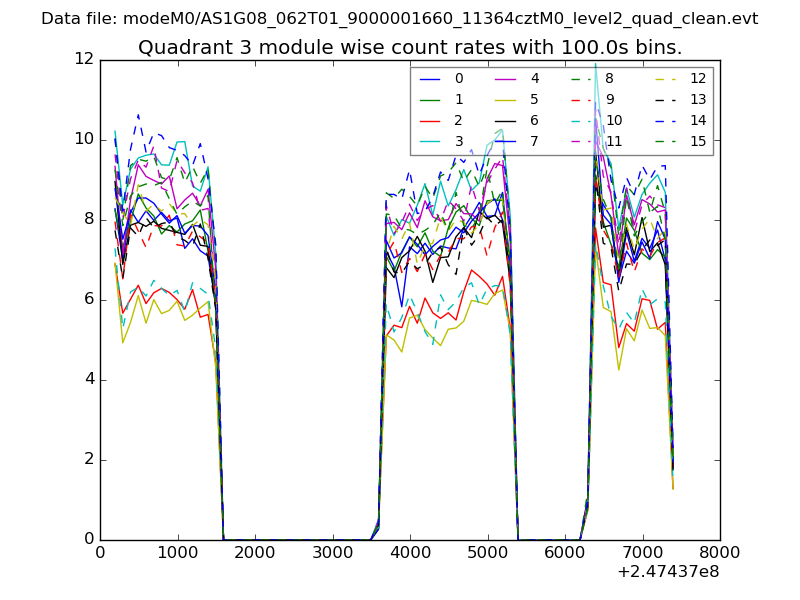
| Module-wise count rates for Quadrant A Data is divided into 100 sec bins |
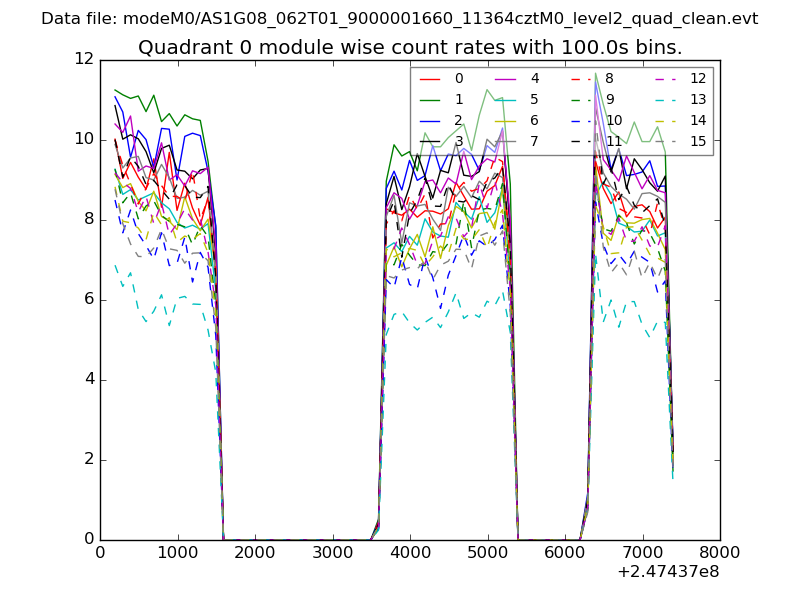 |
 |
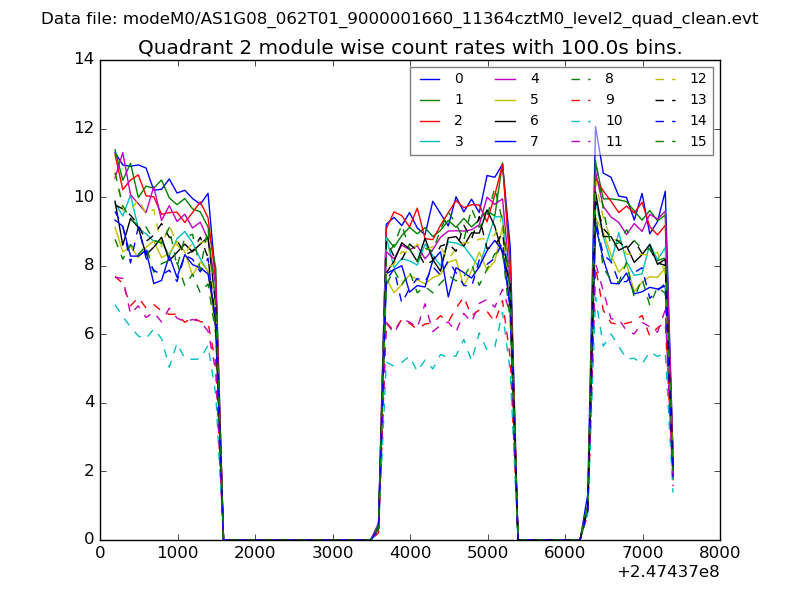
| Module-wise count rates for Quadrant B Data is divided into 100 sec bins |
 |
 |
| Module-wise count rates for Quadrant C Data is divided into 100 sec bins |
 |
 |
| Module-wise count rates for Quadrant D Data is divided into 100 sec bins |
 |
 |
| Parameter | Plot |
|---|---|
| CZT HV Monitor | 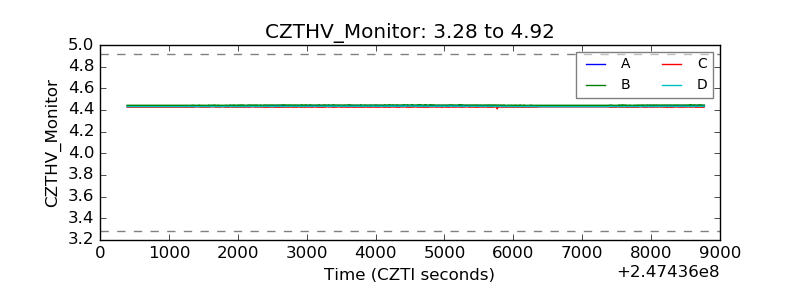 |
| D_VDD | 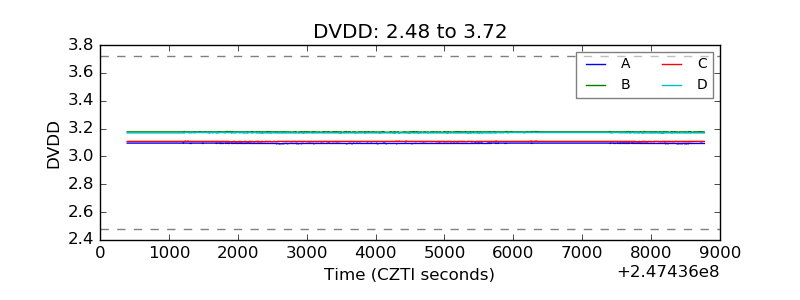 |
| Temperature 1 | 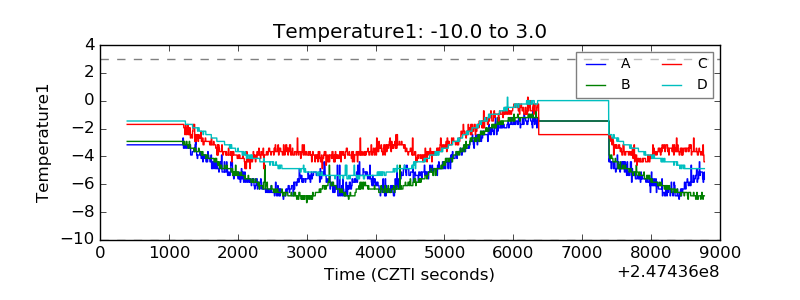 |
| Veto HV Monitor | 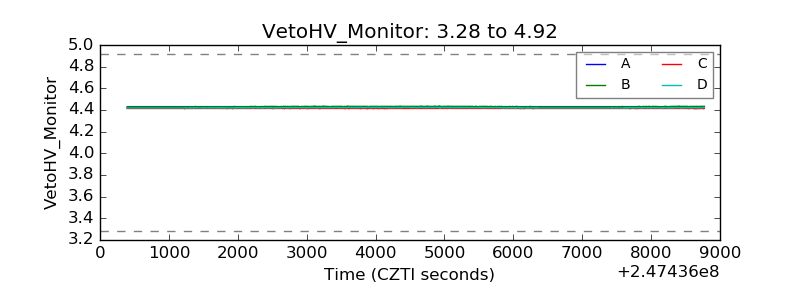 |
| Veto LLD | 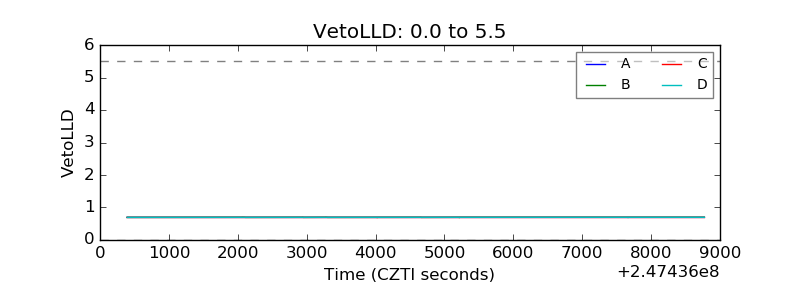 |
| Alpha Counter | 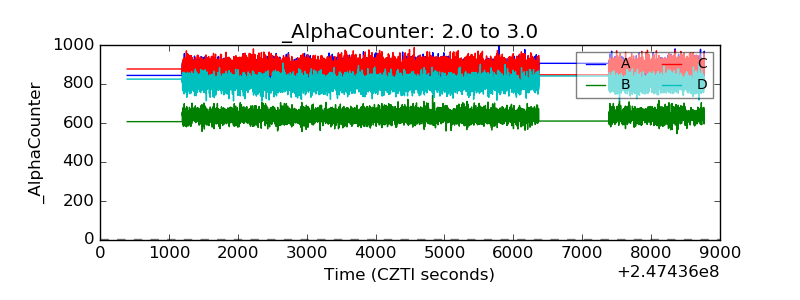 |
| _CPM_Rate | 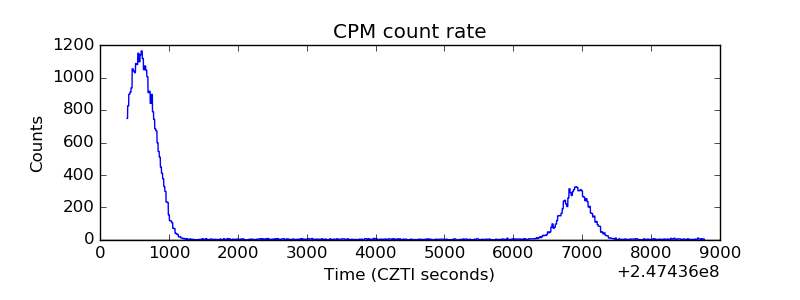 |
| CZT Counter | 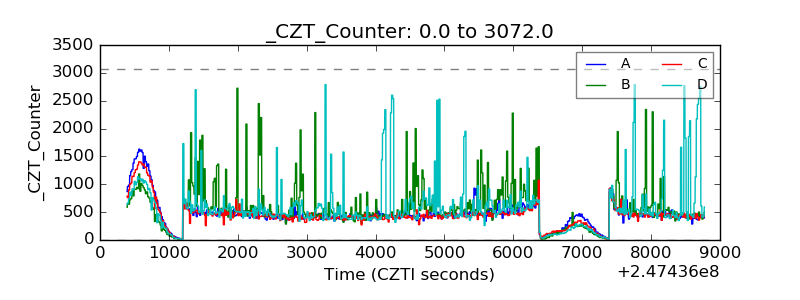 |
| +2.5 Volts monitor |  |
| +5 Volts monitor |  |
| _ROLL_ROT | 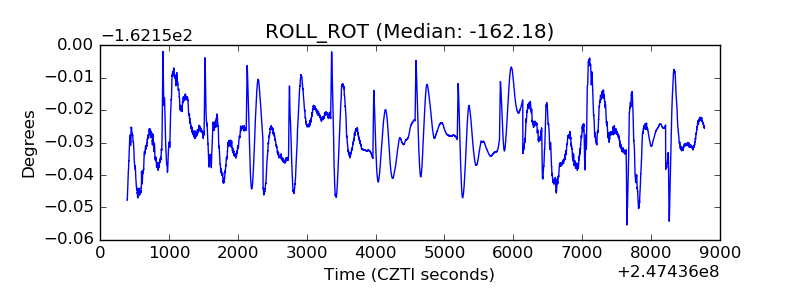 |
| _Roll_DEC | 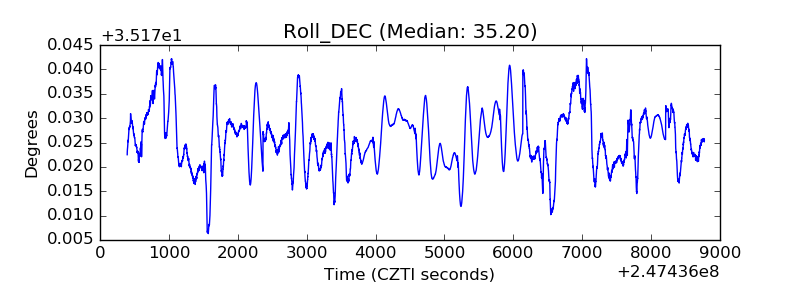 |
| _Roll_RA | 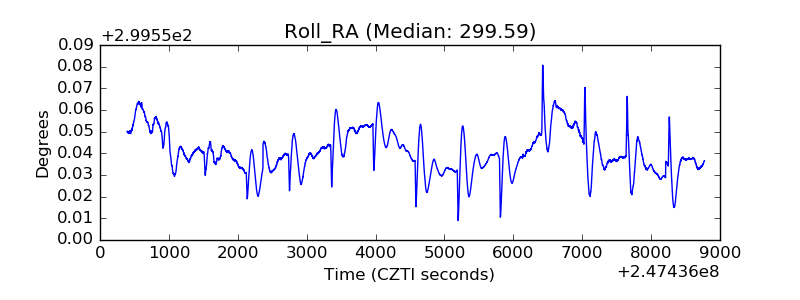 |
| Veto Counter | 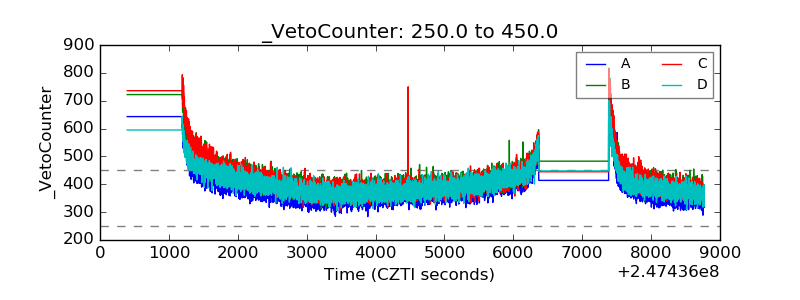 |