| Param | Original file | Final file |
|---|---|---|
| Filename | modeM0/AS1G08_062T01_9000001660_11365cztM0_level2.evt | modeM0/AS1G08_062T01_9000001660_11365cztM0_level2_quad_clean.evt |
| Size (bytes) | 575,645,760 | 85,325,760 |
| Size | 549.0 MB | 81.4 MB |
| Events in quadrant A | 3,445,046 | 536,196 |
| Events in quadrant B | 5,677,267 | 493,584 |
| Events in quadrant C | 3,294,894 | 537,848 |
| Events in quadrant D | 4,518,558 | 505,417 |
| Mode M0 | |||
|---|---|---|---|
| Quadrant | BADHDUFLAG | Total packets | Discarded packets |
| A | 0 | 15278 | 3 |
| B | 0 | 21921 | 2 |
| C | 0 | 15004 | 2 |
| D | 0 | 18547 | 2 |
| Mode SS | |||
|---|---|---|---|
| Quadrant | BADHDUFLAG | Total packets | Discarded packets |
| A | 0 | 150 | 0 |
| B | 0 | 150 | 0 |
| C | 0 | 150 | 0 |
| D | 0 | 150 | 0 |
| Mode M9 | |||
|---|---|---|---|
| Quadrant | BADHDUFLAG | Total packets | Discarded packets |
| A | 0 | 10 | 0 |
| B | 0 | 10 | 0 |
| C | 0 | 10 | 0 |
| D | 0 | 11 | 0 |
| Quadrant | Total seconds | Saturated seconds | Saturation percentage |
|---|---|---|---|
| A | 7327 | 85 | 1.160093% |
| B | 7327 | 848 | 11.573632% |
| C | 7327 | 35 | 0.477685% |
| D | 7327 | 382 | 5.213594% |
Noise dominated data is calculated using 1-second bins in cleaned event files. If a bin has >2000 counts, and if more than 50% of those come from <1% of pixels, then it is considered to be noise-dominated and hence unusable.
| Quadrant | # 1 sec bins | Bins with >0 counts | Bins with >2000 counts | High rate bins dominated by noise | Noise dominated (total time) | Noise dominated (detector-on time) | Marked lightcurve |
|---|---|---|---|---|---|---|---|
| A | 7927 | 7329 | 1 | 1 | 0.01% | 0.01% | 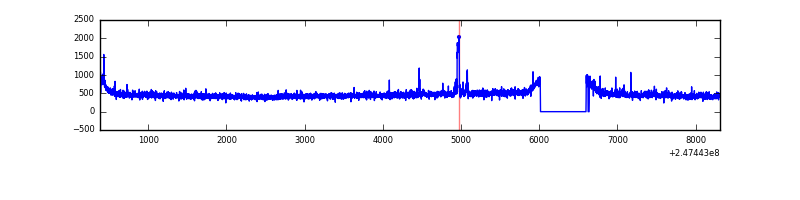 |
| B | 7927 | 7329 | 500 | 500 | 6.31% | 6.82% | 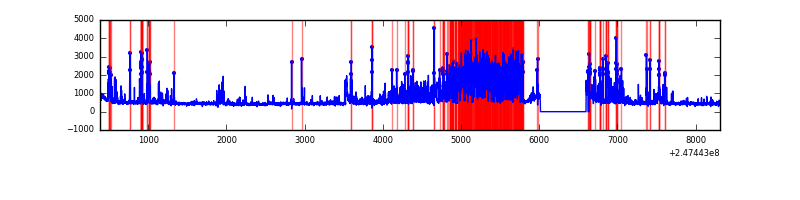 |
| C | 7927 | 7329 | 0 | 0 | 0.00% | 0.00% |  |
| D | 7927 | 7328 | 276 | 276 | 3.48% | 3.77% | 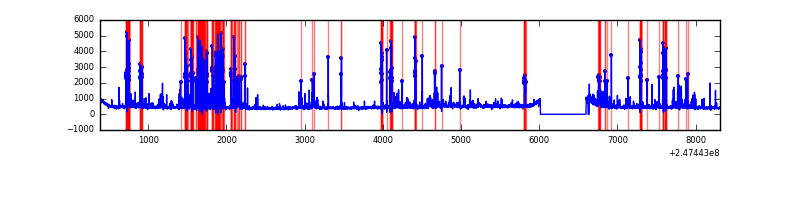 |
Top three noisy pixels from each quadrant. If the there are fewer than three noisy pixels in the level2.evt file, extra rows are filled as -1
| Pixel properties | Quadrant properties | ||||||
|---|---|---|---|---|---|---|---|
| Quadrant | DetID | PixID | Counts | Sigma | Mean | Median | Sigma |
| A | 15 | 174 | 73322 | 412.32 | 859 | 841 | 175.8 |
| A | 8 | 15 | 17358 | 93.96 | 859 | 841 | 175.8 |
| A | 1 | 162 | 16818 | 90.89 | 859 | 841 | 175.8 |
| B | 4 | 206 | 1417520 | 8880.82 | 828 | 807 | 159.5 |
| B | 4 | 239 | 567089 | 3549.8 | 828 | 807 | 159.5 |
| B | 3 | 64 | 305845 | 1912.16 | 828 | 807 | 159.5 |
| C | 13 | 61 | 6130 | 26.86 | 843 | 848 | 196.6 |
| C | 14 | 234 | 5371 | 23.0 | 843 | 848 | 196.6 |
| C | 12 | 4 | 2677 | 9.3 | 843 | 848 | 196.6 |
| D | 10 | 253 | 801303 | 4044.16 | 814 | 792 | 197.9 |
| D | 2 | 120 | 182215 | 916.54 | 814 | 792 | 197.9 |
| D | 1 | 52 | 172737 | 868.66 | 814 | 792 | 197.9 |
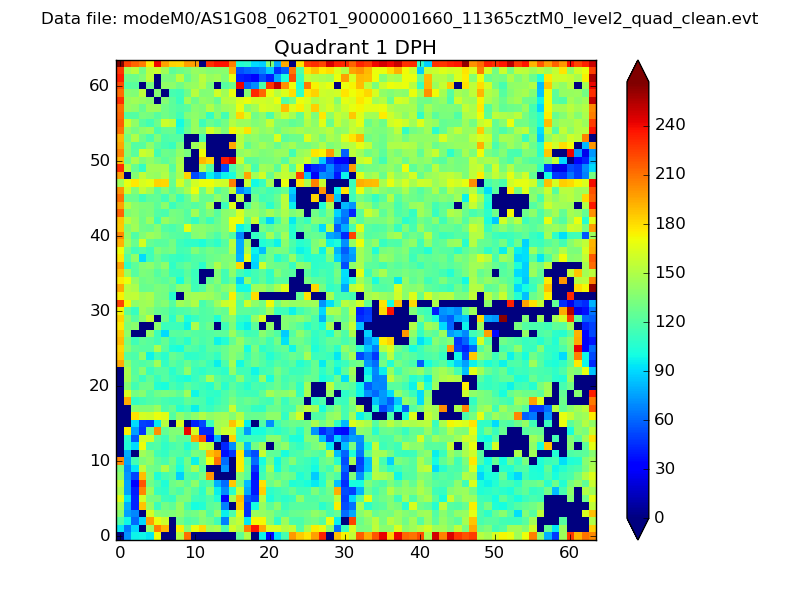
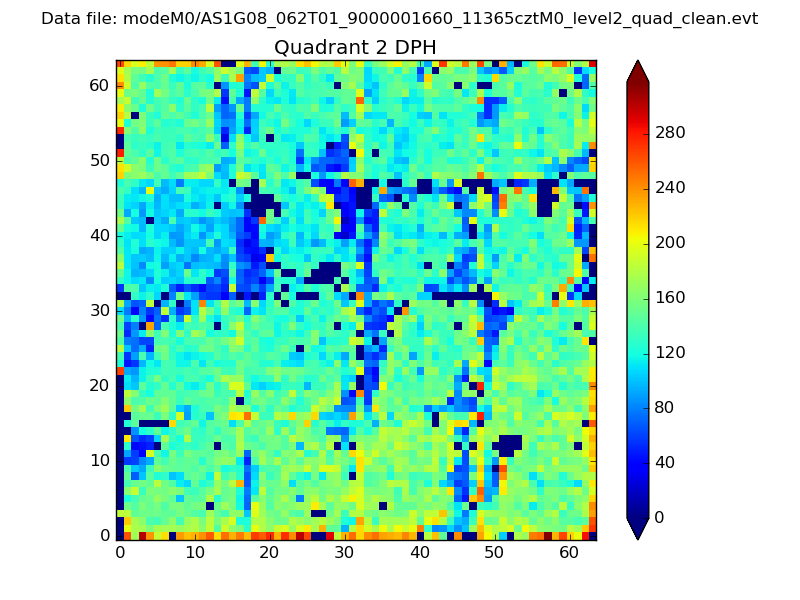
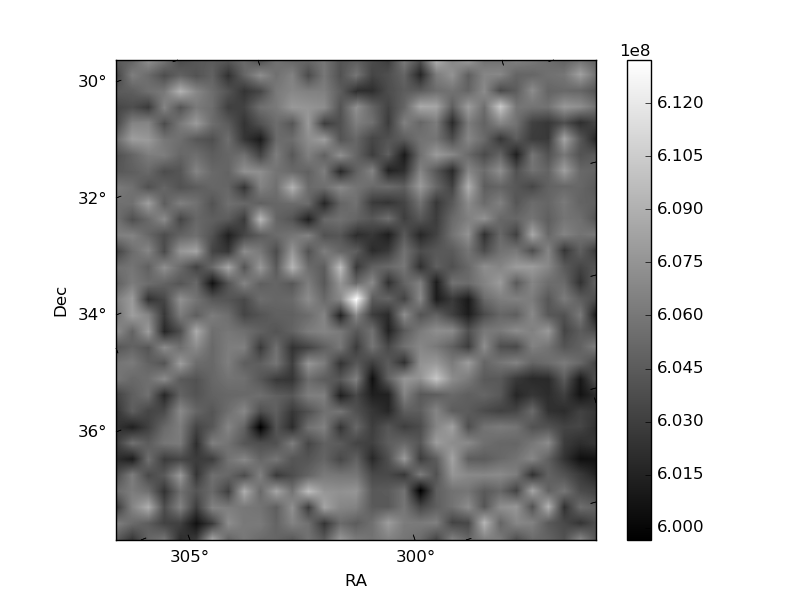
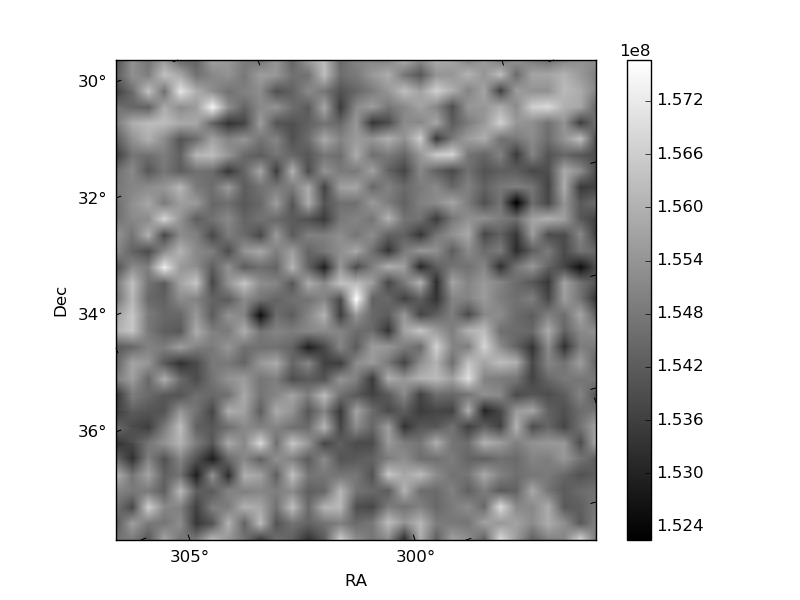
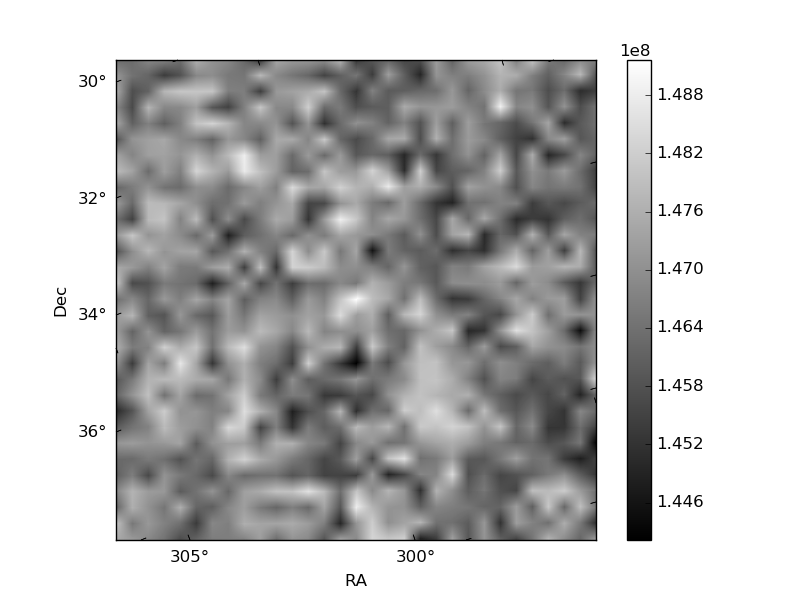
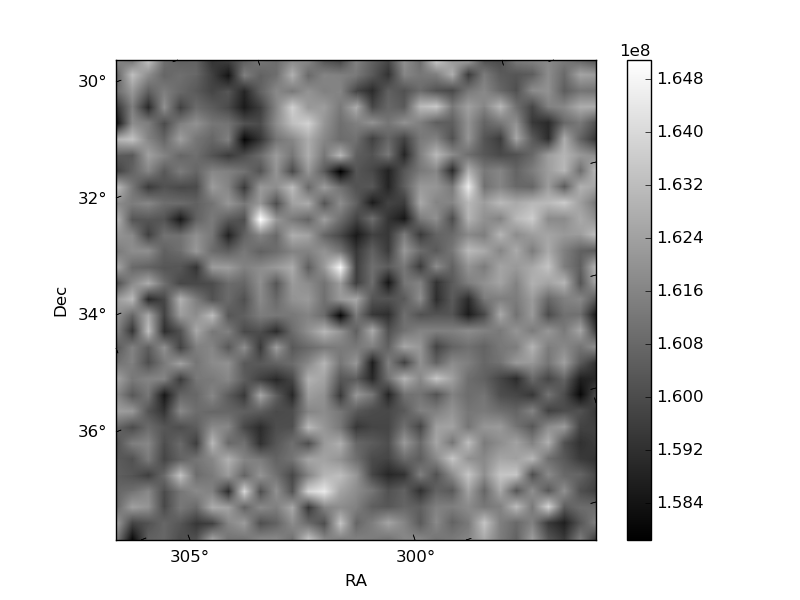
Histogram calculated using DETX and DETY for each event in the final _common_clean file
| Quadrant A | 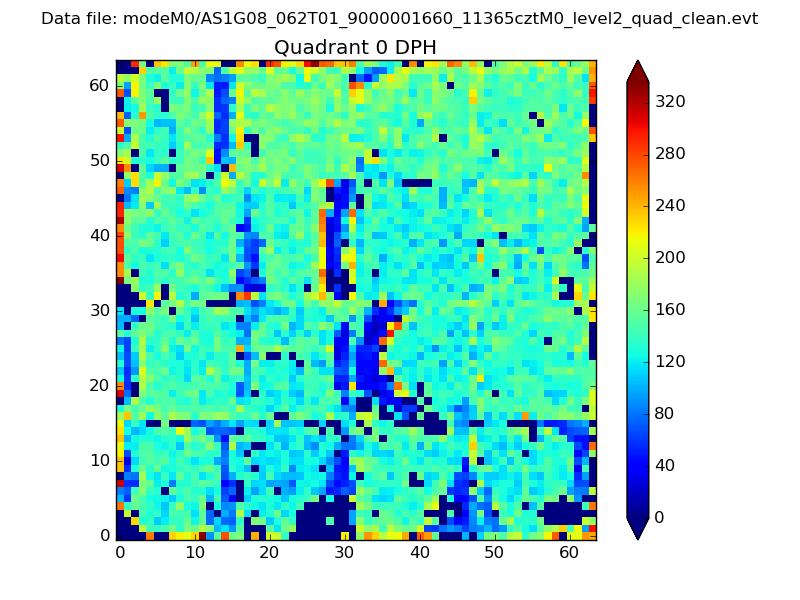 |
 |
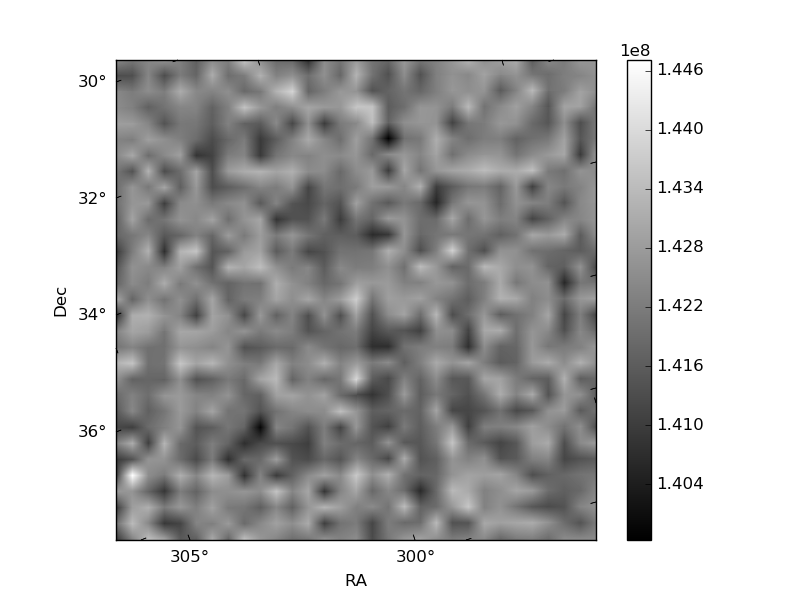
Quadrant B |
|---|---|---|---|
| Quadrant D | 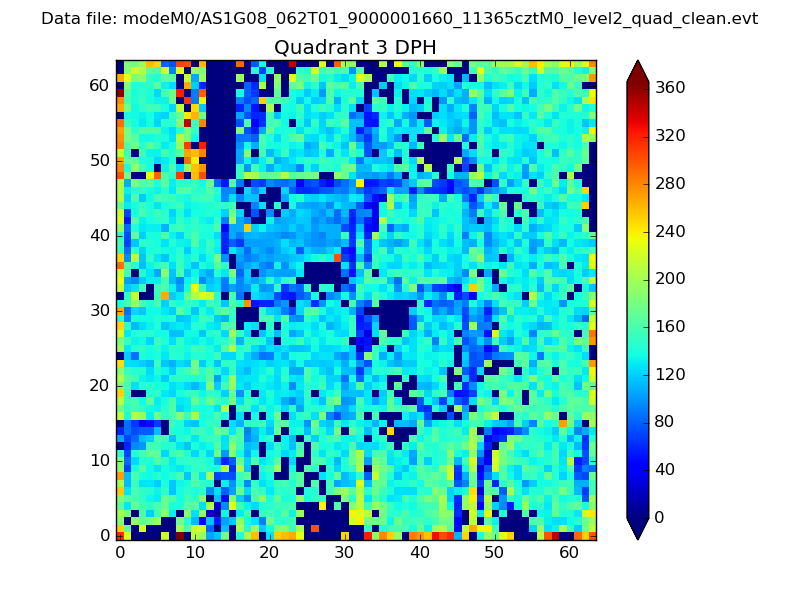 |
 |
Quadrant C |
| Plot type | Count rate plots | Images |
|---|---|---|
| Comparison with Poisson distribution Blue bars denote a histogram of data divided into 1 sec bins. Red curve is a Poisson curve with rate = median count rate of data. |
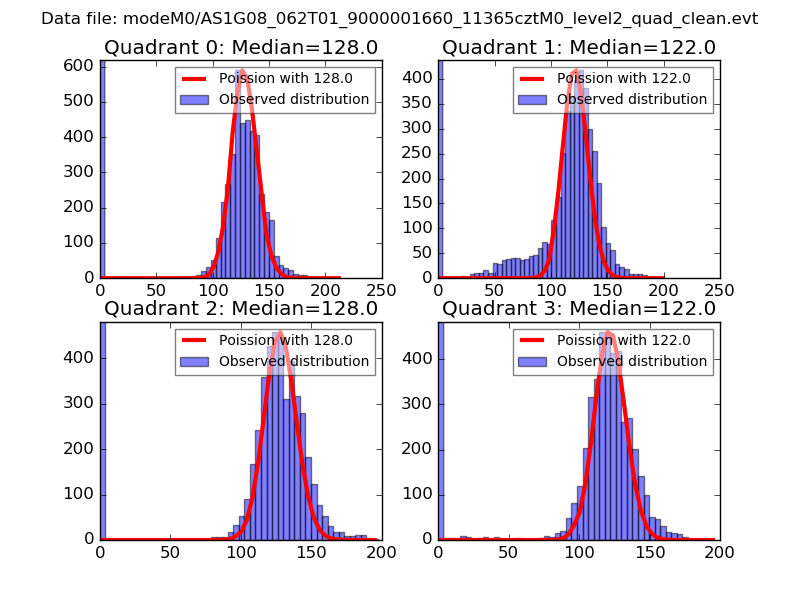 |
 |
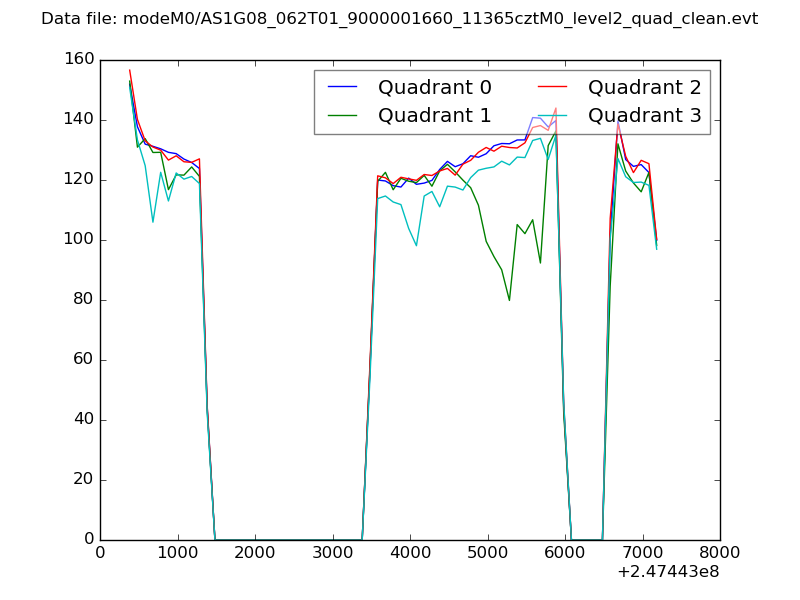
| Quadrant-wise count rates Data is divided into 100 sec bins |
 |
|
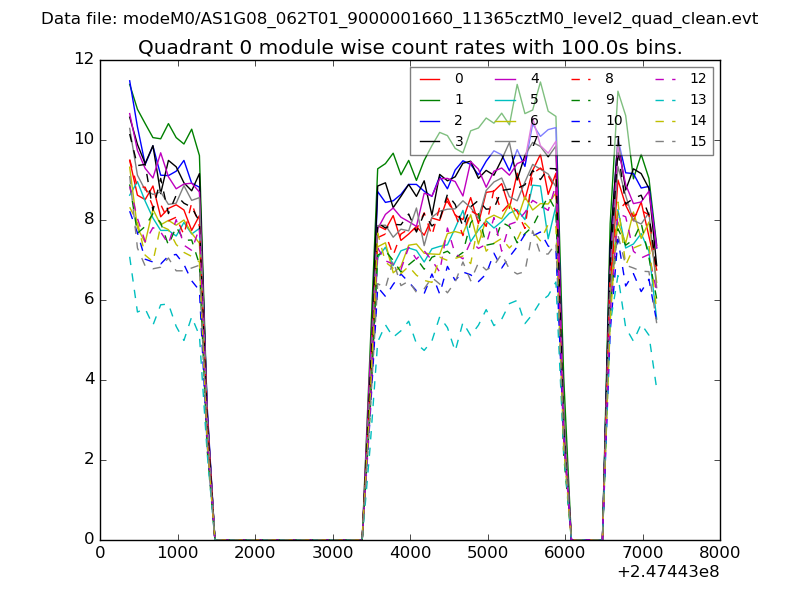
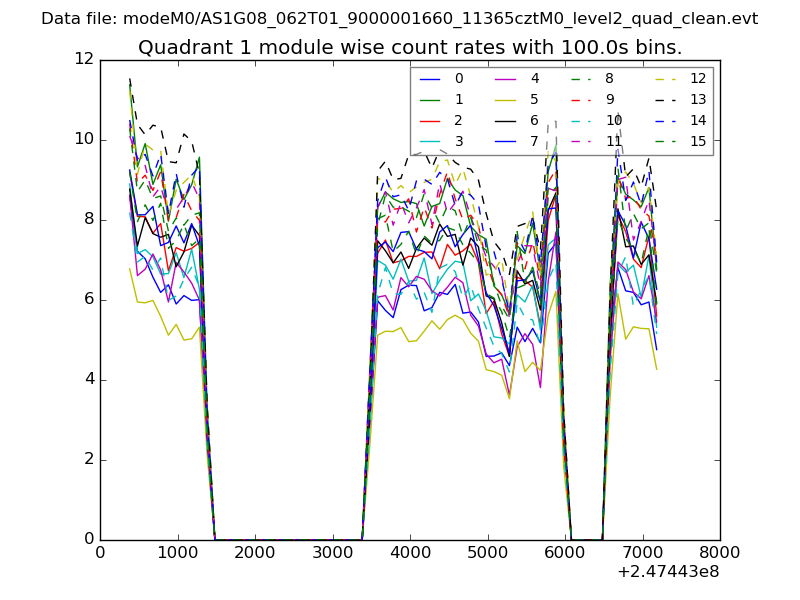
| Module-wise count rates for Quadrant A Data is divided into 100 sec bins |
 |
 |
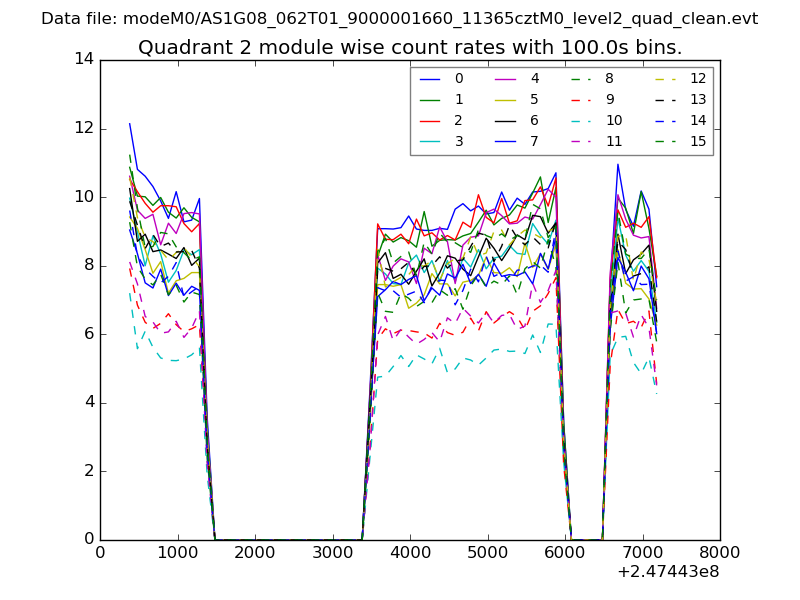
| Module-wise count rates for Quadrant B Data is divided into 100 sec bins |
 |
 |
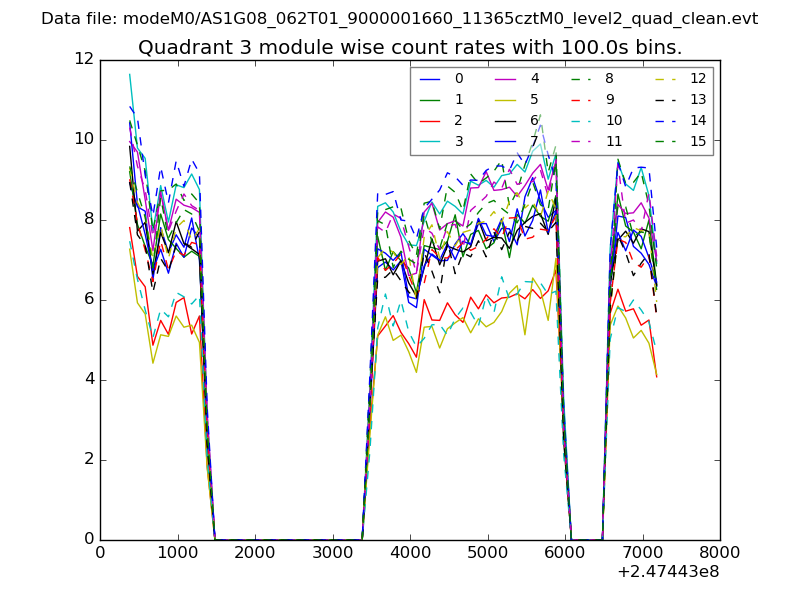
| Module-wise count rates for Quadrant C Data is divided into 100 sec bins |
 |
 |
| Module-wise count rates for Quadrant D Data is divided into 100 sec bins |
 |
 |
| Parameter | Plot |
|---|---|
| CZT HV Monitor | 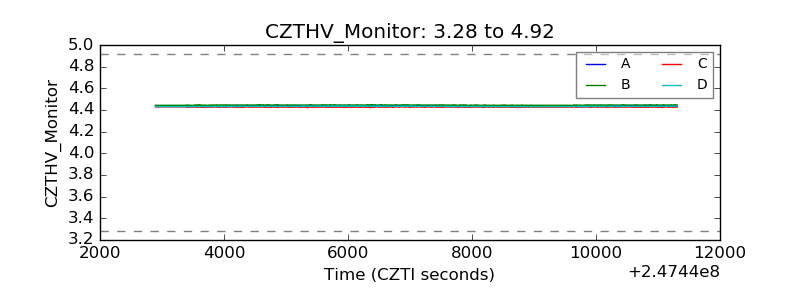 |
| D_VDD | 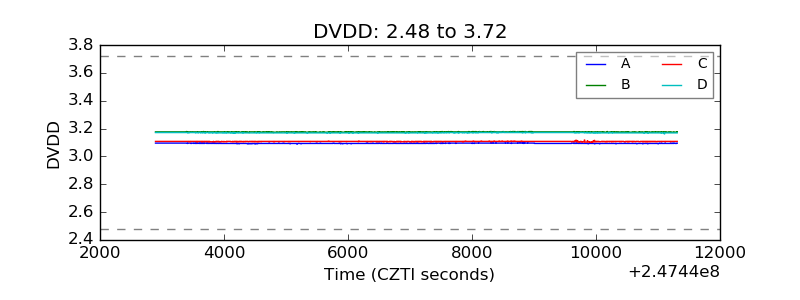 |
| Temperature 1 | 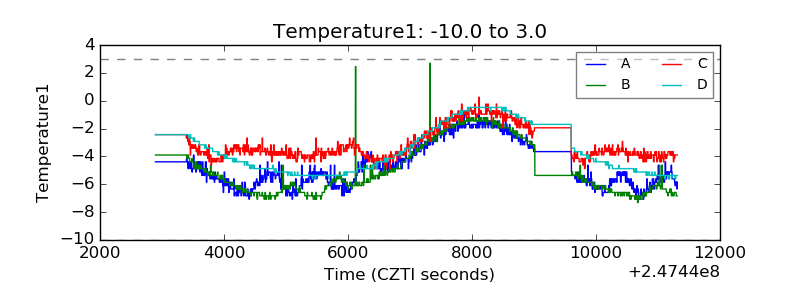 |
| Veto HV Monitor | 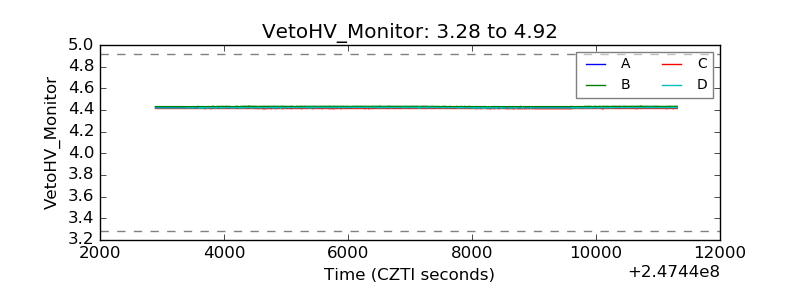 |
| Veto LLD | 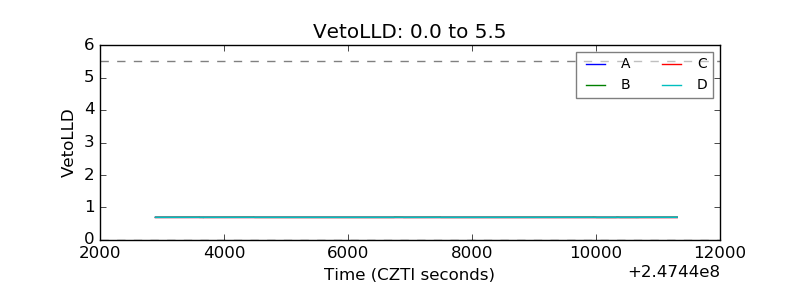 |
| Alpha Counter | 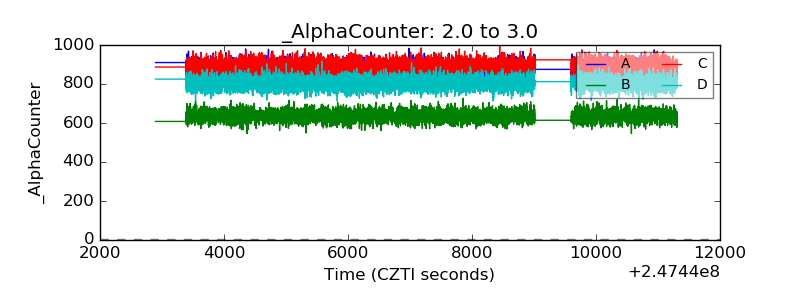 |
| _CPM_Rate | 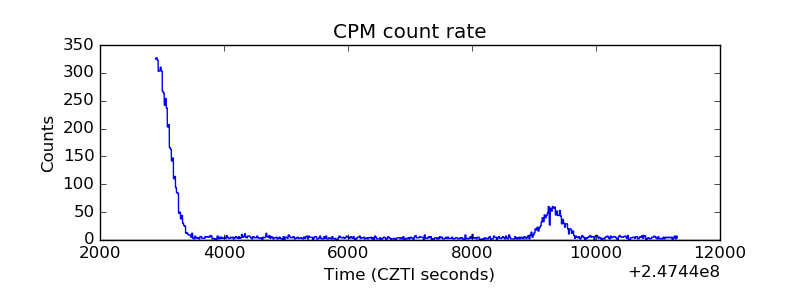 |
| CZT Counter | 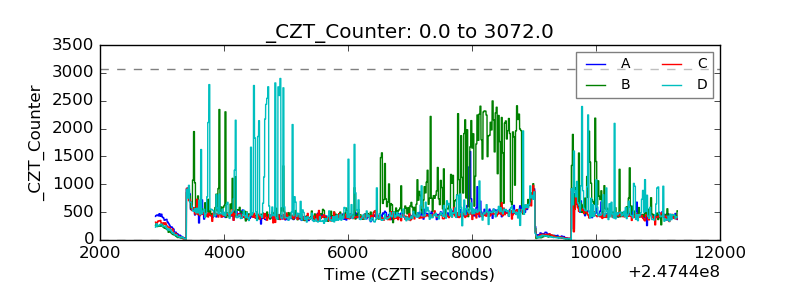 |
| +2.5 Volts monitor |  |
| +5 Volts monitor | 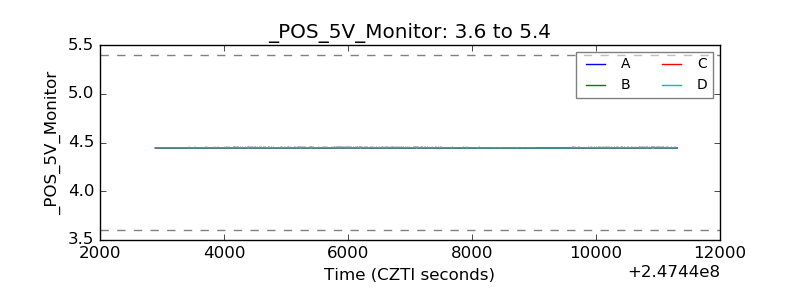 |
| _ROLL_ROT |  |
| _Roll_DEC | 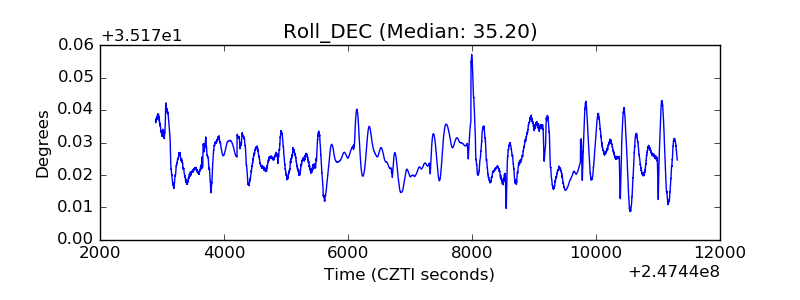 |
| _Roll_RA | 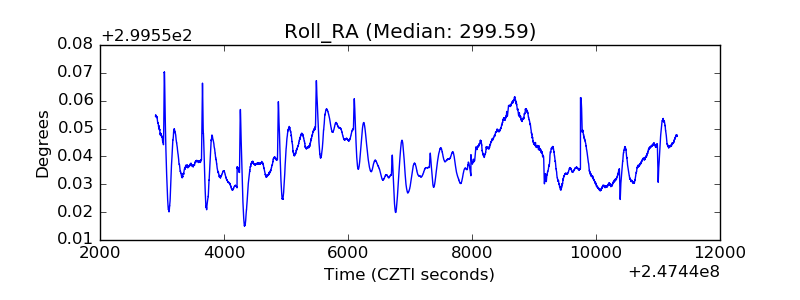 |
| Veto Counter | 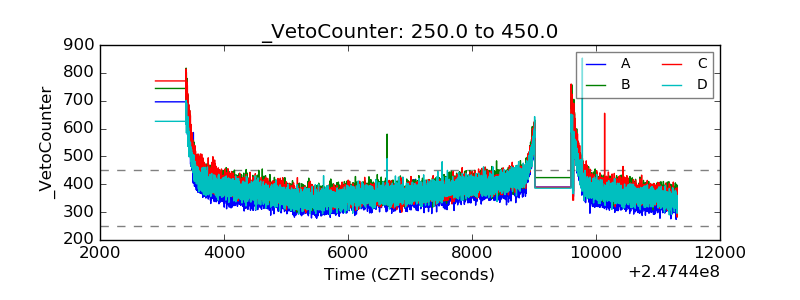 |