| Param | Original file | Final file |
|---|---|---|
| Filename | modeM0/AS1G08_062T01_9000001660_11367cztM0_level2.evt | modeM0/AS1G08_062T01_9000001660_11367cztM0_level2_quad_clean.evt |
| Size (bytes) | 583,119,360 | 80,280,000 |
| Size | 556.1 MB | 76.6 MB |
| Events in quadrant A | 4,414,829 | 478,946 |
| Events in quadrant B | 5,061,563 | 465,838 |
| Events in quadrant C | 3,500,974 | 485,707 |
| Events in quadrant D | 4,160,046 | 464,723 |
| Mode M0 | |||
|---|---|---|---|
| Quadrant | BADHDUFLAG | Total packets | Discarded packets |
| A | 0 | 18354 | 2 |
| B | 0 | 20161 | 1 |
| C | 0 | 15845 | 1 |
| D | 0 | 17820 | 1 |
| Mode SS | |||
|---|---|---|---|
| Quadrant | BADHDUFLAG | Total packets | Discarded packets |
| A | 0 | 158 | 0 |
| B | 0 | 158 | 0 |
| C | 0 | 158 | 0 |
| D | 0 | 158 | 0 |
| Mode M9 | |||
|---|---|---|---|
| Quadrant | BADHDUFLAG | Total packets | Discarded packets |
| A | 0 | 1 | 0 |
| B | 0 | 1 | 0 |
| C | 0 | 1 | 0 |
| D | 0 | 1 | 0 |
| Quadrant | Total seconds | Saturated seconds | Saturation percentage |
|---|---|---|---|
| A | 7694 | 119 | 1.546660% |
| B | 7694 | 471 | 6.121653% |
| C | 7694 | 63 | 0.818820% |
| D | 7694 | 231 | 3.002339% |
Noise dominated data is calculated using 1-second bins in cleaned event files. If a bin has >2000 counts, and if more than 50% of those come from <1% of pixels, then it is considered to be noise-dominated and hence unusable.
| Quadrant | # 1 sec bins | Bins with >0 counts | Bins with >2000 counts | High rate bins dominated by noise | Noise dominated (total time) | Noise dominated (detector-on time) | Marked lightcurve |
|---|---|---|---|---|---|---|---|
| A | 7824 | 7696 | 0 | 0 | 0.00% | 0.00% | 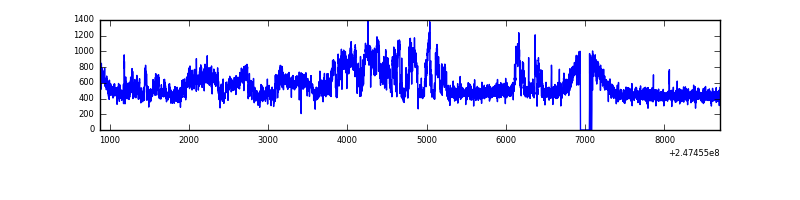 |
| B | 7824 | 7696 | 206 | 206 | 2.63% | 2.68% | 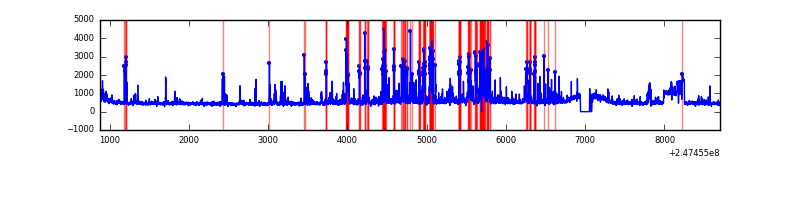 |
| C | 7824 | 7696 | 1 | 1 | 0.01% | 0.01% | 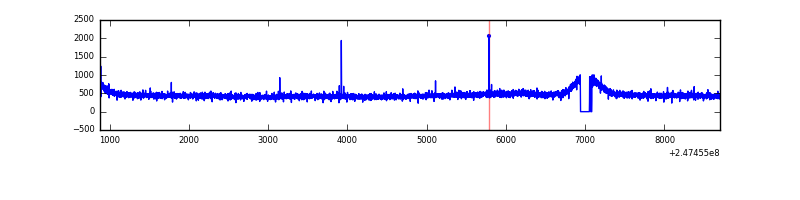 |
| D | 7824 | 7696 | 125 | 125 | 1.60% | 1.62% | 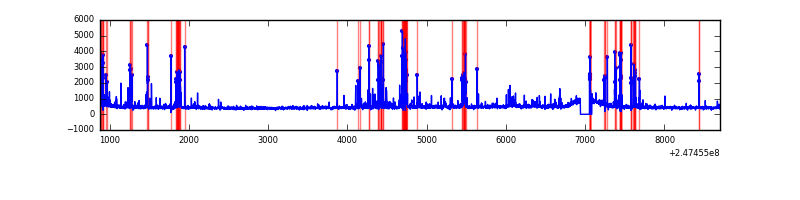 |
Top three noisy pixels from each quadrant. If the there are fewer than three noisy pixels in the level2.evt file, extra rows are filled as -1
| Pixel properties | Quadrant properties | ||||||
|---|---|---|---|---|---|---|---|
| Quadrant | DetID | PixID | Counts | Sigma | Mean | Median | Sigma |
| A | 15 | 174 | 881499 | 4756.4 | 899 | 876 | 185.1 |
| A | 1 | 162 | 22159 | 114.95 | 899 | 876 | 185.1 |
| A | 1 | 178 | 13073 | 65.88 | 899 | 876 | 185.1 |
| B | 4 | 239 | 685987 | 4020.53 | 891 | 868 | 170.4 |
| B | 3 | 64 | 414741 | 2428.76 | 891 | 868 | 170.4 |
| B | 7 | 220 | 224954 | 1315.02 | 891 | 868 | 170.4 |
| C | 8 | 128 | 13276 | 59.3 | 889 | 894 | 208.8 |
| C | 8 | 112 | 7440 | 31.35 | 889 | 894 | 208.8 |
| C | 14 | 234 | 6904 | 28.78 | 889 | 894 | 208.8 |
| D | 10 | 253 | 427937 | 1998.35 | 864 | 840 | 213.7 |
| D | 2 | 120 | 120337 | 559.12 | 864 | 840 | 213.7 |
| D | 13 | 104 | 94364 | 437.59 | 864 | 840 | 213.7 |
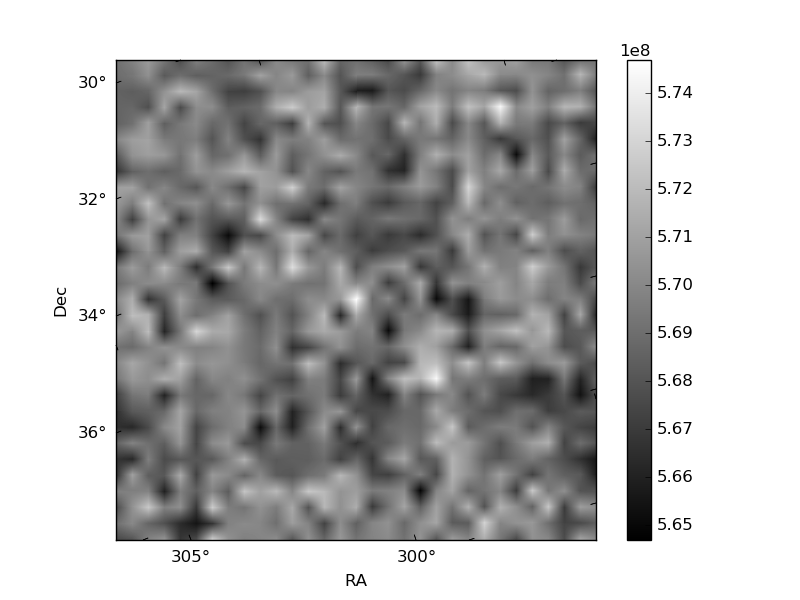
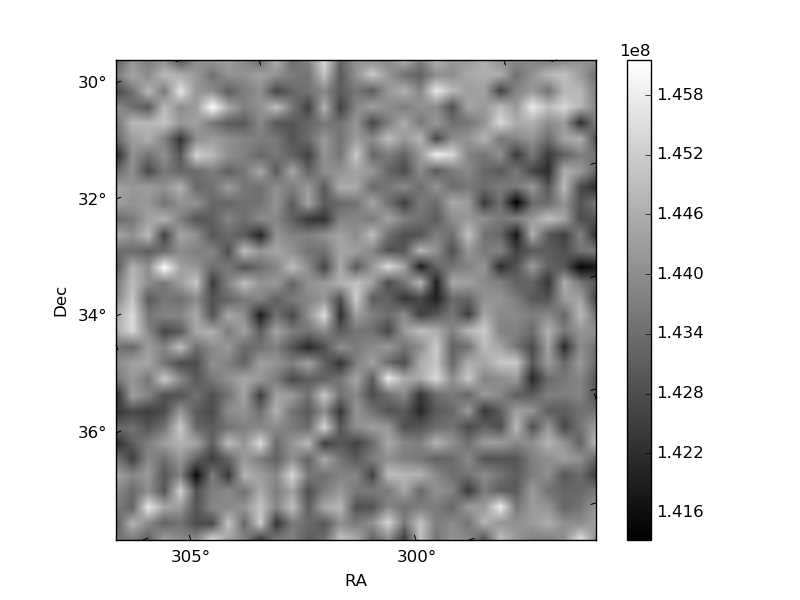
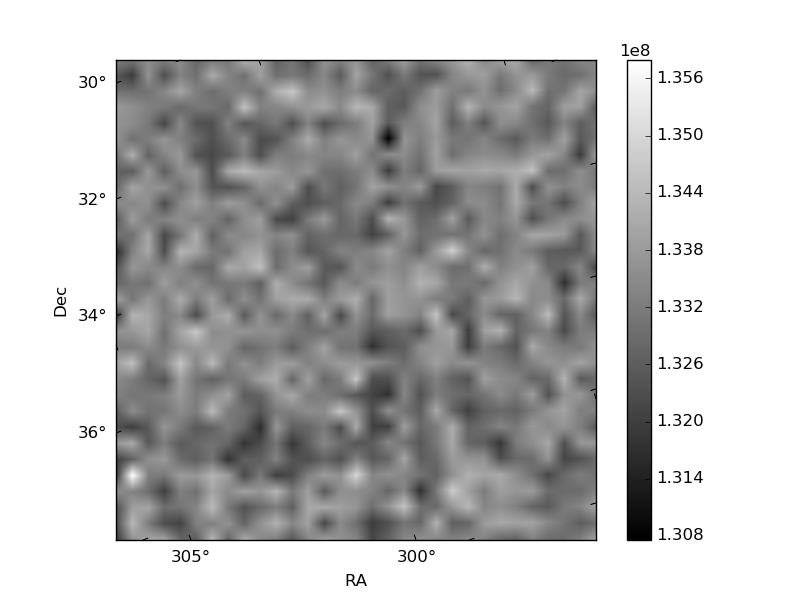
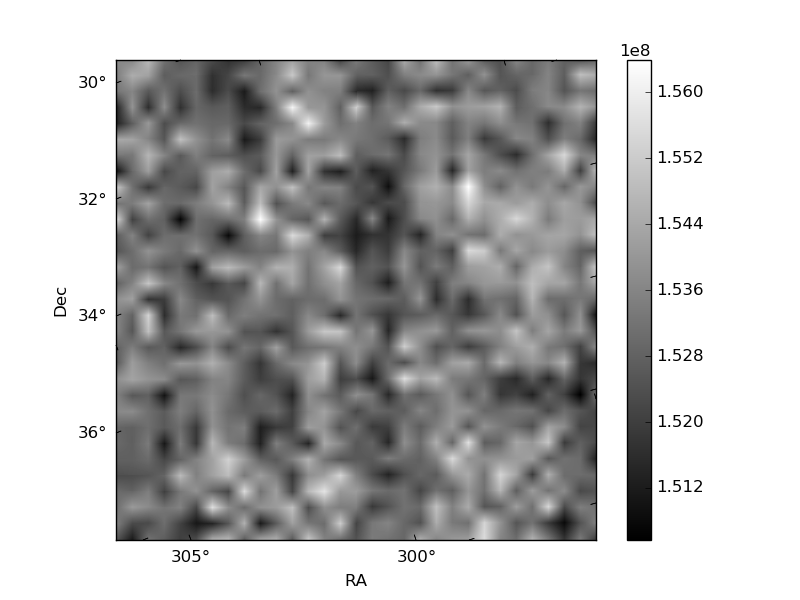
Histogram calculated using DETX and DETY for each event in the final _common_clean file
| Quadrant A | 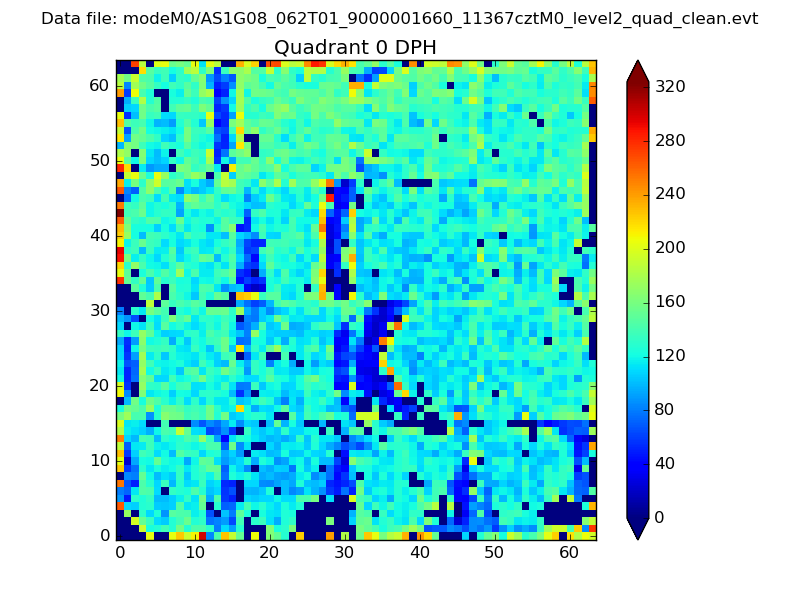 |
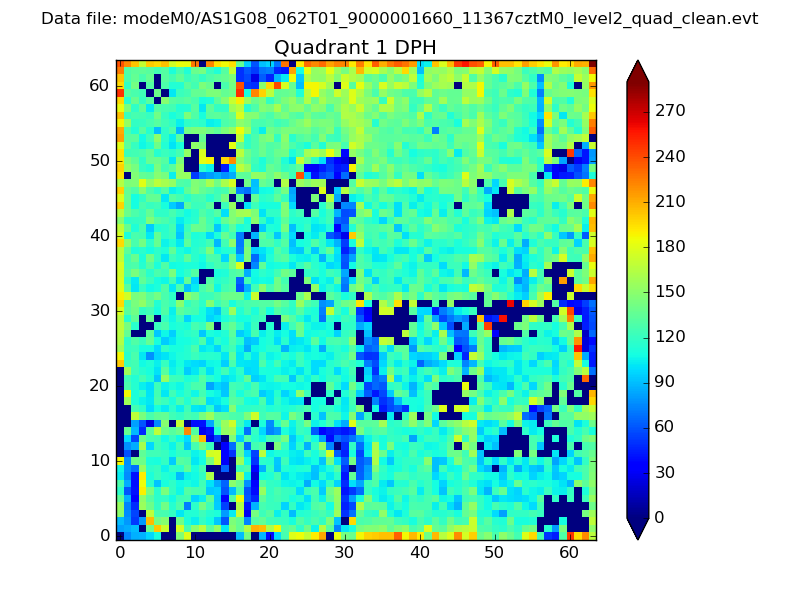 |
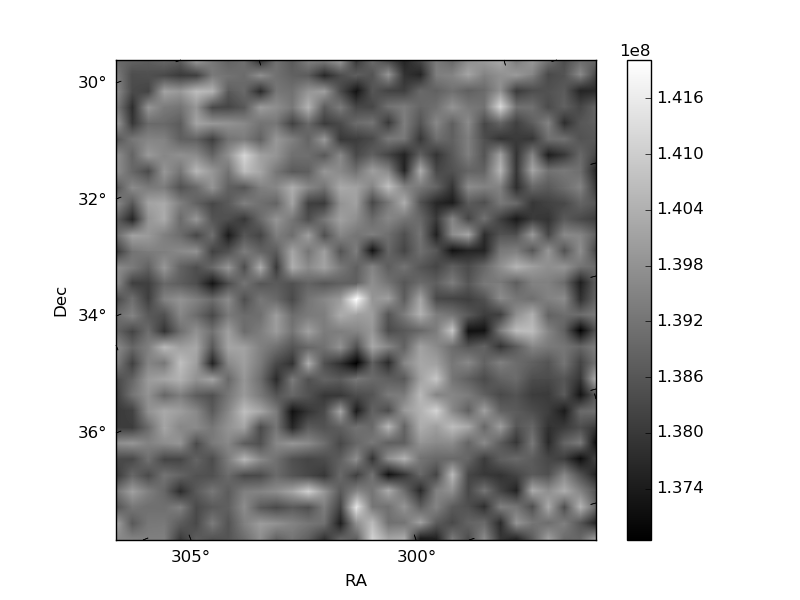
Quadrant B |
|---|---|---|---|
| Quadrant D | 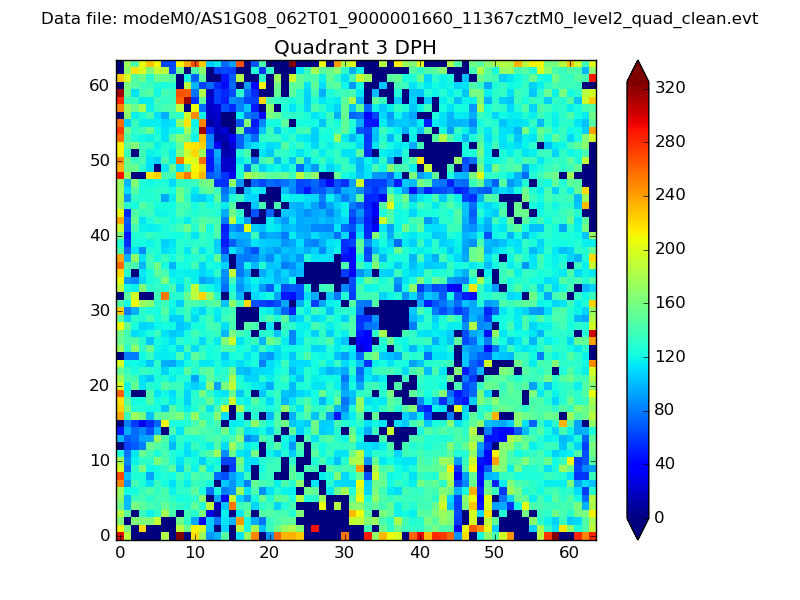 |
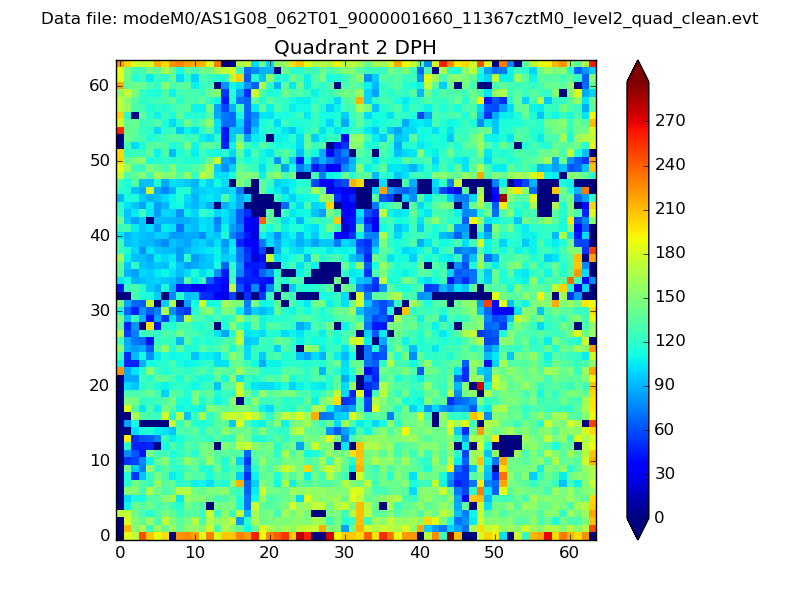 |
Quadrant C |
| Plot type | Count rate plots | Images |
|---|---|---|
| Comparison with Poisson distribution Blue bars denote a histogram of data divided into 1 sec bins. Red curve is a Poisson curve with rate = median count rate of data. |
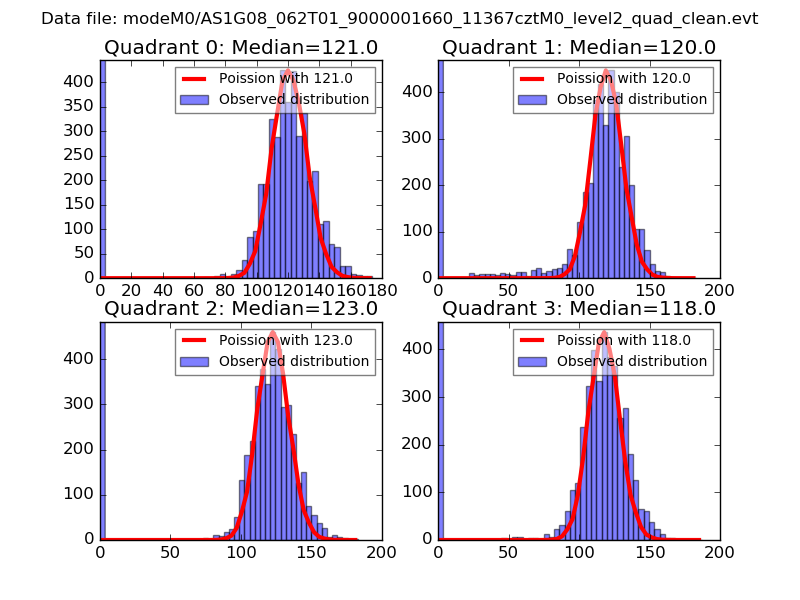 |
 |
| Quadrant-wise count rates Data is divided into 100 sec bins |
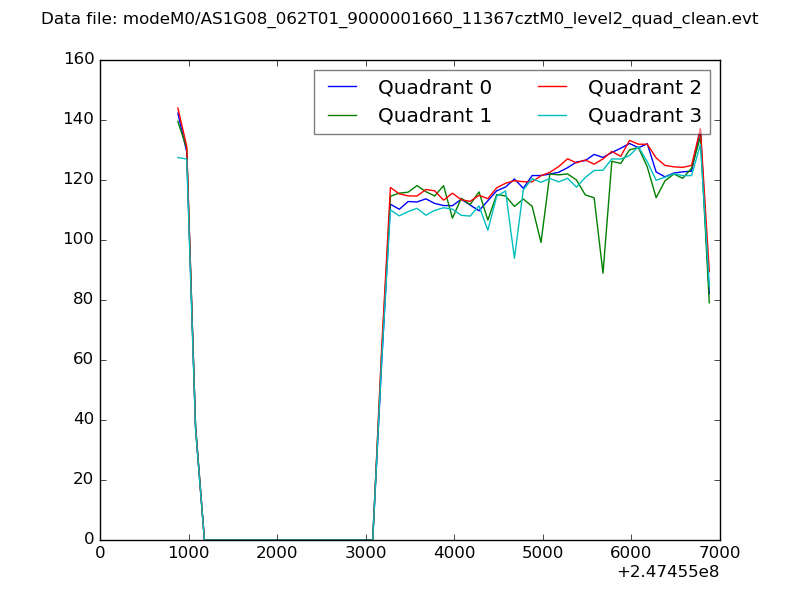 |
|
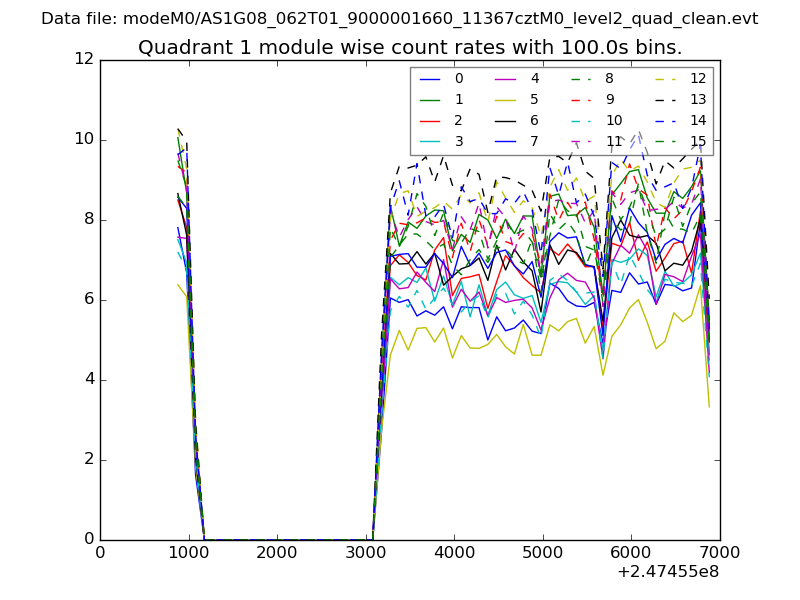
| Module-wise count rates for Quadrant A Data is divided into 100 sec bins |
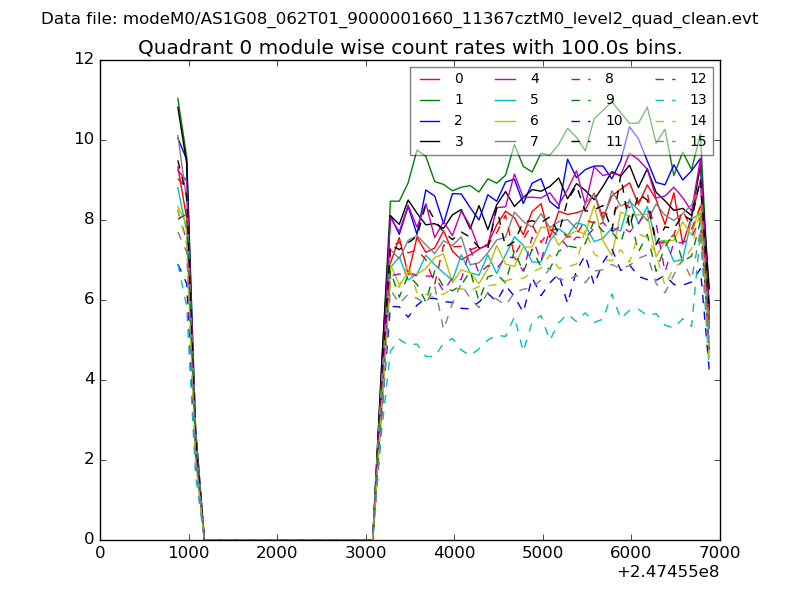 |
 |
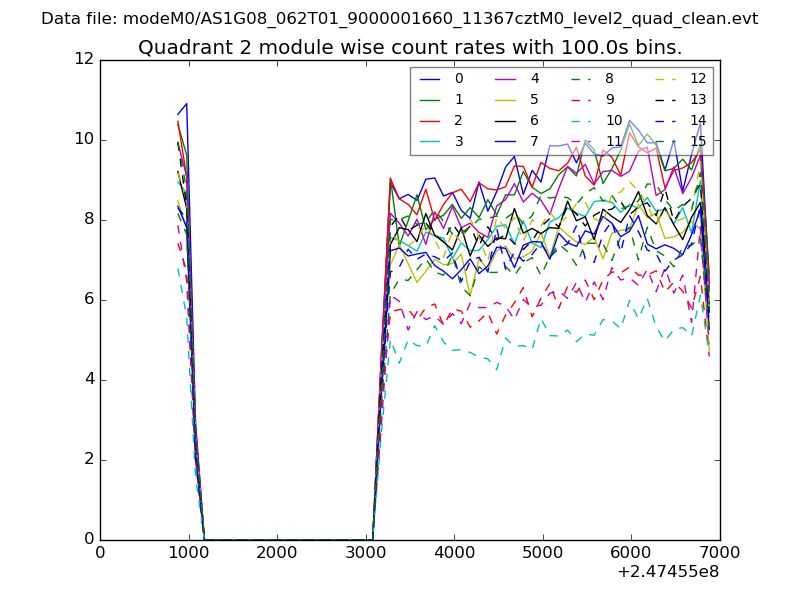
| Module-wise count rates for Quadrant B Data is divided into 100 sec bins |
 |
 |
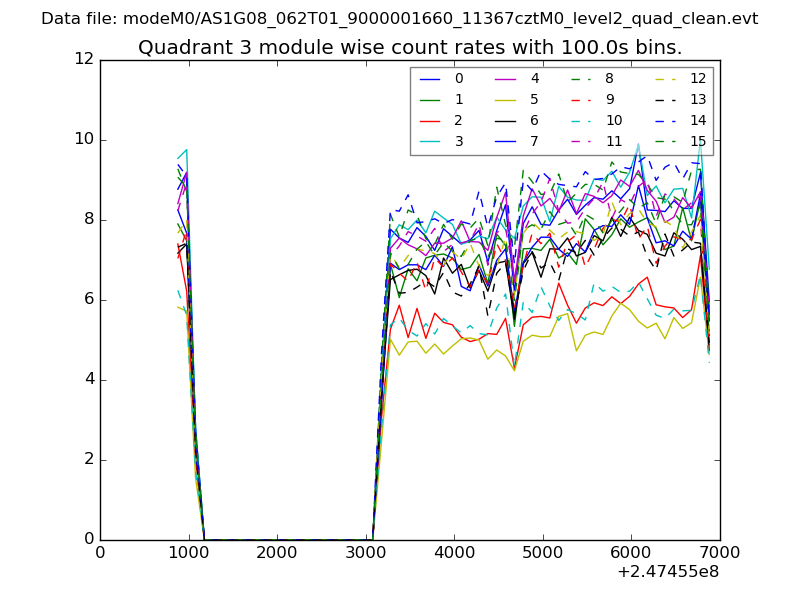
| Module-wise count rates for Quadrant C Data is divided into 100 sec bins |
 |
 |
| Module-wise count rates for Quadrant D Data is divided into 100 sec bins |
 |
 |
| Parameter | Plot |
|---|---|
| CZT HV Monitor | 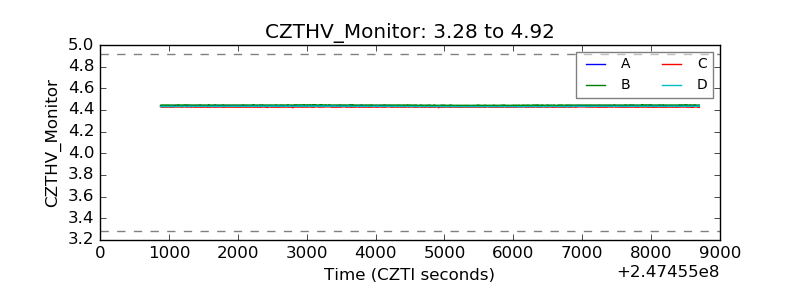 |
| D_VDD | 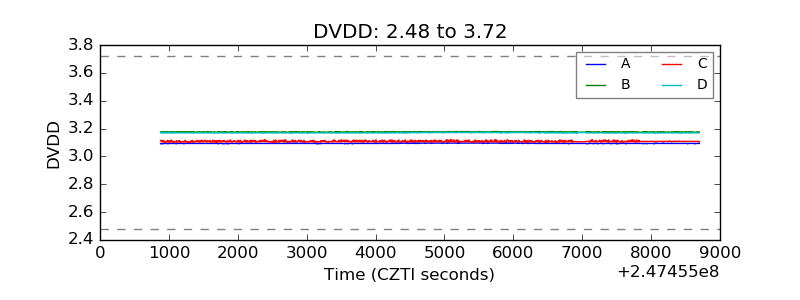 |
| Temperature 1 | 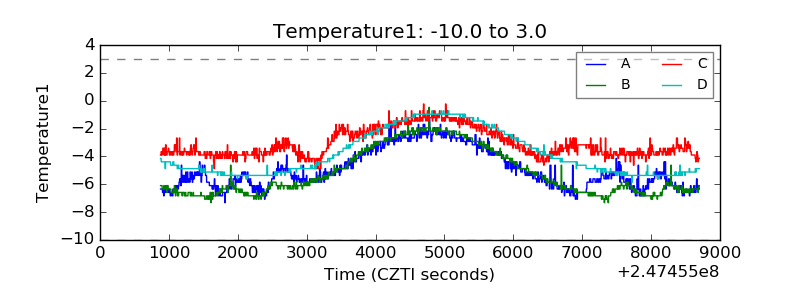 |
| Veto HV Monitor |  |
| Veto LLD | 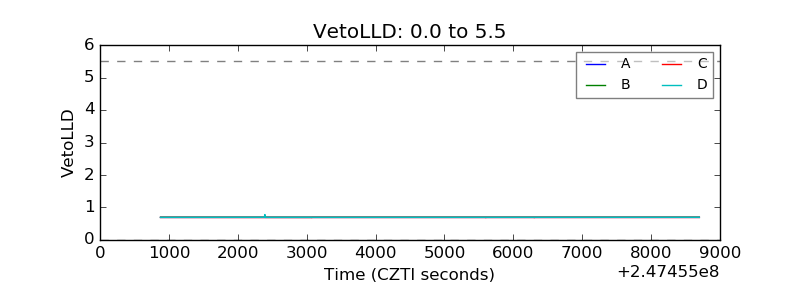 |
| Alpha Counter | 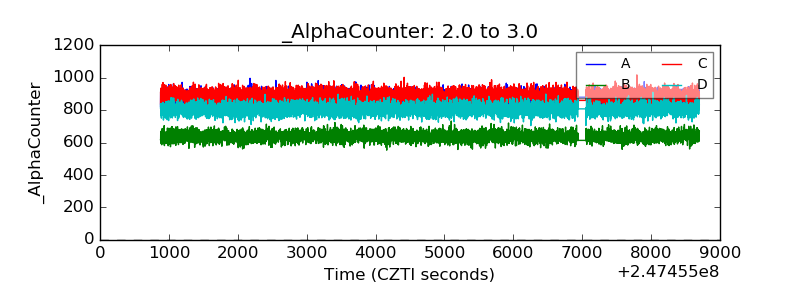 |
| _CPM_Rate | 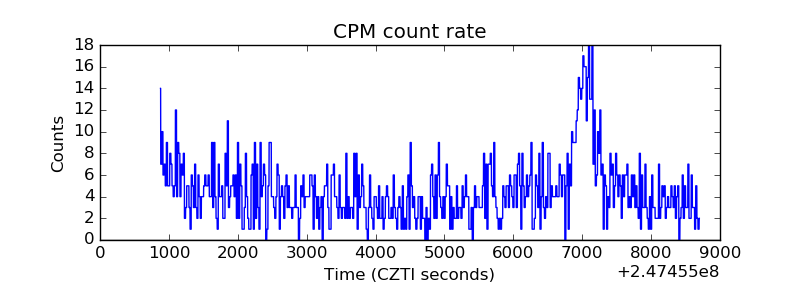 |
| CZT Counter | 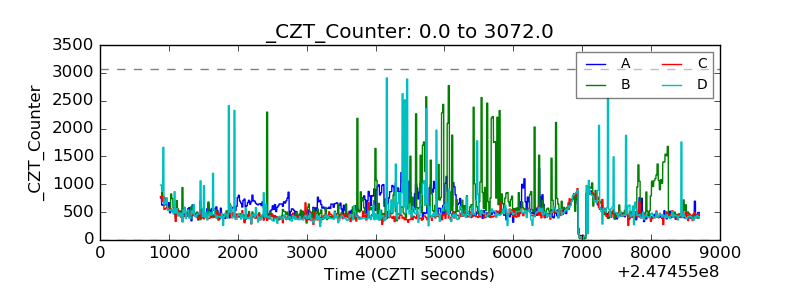 |
| +2.5 Volts monitor | 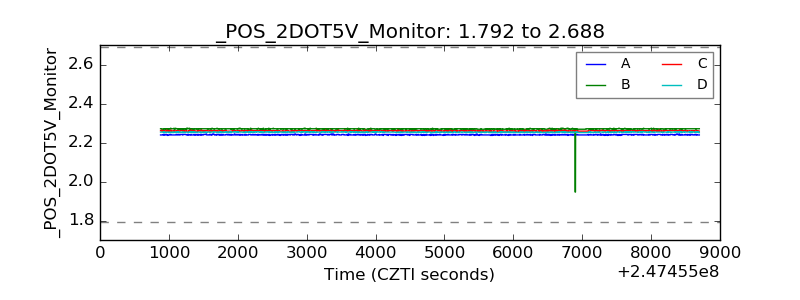 |
| +5 Volts monitor |  |
| _ROLL_ROT | 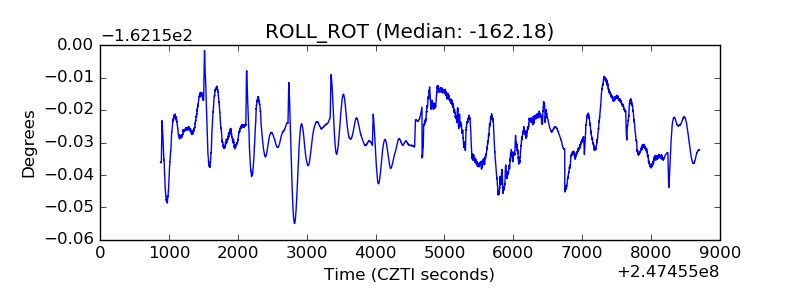 |
| _Roll_DEC | 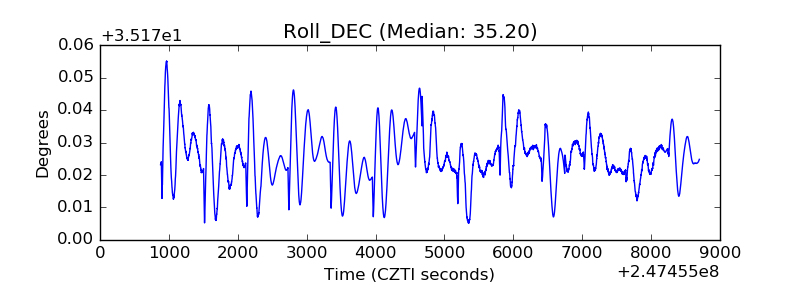 |
| _Roll_RA | 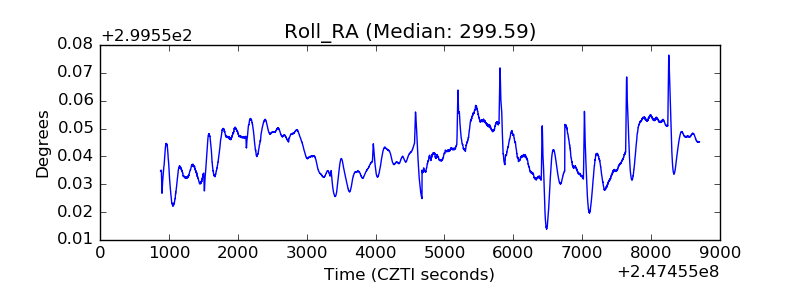 |
| Veto Counter | 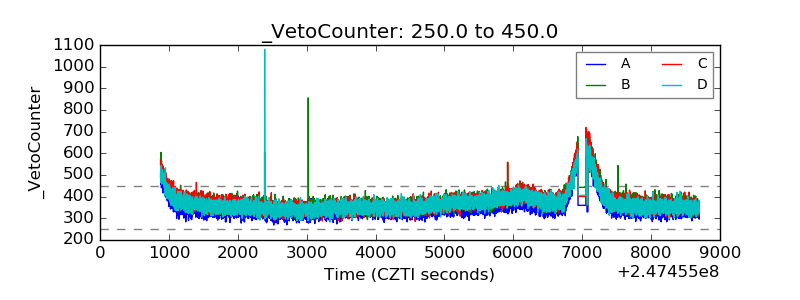 |