| Param | Original file | Final file |
|---|---|---|
| Filename | modeM0/AS1G08_062T01_9000001660_11368cztM0_level2.evt | modeM0/AS1G08_062T01_9000001660_11368cztM0_level2_quad_clean.evt |
| Size (bytes) | 549,403,200 | 79,519,680 |
| Size | 524.0 MB | 75.8 MB |
| Events in quadrant A | 3,503,045 | 480,228 |
| Events in quadrant B | 4,803,339 | 465,915 |
| Events in quadrant C | 3,343,402 | 481,373 |
| Events in quadrant D | 4,477,615 | 456,144 |
| Mode M0 | |||
|---|---|---|---|
| Quadrant | BADHDUFLAG | Total packets | Discarded packets |
| A | 0 | 15500 | 1 |
| B | 0 | 19236 | 0 |
| C | 0 | 15279 | 0 |
| D | 0 | 18480 | 0 |
| Mode SS | |||
|---|---|---|---|
| Quadrant | BADHDUFLAG | Total packets | Discarded packets |
| A | 0 | 150 | 0 |
| B | 0 | 150 | 0 |
| C | 0 | 150 | 0 |
| D | 0 | 150 | 0 |
| Mode M9 | |||
|---|---|---|---|
| Quadrant | BADHDUFLAG | Total packets | Discarded packets |
| A | 0 | 4 | 0 |
| B | 0 | 4 | 0 |
| C | 0 | 4 | 0 |
| D | 0 | 4 | 0 |
| Quadrant | Total seconds | Saturated seconds | Saturation percentage |
|---|---|---|---|
| A | 7536 | 42 | 0.557325% |
| B | 7536 | 337 | 4.471868% |
| C | 7536 | 23 | 0.305202% |
| D | 7536 | 252 | 3.343949% |
Noise dominated data is calculated using 1-second bins in cleaned event files. If a bin has >2000 counts, and if more than 50% of those come from <1% of pixels, then it is considered to be noise-dominated and hence unusable.
| Quadrant | # 1 sec bins | Bins with >0 counts | Bins with >2000 counts | High rate bins dominated by noise | Noise dominated (total time) | Noise dominated (detector-on time) | Marked lightcurve |
|---|---|---|---|---|---|---|---|
| A | 7936 | 7537 | 0 | 0 | 0.00% | 0.00% | 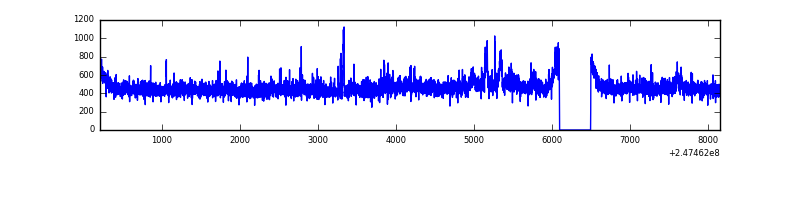 |
| B | 7936 | 7537 | 177 | 177 | 2.23% | 2.35% | 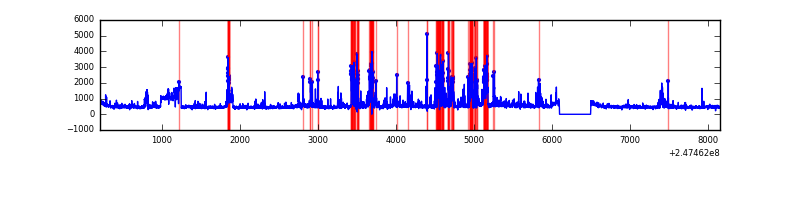 |
| C | 7936 | 7537 | 0 | 0 | 0.00% | 0.00% | 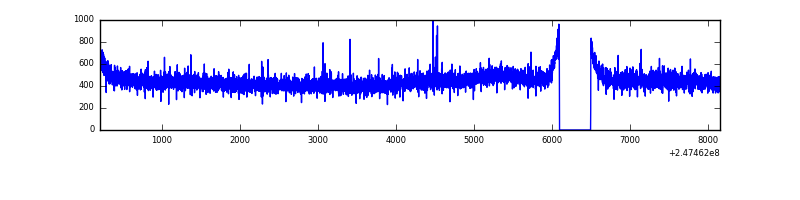 |
| D | 7936 | 7537 | 179 | 179 | 2.26% | 2.37% | 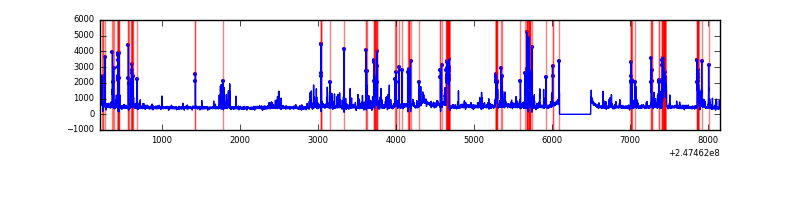 |
Top three noisy pixels from each quadrant. If the there are fewer than three noisy pixels in the level2.evt file, extra rows are filled as -1
| Pixel properties | Quadrant properties | ||||||
|---|---|---|---|---|---|---|---|
| Quadrant | DetID | PixID | Counts | Sigma | Mean | Median | Sigma |
| A | 15 | 174 | 63585 | 350.47 | 871 | 852 | 179.0 |
| A | 1 | 162 | 28592 | 154.97 | 871 | 852 | 179.0 |
| A | 1 | 178 | 15968 | 84.45 | 871 | 852 | 179.0 |
| B | 4 | 239 | 655932 | 3953.85 | 860 | 839 | 165.7 |
| B | 7 | 220 | 285369 | 1717.3 | 860 | 839 | 165.7 |
| B | 3 | 64 | 238610 | 1435.08 | 860 | 839 | 165.7 |
| C | 13 | 61 | 6200 | 26.65 | 855 | 860 | 200.4 |
| C | 8 | 222 | 5194 | 21.63 | 855 | 860 | 200.4 |
| C | 14 | 234 | 4711 | 19.22 | 855 | 860 | 200.4 |
| D | 2 | 14 | 326542 | 1652.46 | 829 | 810 | 197.1 |
| D | 13 | 152 | 262584 | 1328.0 | 829 | 810 | 197.1 |
| D | 10 | 253 | 179290 | 905.44 | 829 | 810 | 197.1 |
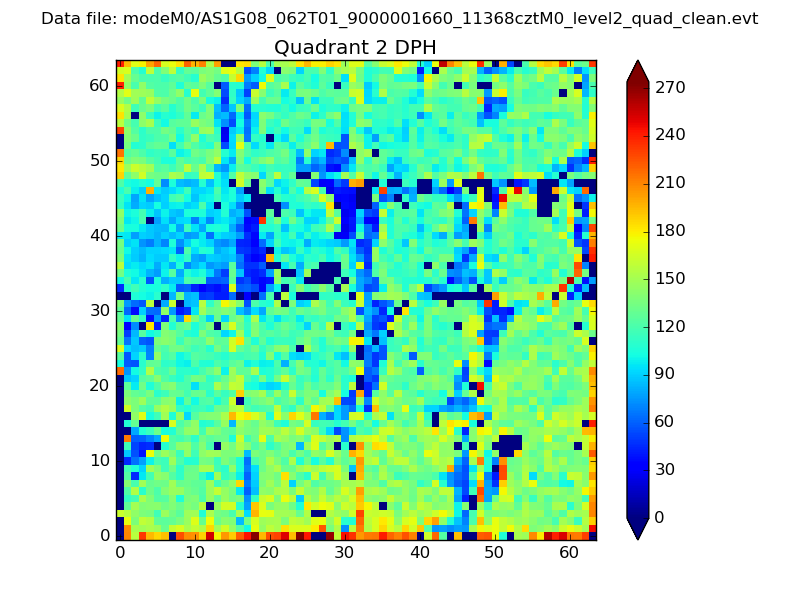
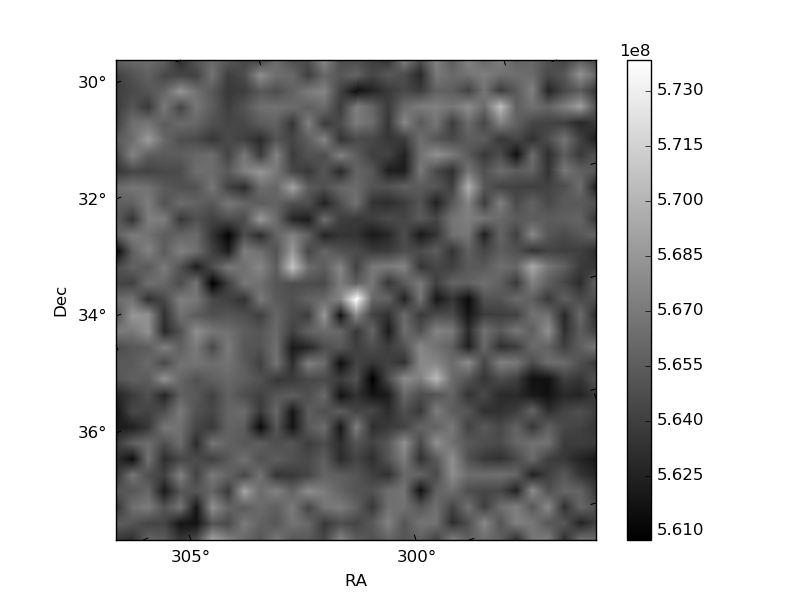
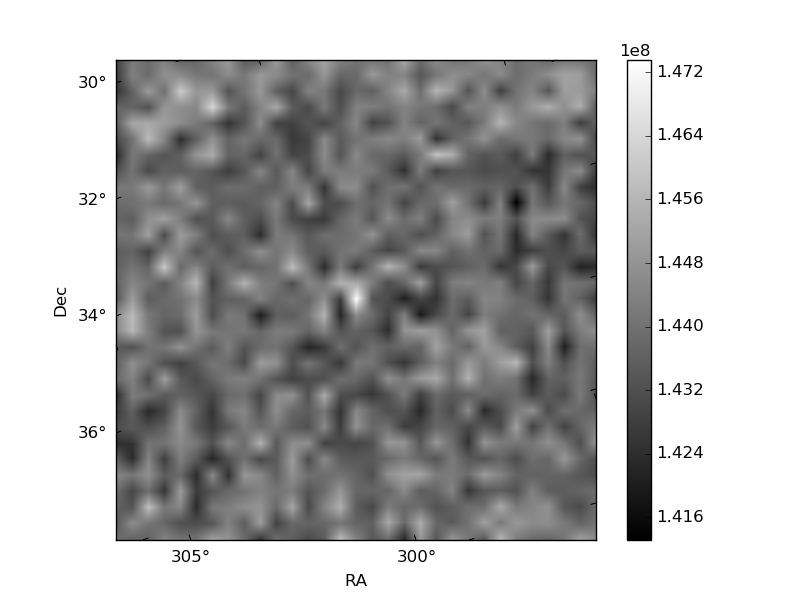
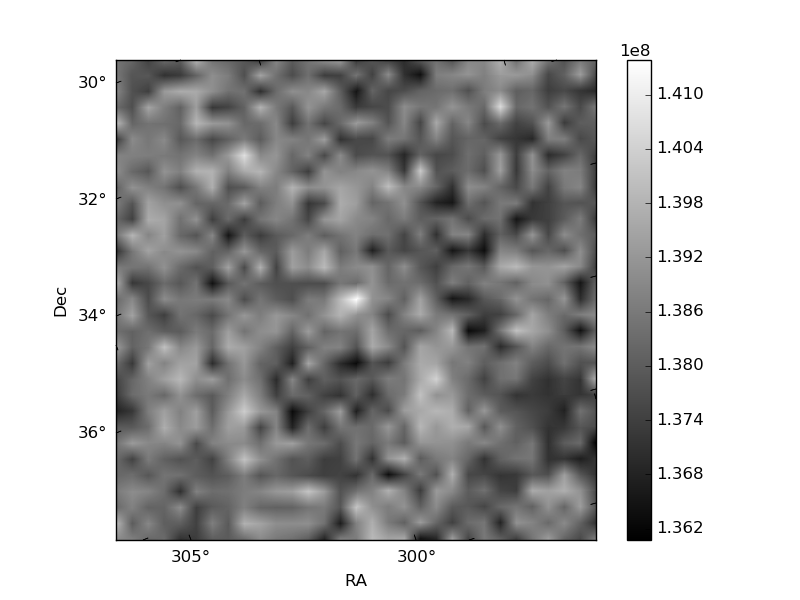
Histogram calculated using DETX and DETY for each event in the final _common_clean file
| Quadrant A | 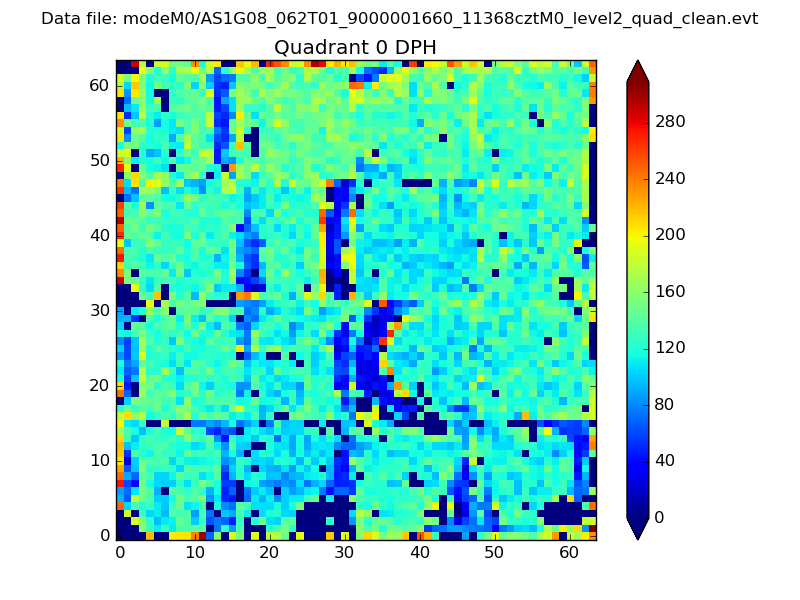 |
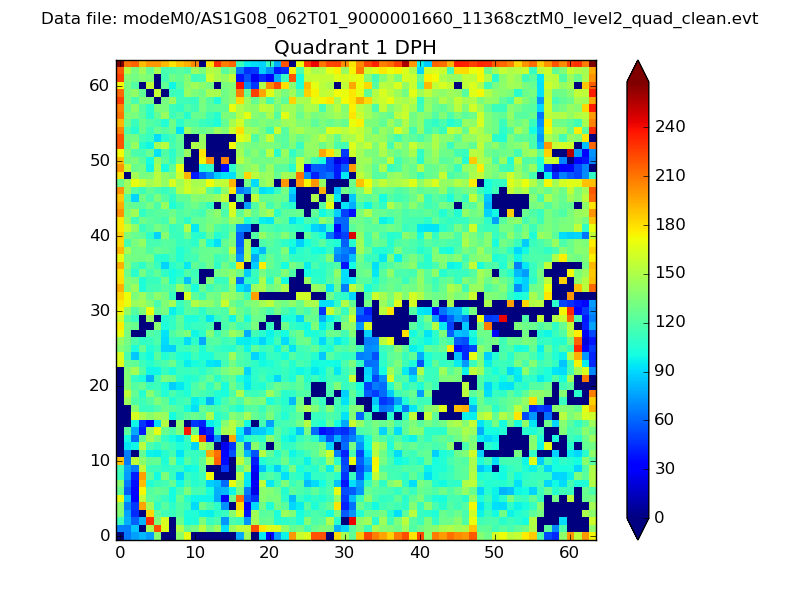 |
Quadrant B |
|---|---|---|---|
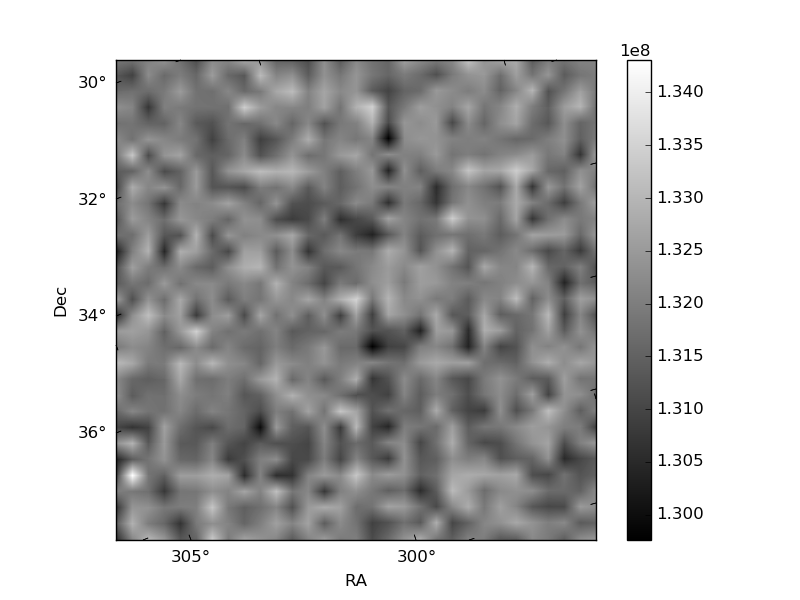
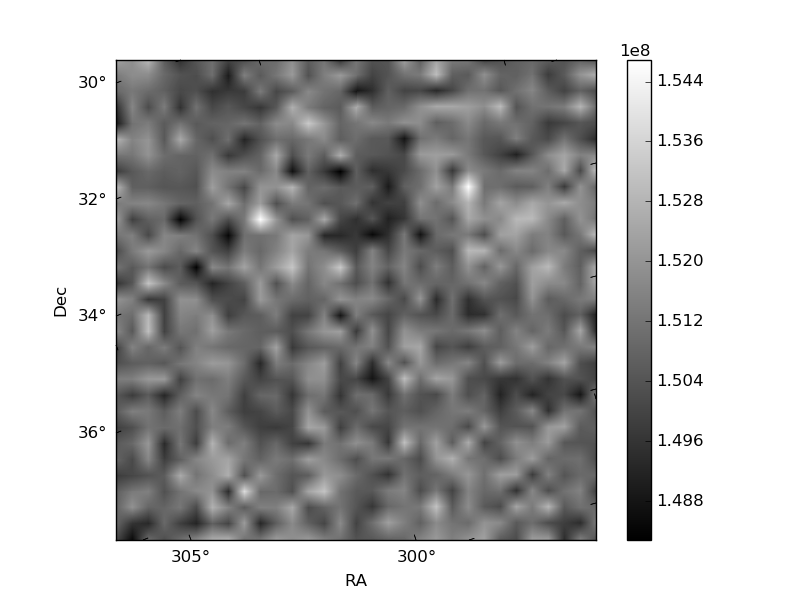
| Quadrant D | 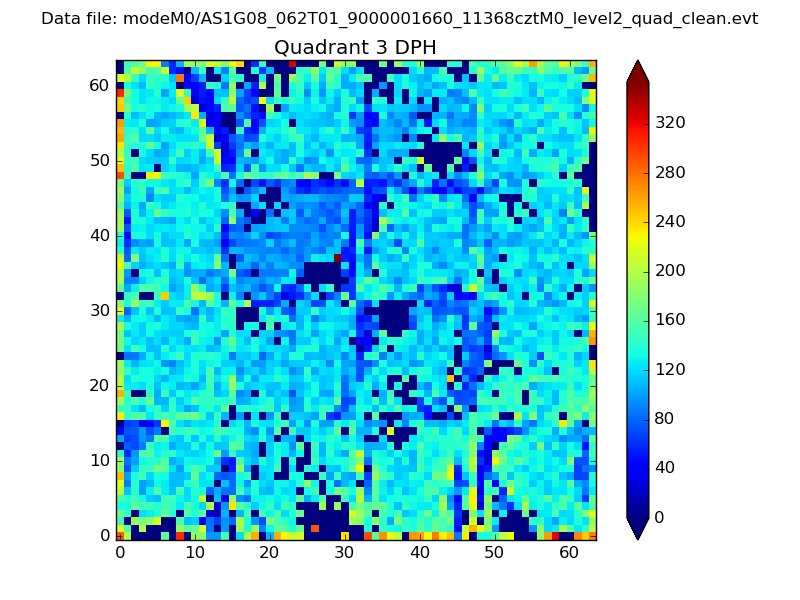 |
 |
Quadrant C |
| Plot type | Count rate plots | Images |
|---|---|---|
| Comparison with Poisson distribution Blue bars denote a histogram of data divided into 1 sec bins. Red curve is a Poisson curve with rate = median count rate of data. |
 |
 |
| Quadrant-wise count rates Data is divided into 100 sec bins |
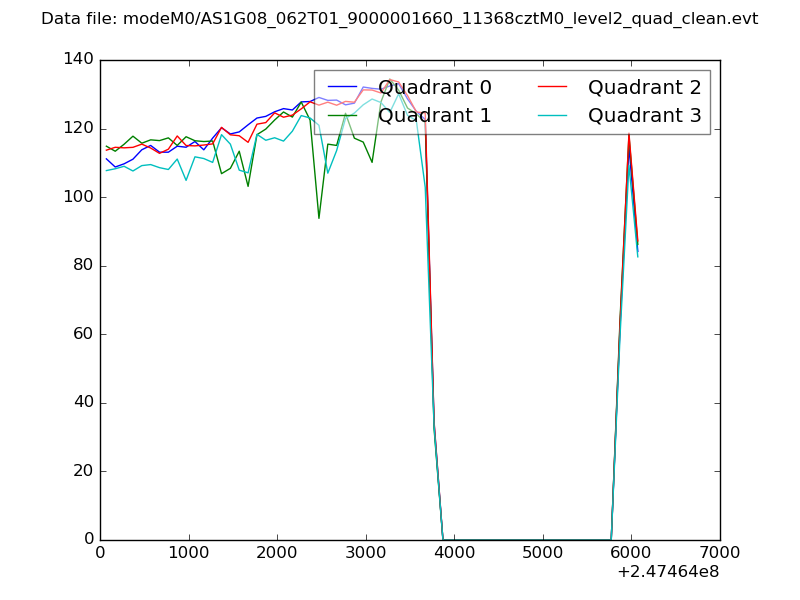 |
|
| Module-wise count rates for Quadrant A Data is divided into 100 sec bins |
 |
 |
| Module-wise count rates for Quadrant B Data is divided into 100 sec bins |
 |
 |
| Module-wise count rates for Quadrant C Data is divided into 100 sec bins |
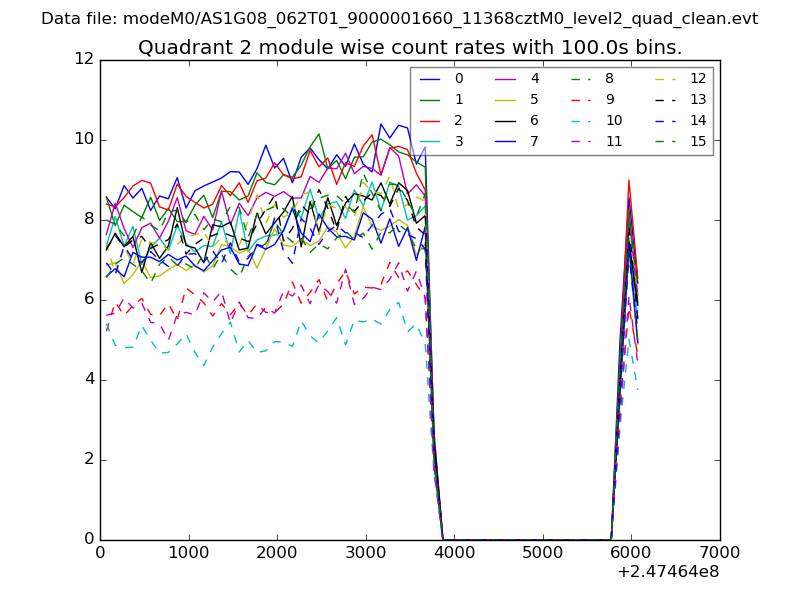 |
 |
| Module-wise count rates for Quadrant D Data is divided into 100 sec bins |
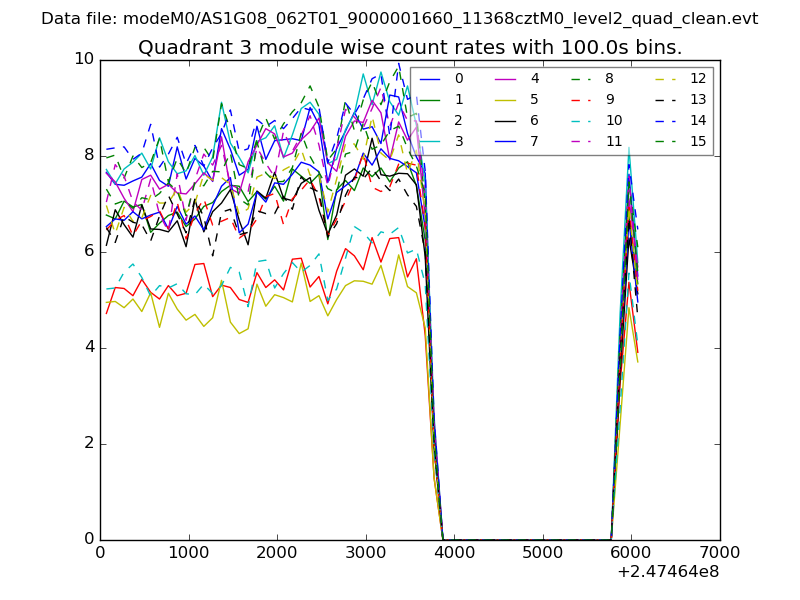 |
 |
| Parameter | Plot |
|---|---|
| CZT HV Monitor | 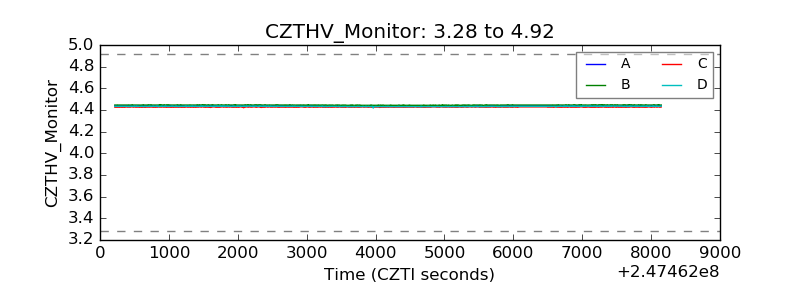 |
| D_VDD | 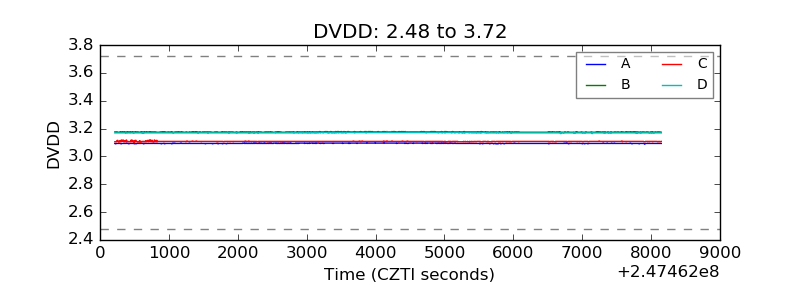 |
| Temperature 1 | 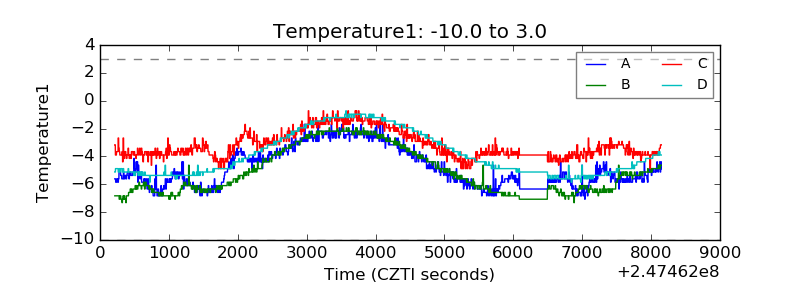 |
| Veto HV Monitor | 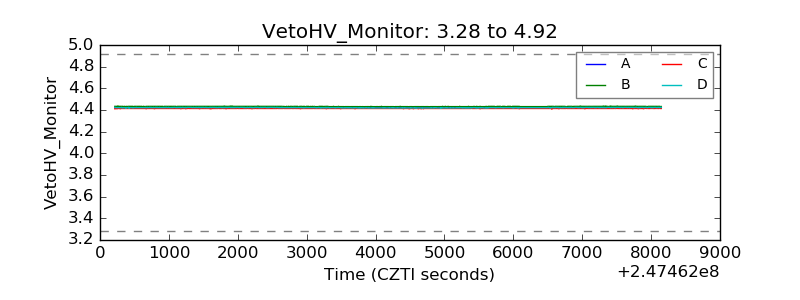 |
| Veto LLD | 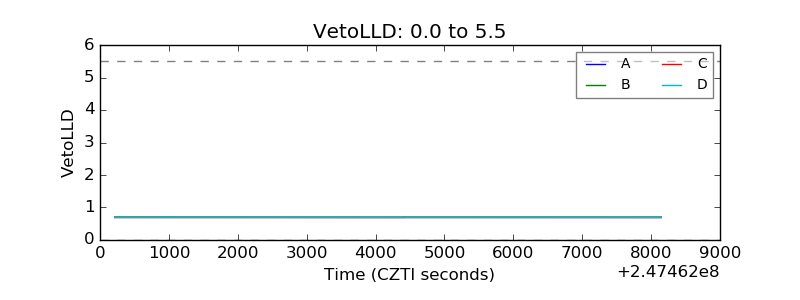 |
| Alpha Counter | 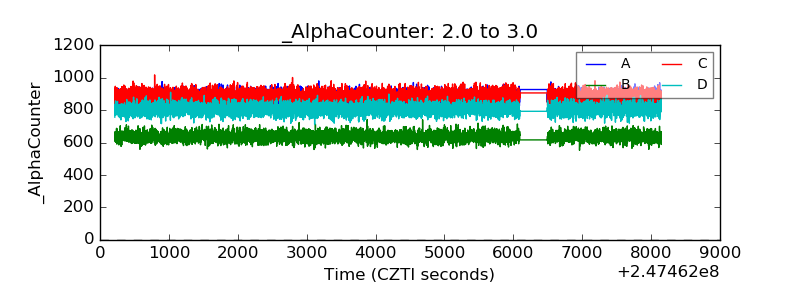 |
| _CPM_Rate | 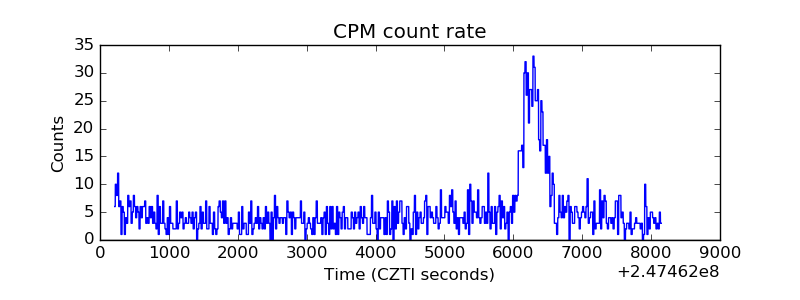 |
| CZT Counter | 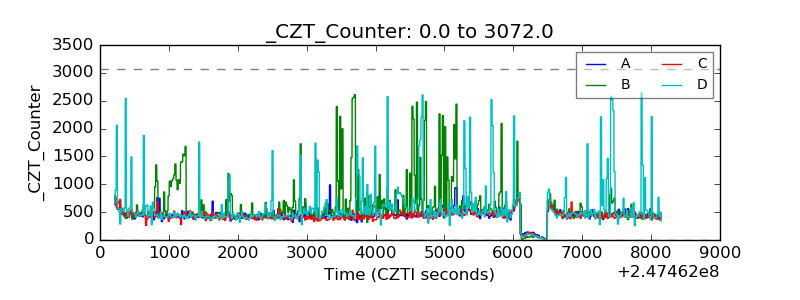 |
| +2.5 Volts monitor |  |
| +5 Volts monitor |  |
| _ROLL_ROT |  |
| _Roll_DEC |  |
| _Roll_RA | 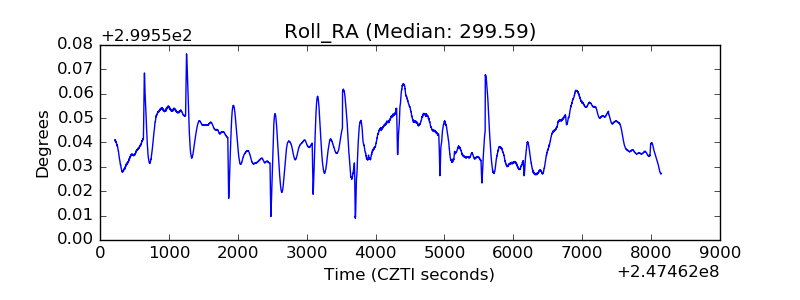 |
| Veto Counter | 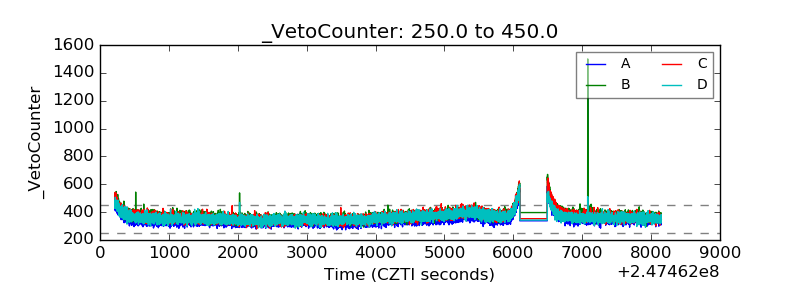 |