| Param | Original file | Final file |
|---|---|---|
| Filename | modeM0/AS1G08_062T01_9000001660_11370cztM0_level2.evt | modeM0/AS1G08_062T01_9000001660_11370cztM0_level2_quad_clean.evt |
| Size (bytes) | 967,377,600 | 159,649,920 |
| Size | 922.6 MB | 152.3 MB |
| Events in quadrant A | 6,631,038 | 1,010,879 |
| Events in quadrant B | 8,083,700 | 989,014 |
| Events in quadrant C | 5,501,126 | 1,013,329 |
| Events in quadrant D | 8,237,191 | 958,986 |
| Mode M0 | |||
|---|---|---|---|
| Quadrant | BADHDUFLAG | Total packets | Discarded packets |
| A | 0 | 28012 | 3 |
| B | 0 | 32068 | 2 |
| C | 0 | 25226 | 2 |
| D | 0 | 32741 | 2 |
| Mode SS | |||
|---|---|---|---|
| Quadrant | BADHDUFLAG | Total packets | Discarded packets |
| A | 0 | 252 | 0 |
| B | 0 | 252 | 0 |
| C | 0 | 252 | 0 |
| D | 0 | 252 | 0 |
| Mode M9 | |||
|---|---|---|---|
| Quadrant | BADHDUFLAG | Total packets | Discarded packets |
| A | 0 | 14 | 0 |
| B | 0 | 14 | 0 |
| C | 0 | 14 | 0 |
| D | 0 | 14 | 0 |
| Quadrant | Total seconds | Saturated seconds | Saturation percentage |
|---|---|---|---|
| A | 12489 | 115 | 0.920810% |
| B | 12489 | 568 | 4.548002% |
| C | 12489 | 61 | 0.488430% |
| D | 12489 | 782 | 6.261510% |
Noise dominated data is calculated using 1-second bins in cleaned event files. If a bin has >2000 counts, and if more than 50% of those come from <1% of pixels, then it is considered to be noise-dominated and hence unusable.
| Quadrant | # 1 sec bins | Bins with >0 counts | Bins with >2000 counts | High rate bins dominated by noise | Noise dominated (total time) | Noise dominated (detector-on time) | Marked lightcurve |
|---|---|---|---|---|---|---|---|
| A | 13794 | 12491 | 2 | 2 | 0.01% | 0.02% | 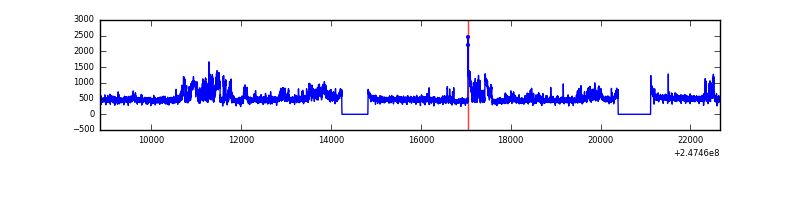 |
| B | 13794 | 12491 | 329 | 329 | 2.39% | 2.63% | 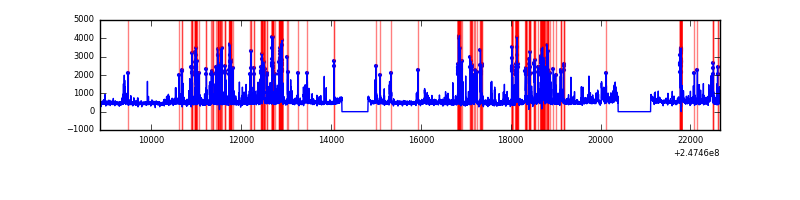 |
| C | 13794 | 12491 | 0 | 0 | 0.00% | 0.00% | 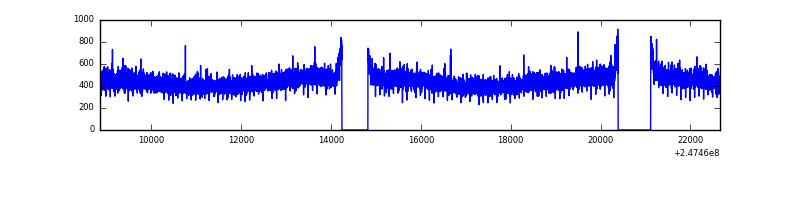 |
| D | 13794 | 12491 | 469 | 469 | 3.40% | 3.75% | 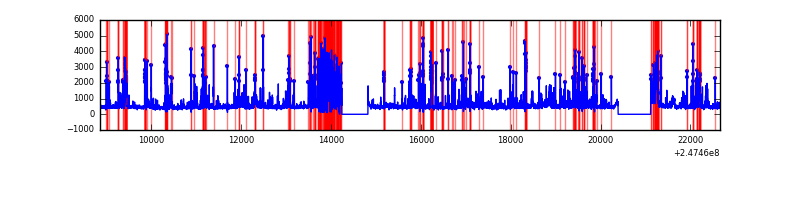 |
Top three noisy pixels from each quadrant. If the there are fewer than three noisy pixels in the level2.evt file, extra rows are filled as -1
| Pixel properties | Quadrant properties | ||||||
|---|---|---|---|---|---|---|---|
| Quadrant | DetID | PixID | Counts | Sigma | Mean | Median | Sigma |
| A | 15 | 174 | 936091 | 3146.9 | 1448 | 1415 | 297.0 |
| A | 1 | 162 | 37875 | 122.75 | 1448 | 1415 | 297.0 |
| A | 1 | 178 | 21693 | 68.27 | 1448 | 1415 | 297.0 |
| B | 4 | 239 | 1450116 | 5303.91 | 1425 | 1387 | 273.1 |
| B | 3 | 64 | 573495 | 2094.53 | 1425 | 1387 | 273.1 |
| B | 11 | 51 | 283789 | 1033.89 | 1425 | 1387 | 273.1 |
| C | 13 | 61 | 10123 | 26.64 | 1410 | 1417 | 326.9 |
| C | 12 | 4 | 3747 | 7.13 | 1410 | 1417 | 326.9 |
| C | 3 | 202 | 3443 | 6.2 | 1410 | 1417 | 326.9 |
| D | 2 | 14 | 826000 | 2583.26 | 1347 | 1315 | 319.2 |
| D | 10 | 253 | 779118 | 2436.41 | 1347 | 1315 | 319.2 |
| D | 2 | 120 | 332511 | 1037.45 | 1347 | 1315 | 319.2 |
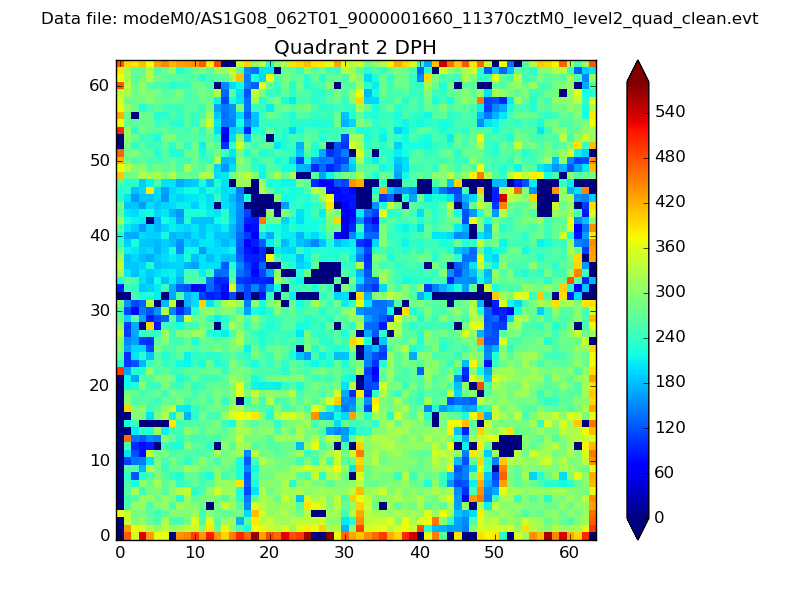
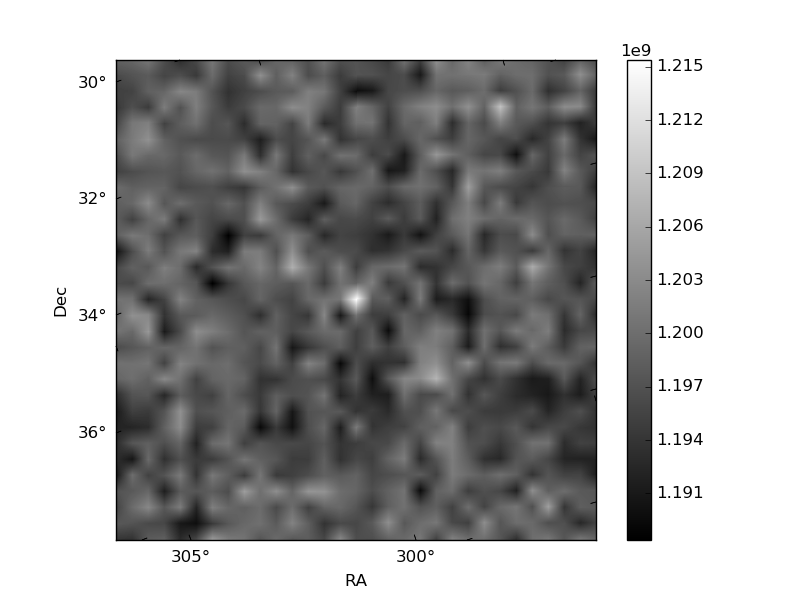
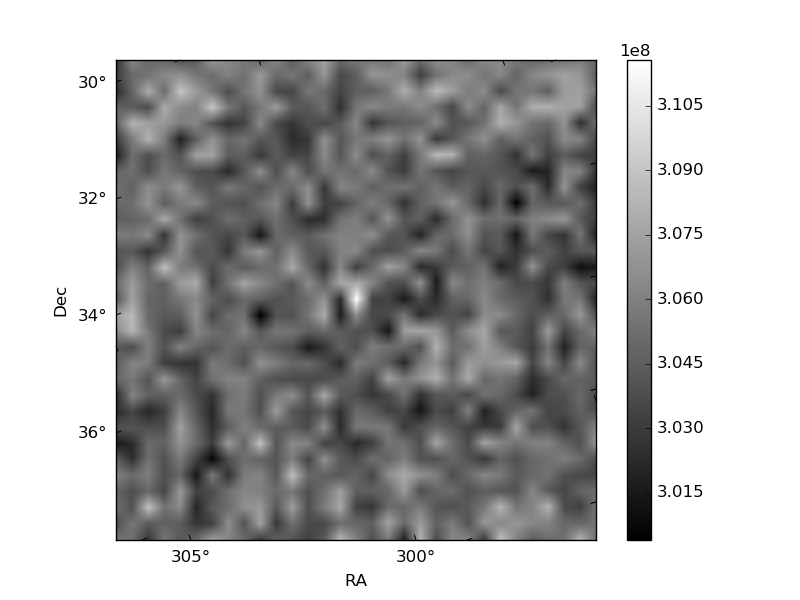
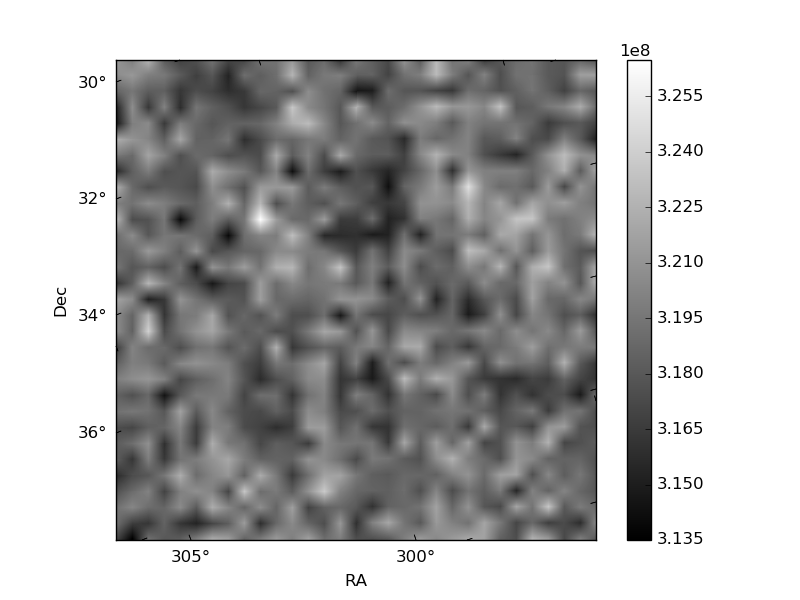
Histogram calculated using DETX and DETY for each event in the final _common_clean file
| Quadrant A | 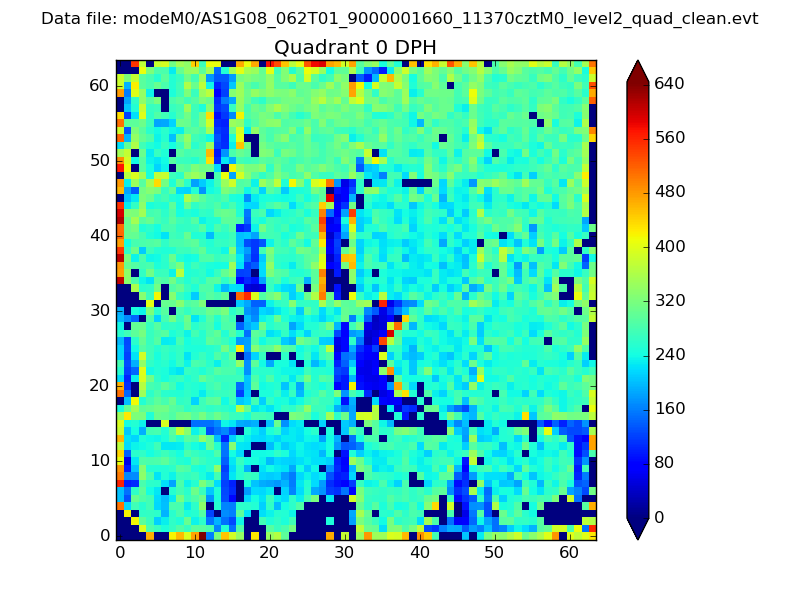 |
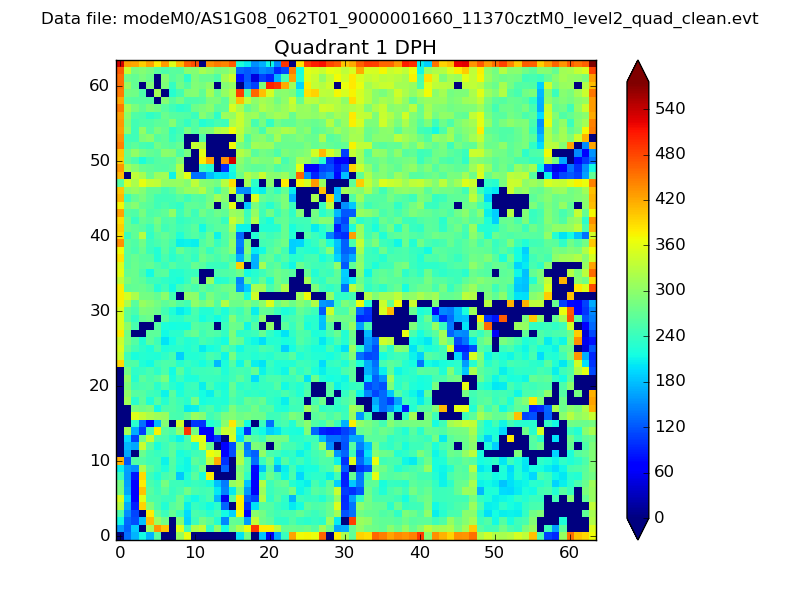 |
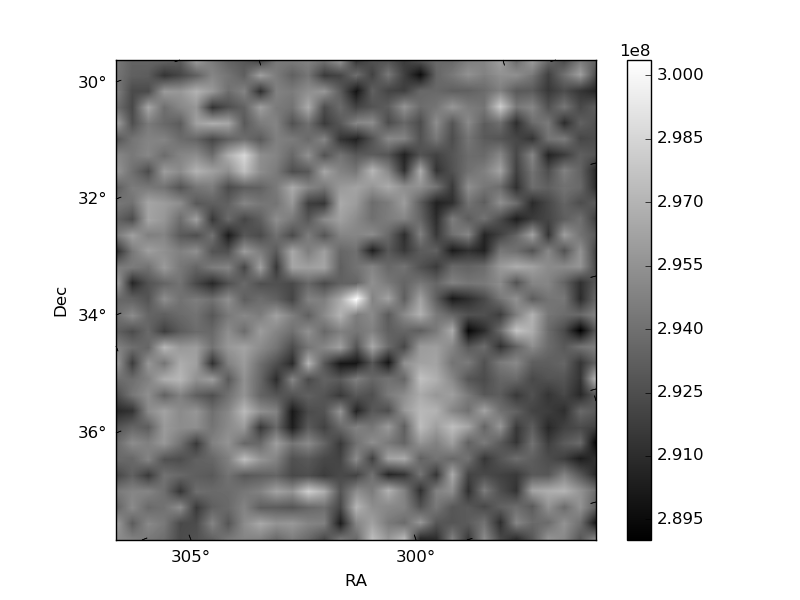
Quadrant B |
|---|---|---|---|
| Quadrant D | 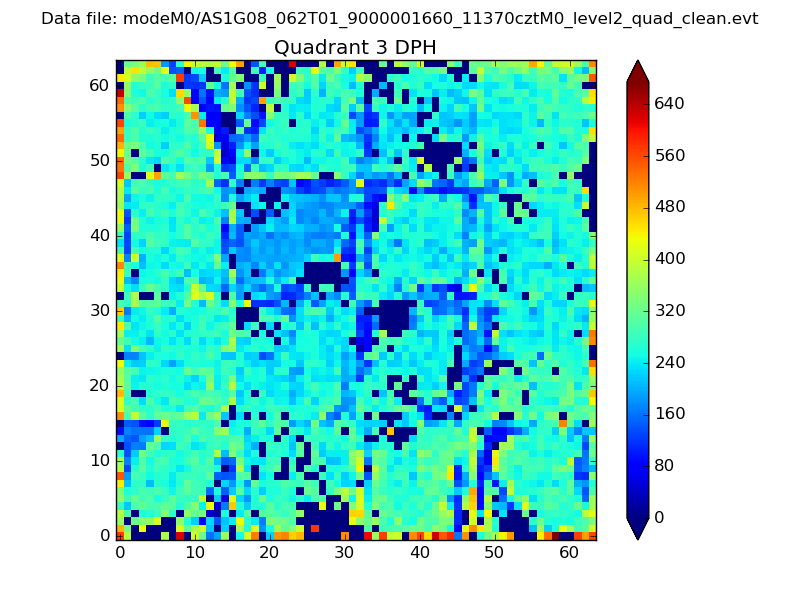 |
 |
Quadrant C |
| Plot type | Count rate plots | Images |
|---|---|---|
| Comparison with Poisson distribution Blue bars denote a histogram of data divided into 1 sec bins. Red curve is a Poisson curve with rate = median count rate of data. |
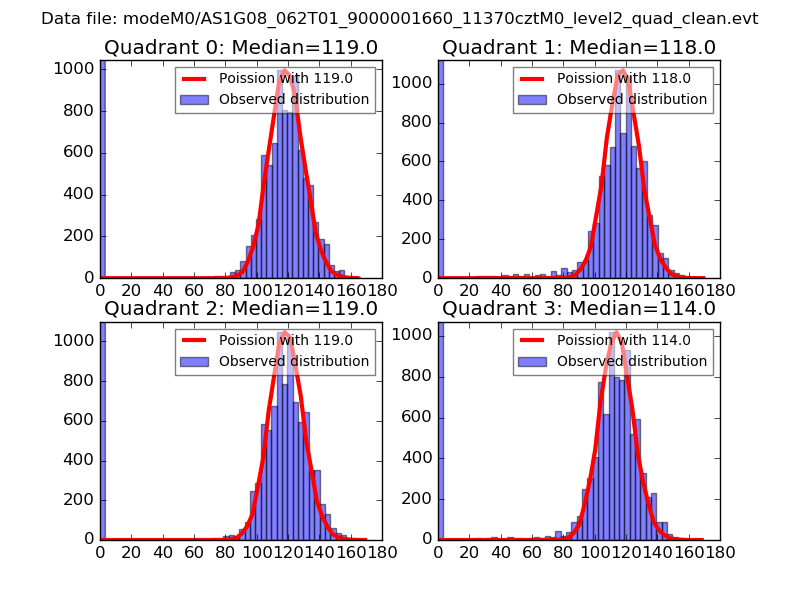 |
 |
| Quadrant-wise count rates Data is divided into 100 sec bins |
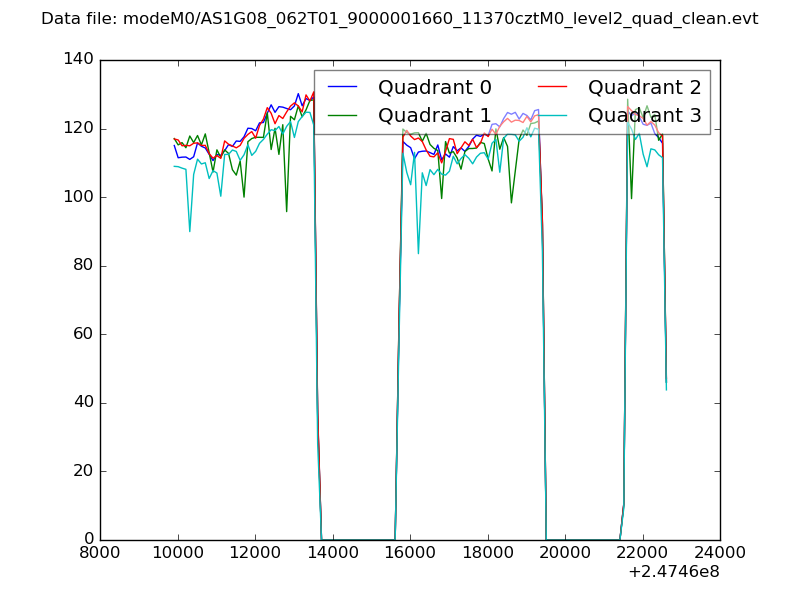 |
|
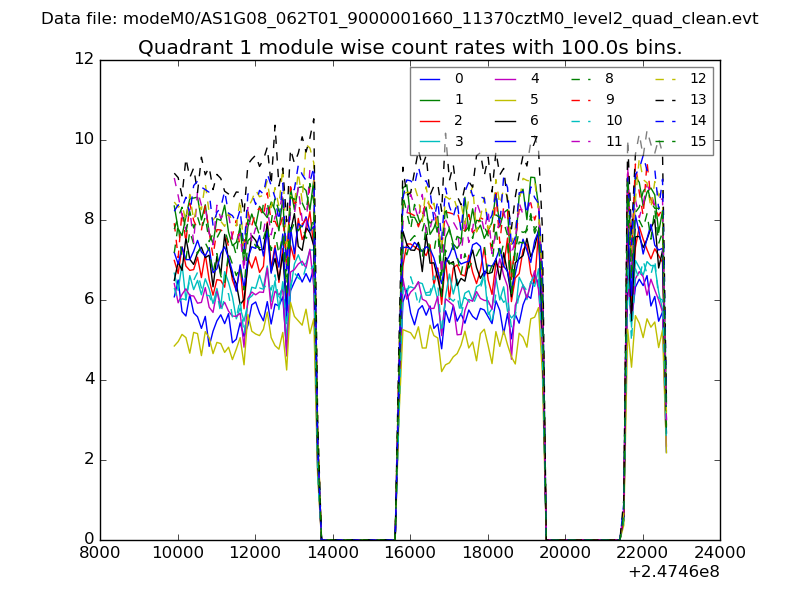
| Module-wise count rates for Quadrant A Data is divided into 100 sec bins |
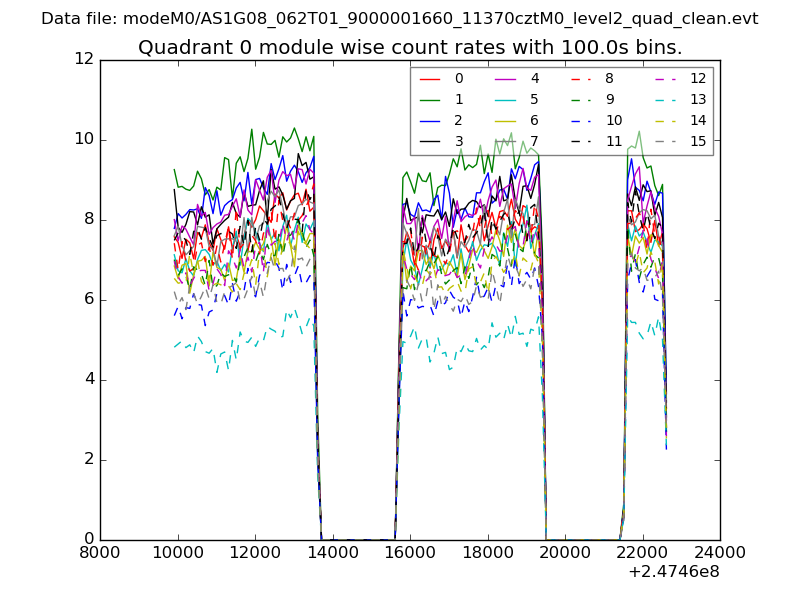 |
 |
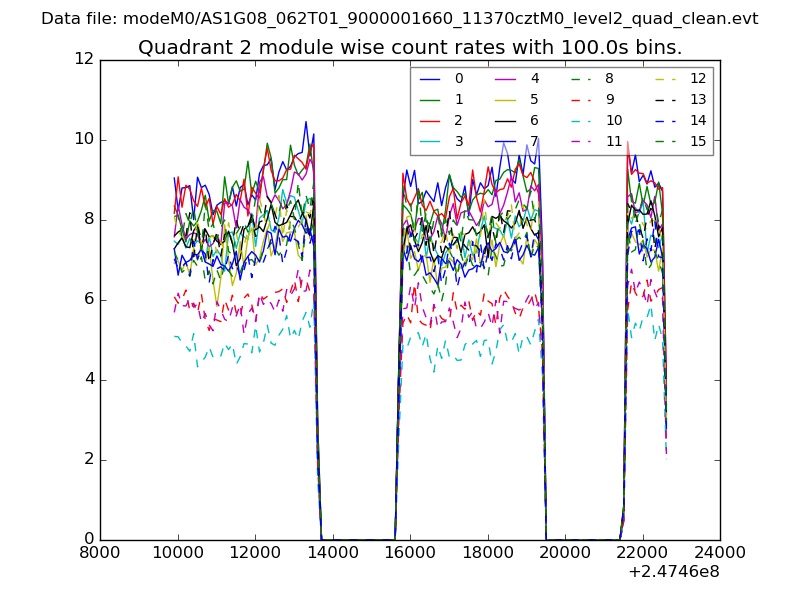
| Module-wise count rates for Quadrant B Data is divided into 100 sec bins |
 |
 |
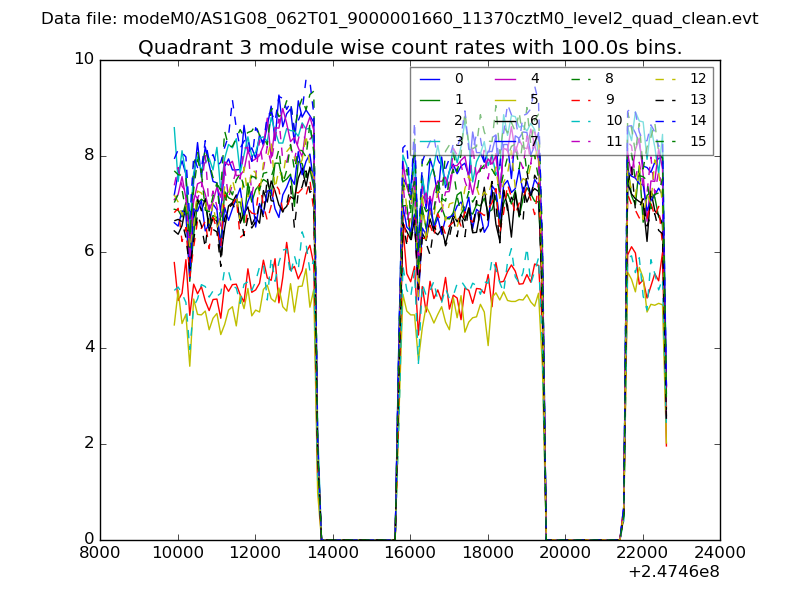
| Module-wise count rates for Quadrant C Data is divided into 100 sec bins |
 |
 |
| Module-wise count rates for Quadrant D Data is divided into 100 sec bins |
 |
 |
| Parameter | Plot |
|---|---|
| CZT HV Monitor | 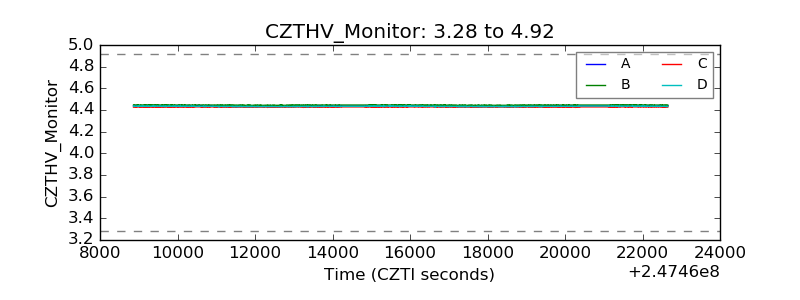 |
| D_VDD |  |
| Temperature 1 |  |
| Veto HV Monitor |  |
| Veto LLD | 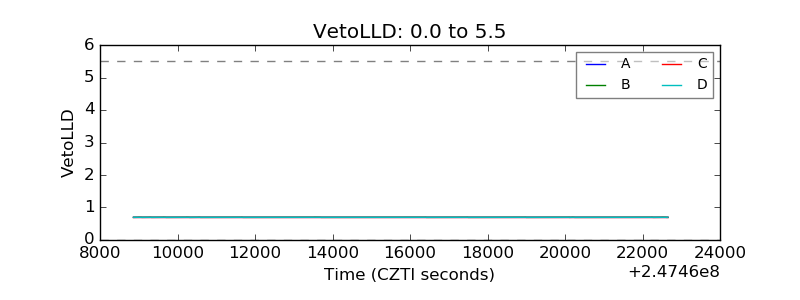 |
| Alpha Counter | 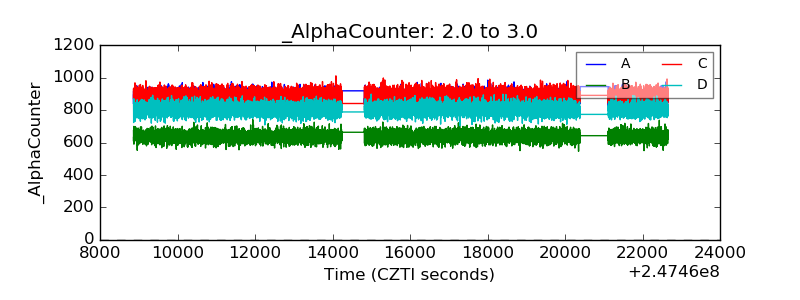 |
| _CPM_Rate | 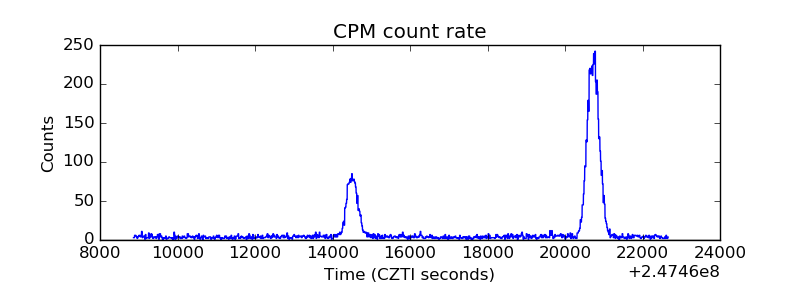 |
| CZT Counter | 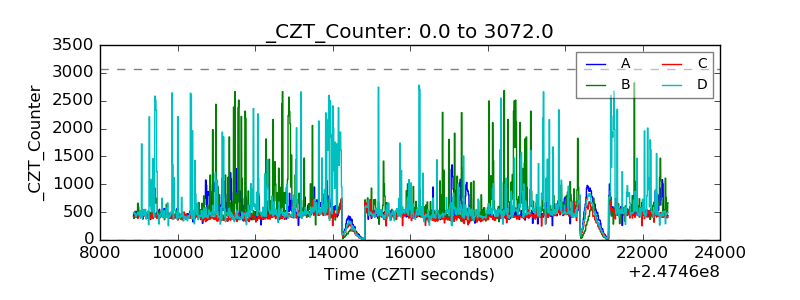 |
| +2.5 Volts monitor | 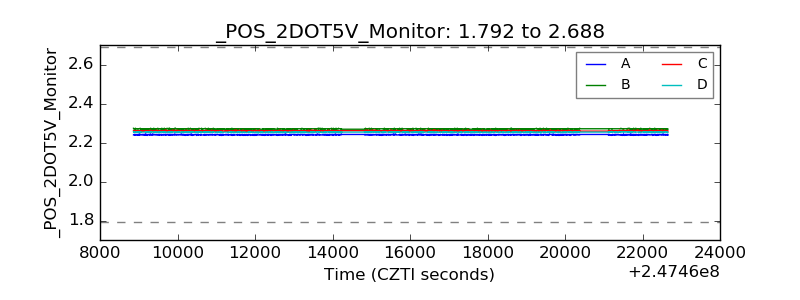 |
| +5 Volts monitor |  |
| _ROLL_ROT | 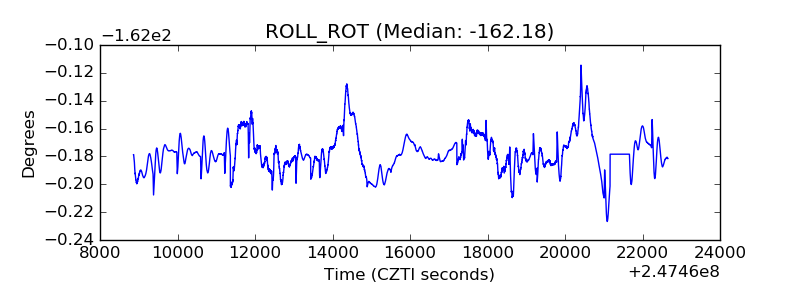 |
| _Roll_DEC | 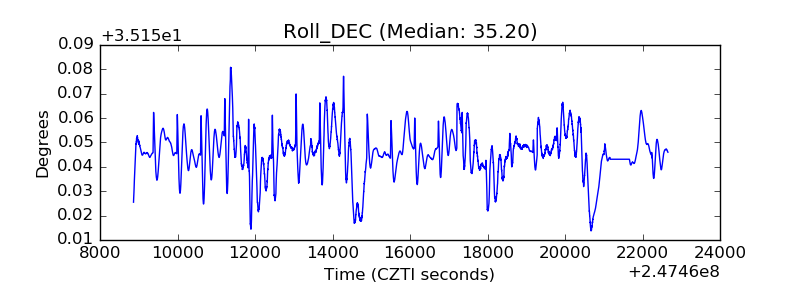 |
| _Roll_RA | 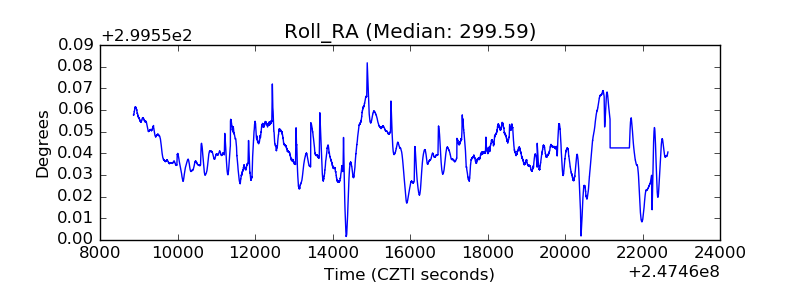 |
| Veto Counter | 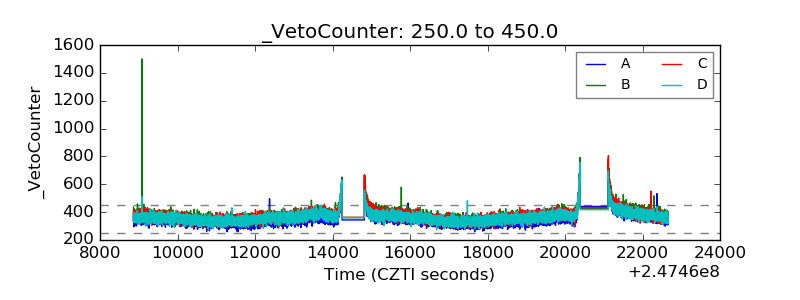 |