| Param | Original file | Final file |
|---|---|---|
| Filename | modeM0/AS1G08_062T01_9000001660_11371cztM0_level2.evt | modeM0/AS1G08_062T01_9000001660_11371cztM0_level2_quad_clean.evt |
| Size (bytes) | 203,852,160 | 37,094,400 |
| Size | 194.4 MB | 35.4 MB |
| Events in quadrant A | 1,045,253 | 256,637 |
| Events in quadrant B | 2,844,574 | 210,787 |
| Events in quadrant C | 883,086 | 255,313 |
| Events in quadrant D | 1,250,401 | 242,233 |
| Mode M0 | |||
|---|---|---|---|
| Quadrant | BADHDUFLAG | Total packets | Discarded packets |
| A | 0 | 4602 | 0 |
| B | 0 | 9910 | 0 |
| C | 0 | 4361 | 0 |
| D | 0 | 5253 | 0 |
| Mode SS | |||
|---|---|---|---|
| Quadrant | BADHDUFLAG | Total packets | Discarded packets |
| A | 0 | 44 | 0 |
| B | 0 | 44 | 0 |
| C | 0 | 44 | 0 |
| D | 0 | 44 | 0 |
| Quadrant | Total seconds | Saturated seconds | Saturation percentage |
|---|---|---|---|
| A | 2178 | 2 | 0.091827% |
| B | 2178 | 683 | 31.359045% |
| C | 2178 | 0 | 0.000000% |
| D | 2178 | 61 | 2.800735% |
Noise dominated data is calculated using 1-second bins in cleaned event files. If a bin has >2000 counts, and if more than 50% of those come from <1% of pixels, then it is considered to be noise-dominated and hence unusable.
| Quadrant | # 1 sec bins | Bins with >0 counts | Bins with >2000 counts | High rate bins dominated by noise | Noise dominated (total time) | Noise dominated (detector-on time) | Marked lightcurve |
|---|---|---|---|---|---|---|---|
| A | 2178 | 2178 | 0 | 0 | 0.00% | 0.00% |  |
| B | 2178 | 2178 | 574 | 574 | 26.35% | 26.35% | 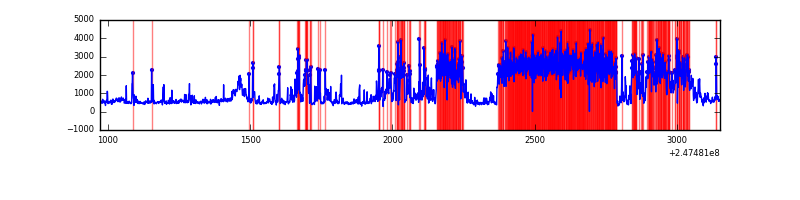 |
| C | 2178 | 2178 | 0 | 0 | 0.00% | 0.00% | 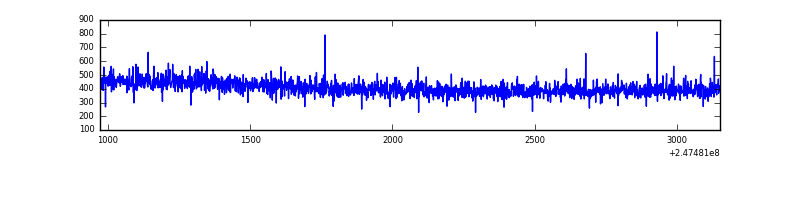 |
| D | 2178 | 2178 | 47 | 47 | 2.16% | 2.16% | 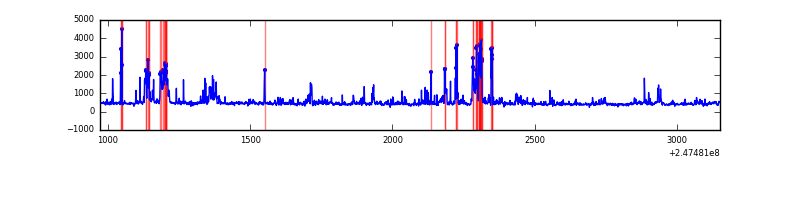 |
Top three noisy pixels from each quadrant. If the there are fewer than three noisy pixels in the level2.evt file, extra rows are filled as -1
| Pixel properties | Quadrant properties | ||||||
|---|---|---|---|---|---|---|---|
| Quadrant | DetID | PixID | Counts | Sigma | Mean | Median | Sigma |
| A | 15 | 174 | 60864 | 1201.43 | 239 | 233 | 50.5 |
| A | 13 | 210 | 32574 | 640.85 | 239 | 233 | 50.5 |
| A | 1 | 162 | 8740 | 168.56 | 239 | 233 | 50.5 |
| B | 4 | 239 | 1378076 | 33841.29 | 201 | 196 | 40.7 |
| B | 3 | 64 | 590541 | 14499.11 | 201 | 196 | 40.7 |
| B | 11 | 51 | 45742 | 1118.63 | 201 | 196 | 40.7 |
| C | 13 | 61 | 1670 | 26.87 | 226 | 227 | 53.7 |
| C | 14 | 234 | 758 | 9.89 | 226 | 227 | 53.7 |
| C | 3 | 202 | 538 | 5.79 | 226 | 227 | 53.7 |
| D | 10 | 253 | 163007 | 2809.53 | 225 | 219 | 57.9 |
| D | 2 | 14 | 85050 | 1464.08 | 225 | 219 | 57.9 |
| D | 13 | 152 | 37955 | 651.28 | 225 | 219 | 57.9 |
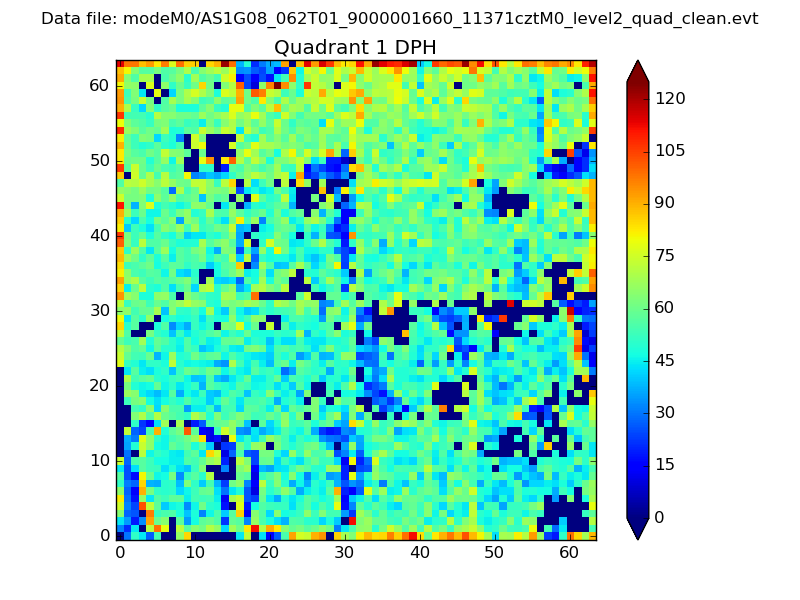
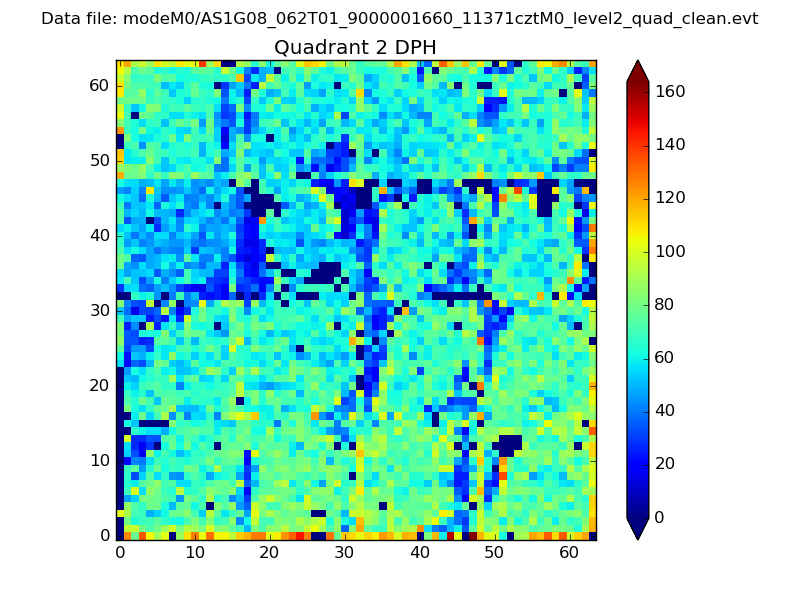
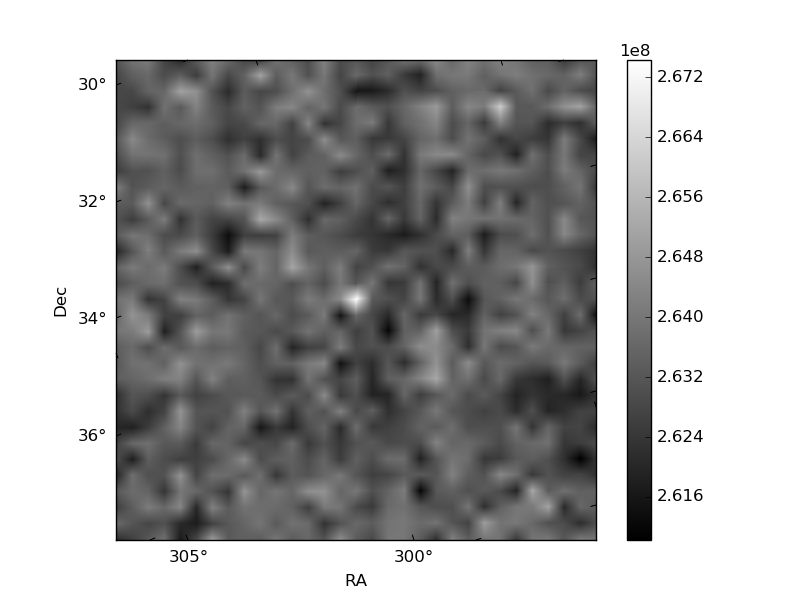
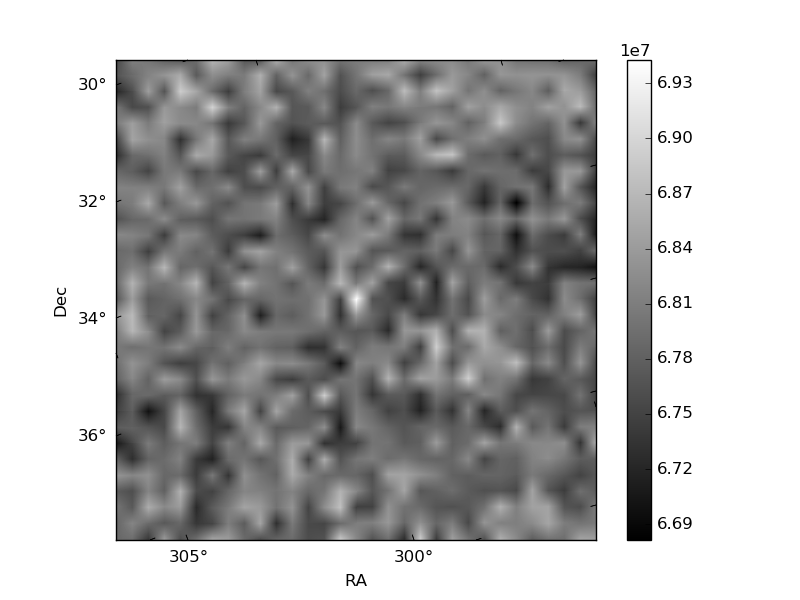
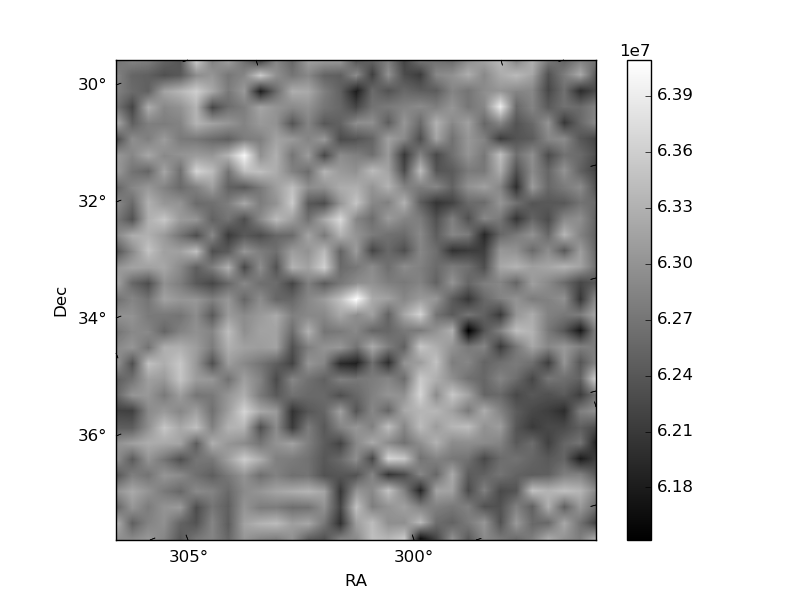
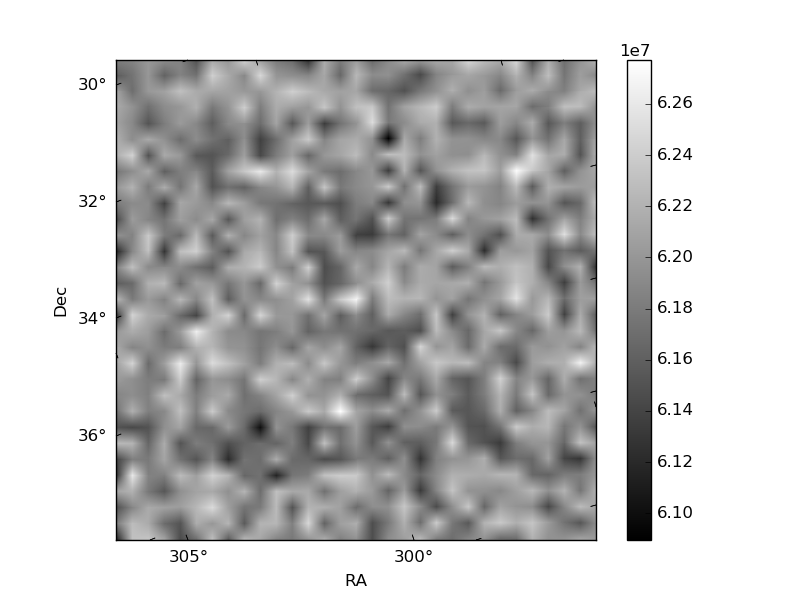
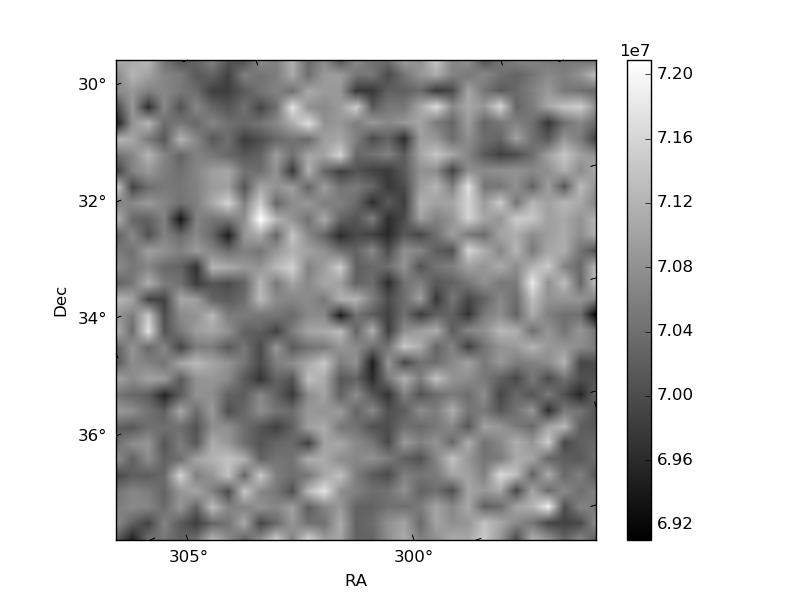
Histogram calculated using DETX and DETY for each event in the final _common_clean file
| Quadrant A | 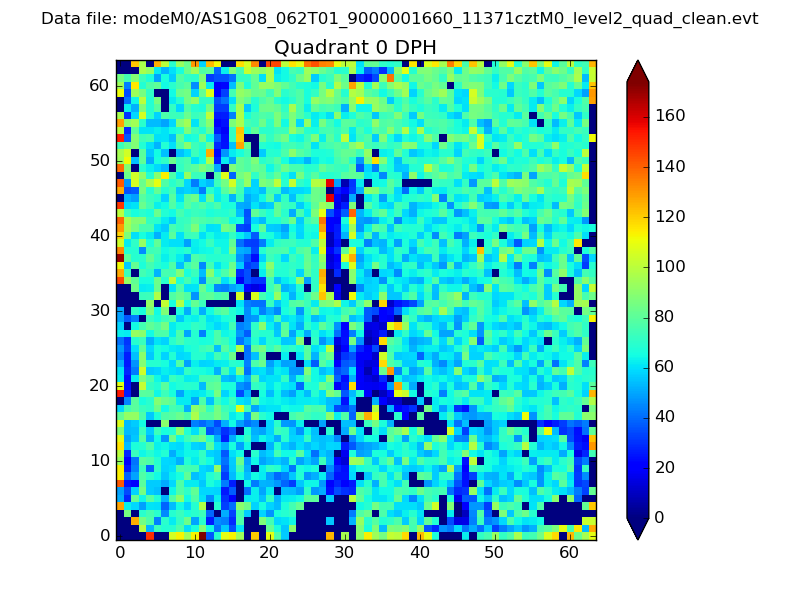 |
 |
Quadrant B |
|---|---|---|---|
| Quadrant D | 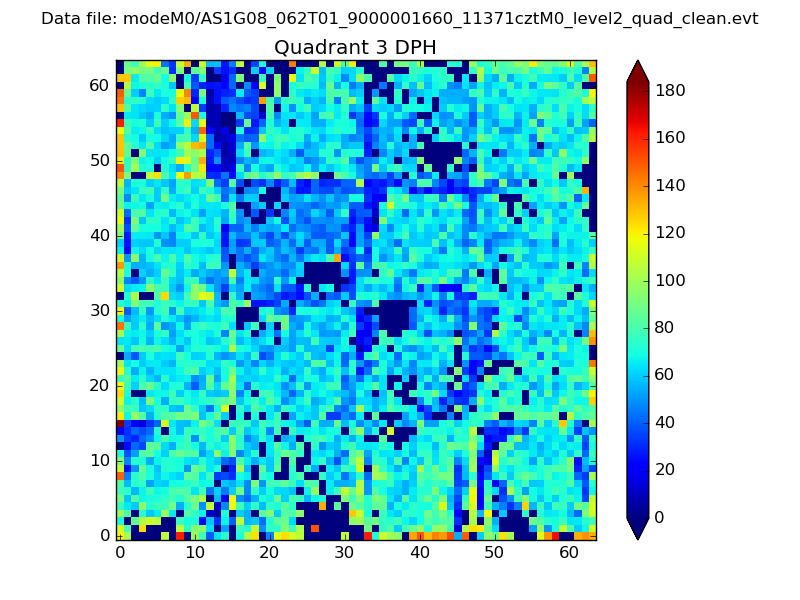 |
 |
Quadrant C |
| Plot type | Count rate plots | Images |
|---|---|---|
| Comparison with Poisson distribution Blue bars denote a histogram of data divided into 1 sec bins. Red curve is a Poisson curve with rate = median count rate of data. |
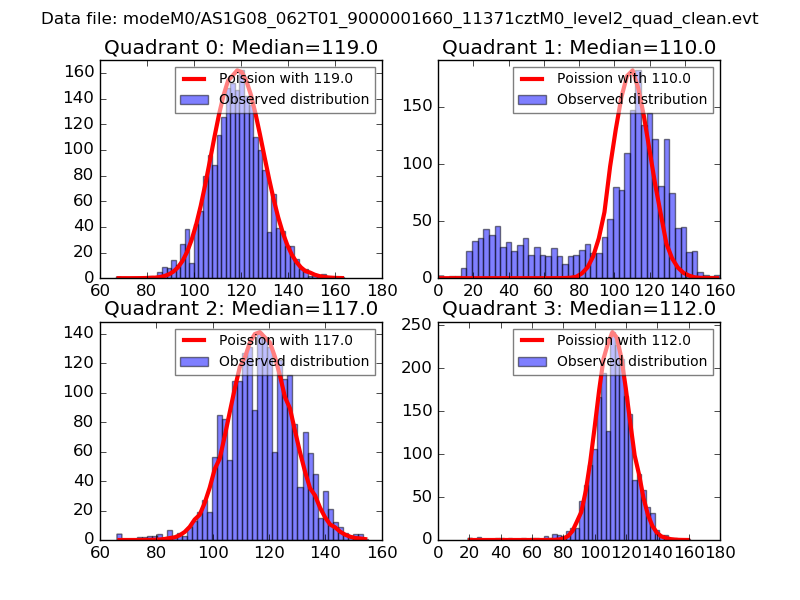 |
 |
| Quadrant-wise count rates Data is divided into 100 sec bins |
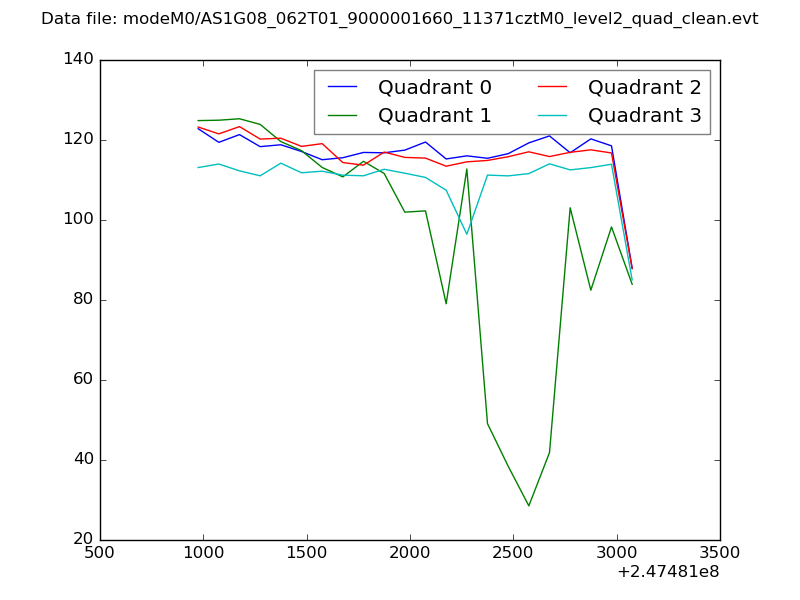 |
|
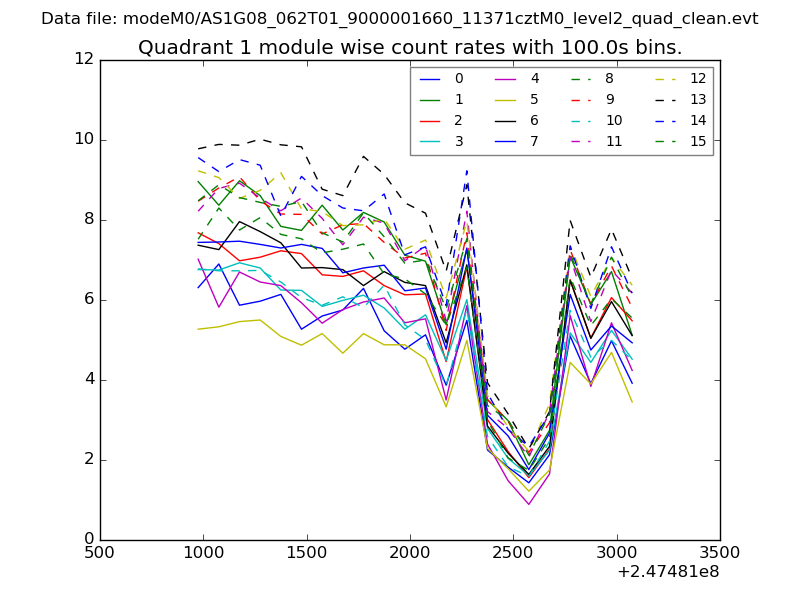
| Module-wise count rates for Quadrant A Data is divided into 100 sec bins |
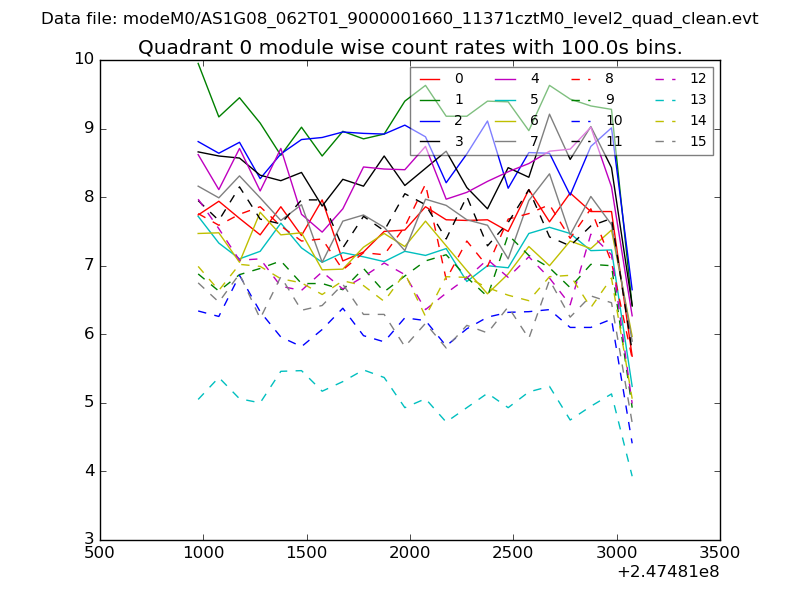 |
 |
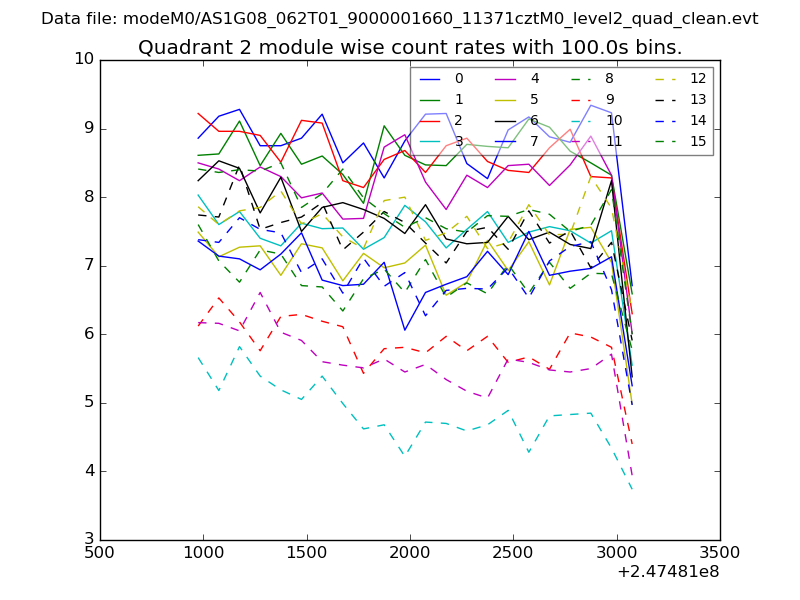
| Module-wise count rates for Quadrant B Data is divided into 100 sec bins |
 |
 |
| Module-wise count rates for Quadrant C Data is divided into 100 sec bins |
 |
 |
| Module-wise count rates for Quadrant D Data is divided into 100 sec bins |
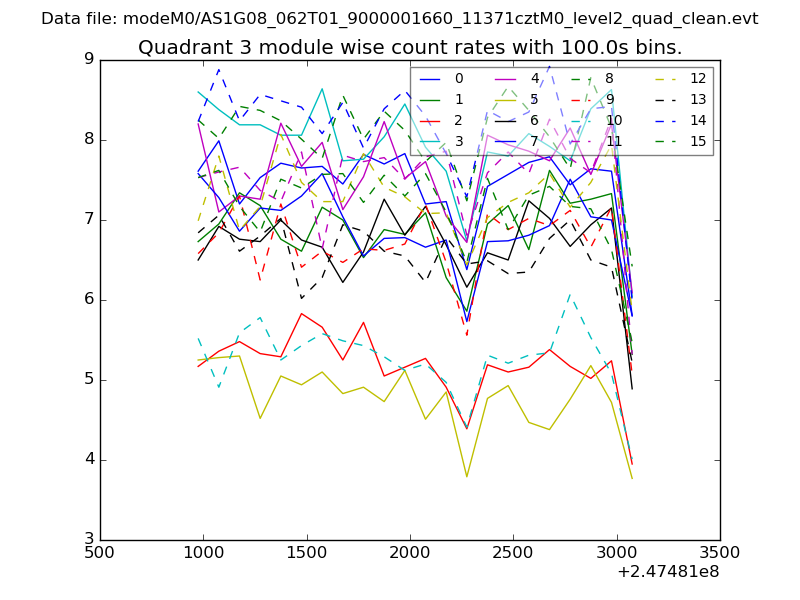 |
 |
| Parameter | Plot |
|---|---|
| CZT HV Monitor | 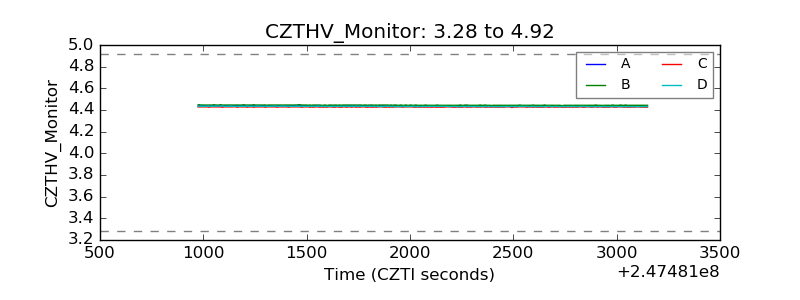 |
| D_VDD | 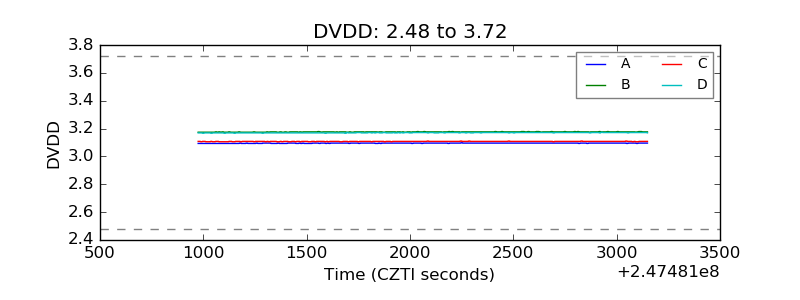 |
| Temperature 1 | 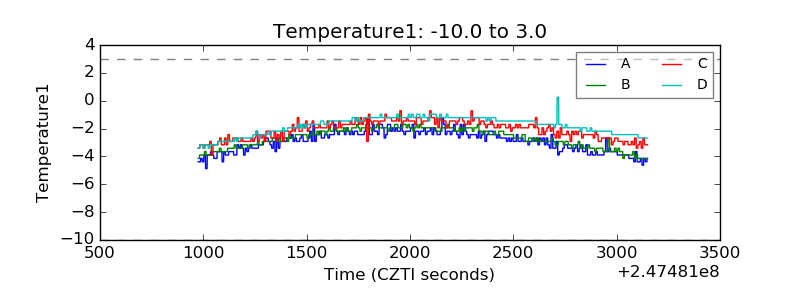 |
| Veto HV Monitor | 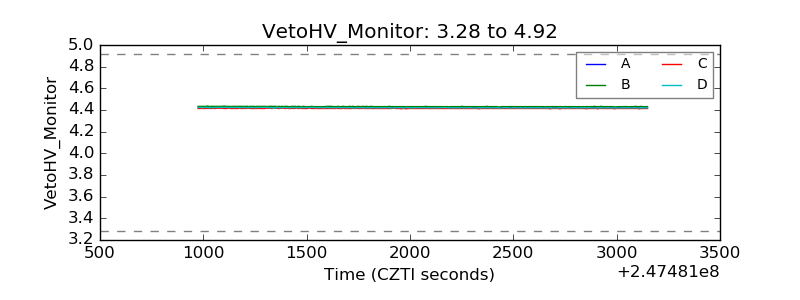 |
| Veto LLD | 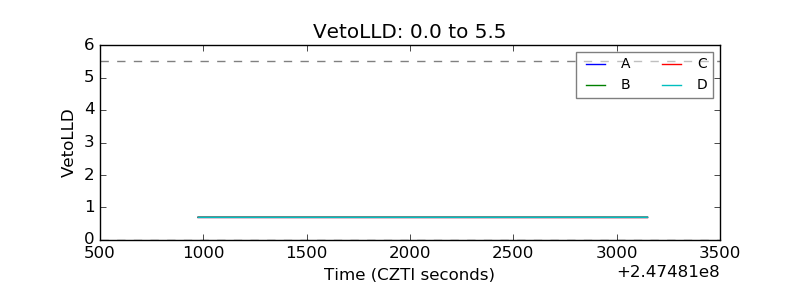 |
| Alpha Counter | 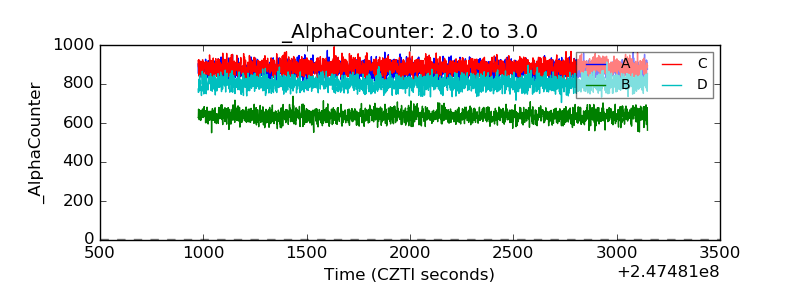 |
| _CPM_Rate | 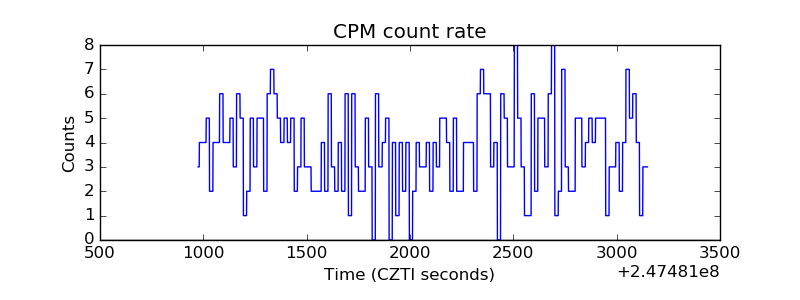 |
| CZT Counter | 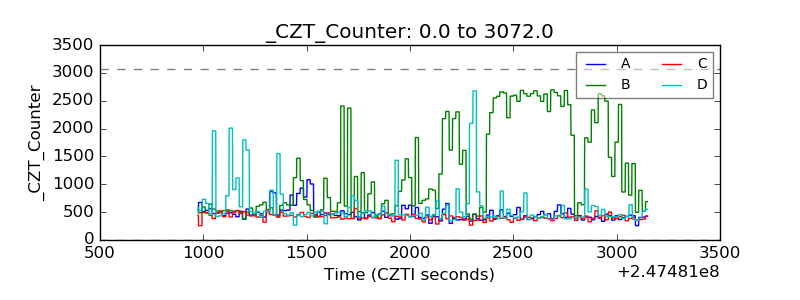 |
| +2.5 Volts monitor | 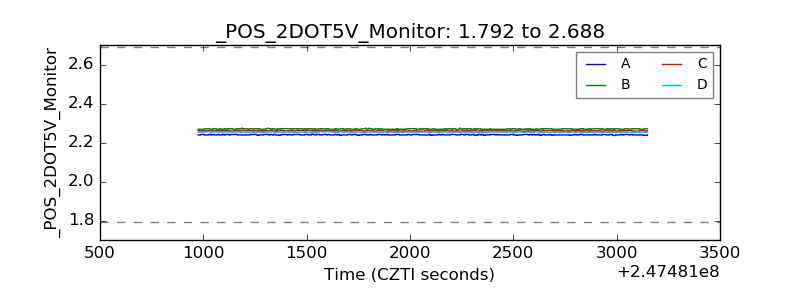 |
| +5 Volts monitor |  |
| _ROLL_ROT |  |
| _Roll_DEC | 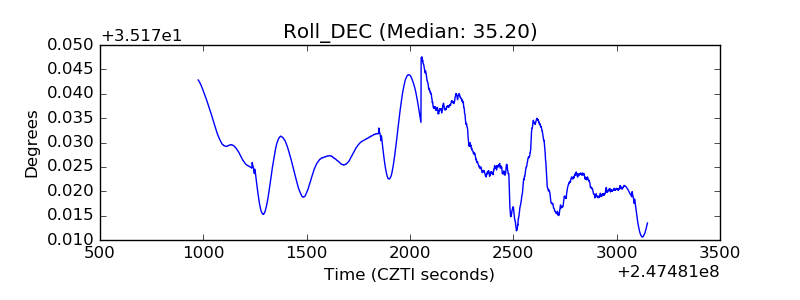 |
| _Roll_RA | 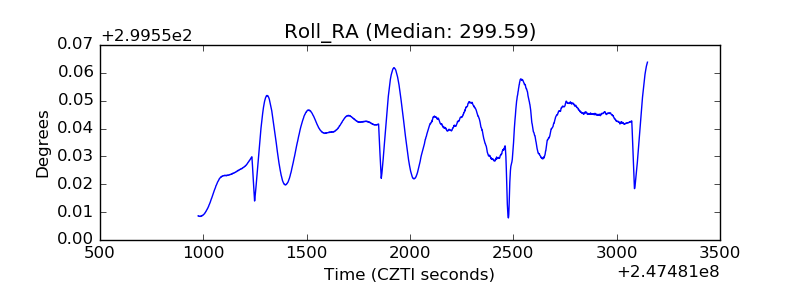 |
| Veto Counter | 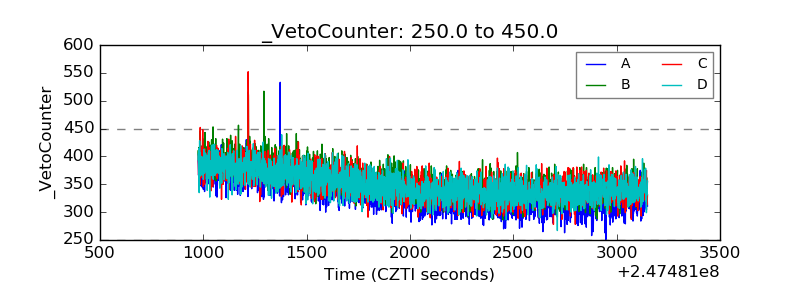 |