| Param | Original file | Final file |
|---|---|---|
| Filename | modeM0/AS1A04_022T02_9000001662cztM0_level2.fits | modeM0/AS1A04_022T02_9000001662cztM0_level2_quad_clean.evt |
| Size (bytes) | 515,462,400 | 458,703,360 |
| Size | 491.6 MB | 437.5 MB |
| Events in quadrant A | 3,126,208 | 2,598,107 |
| Events in quadrant B | 2,964,940 | 2,525,836 |
| Events in quadrant C | 3,157,786 | 2,764,157 |
| Events in quadrant D | 2,625,124 | 2,268,674 |
| Mode SS | |||
|---|---|---|---|
| Quadrant | BADHDUFLAG | Total packets | Discarded packets |
| A | 0 | 1106 | 0 |
| B | 0 | 1106 | 0 |
| C | 0 | 1106 | 0 |
| D | 0 | 1106 | 0 |
| Mode M0 | |||
|---|---|---|---|
| Quadrant | BADHDUFLAG | Total packets | Discarded packets |
| A | 0 | 133008 | 0 |
| B | 0 | 141705 | 0 |
| C | 0 | 112814 | 0 |
| D | 0 | 157199 | 0 |
| Mode M9 | |||
|---|---|---|---|
| Quadrant | BADHDUFLAG | Total packets | Discarded packets |
| A | 0 | 96 | 0 |
| B | 0 | 96 | 0 |
| C | 0 | 96 | 0 |
| D | 0 | 96 | 0 |
| Quadrant | Total seconds | Saturated seconds | Saturation percentage |
|---|---|---|---|
| A | 54430 | 1732 | 3.182069% |
| B | 54430 | 2990 | 5.493294% |
| C | 54430 | 437 | 0.802866% |
| D | 54430 | 3955 | 7.266213% |
Noise dominated data is calculated using 1-second bins in cleaned event files. If a bin has >2000 counts, and if more than 50% of those come from <1% of pixels, then it is considered to be noise-dominated and hence unusable.
| Quadrant | # 1 sec bins | Bins with >0 counts | Bins with >2000 counts | High rate bins dominated by noise | Noise dominated (total time) | Noise dominated (detector-on time) | Marked lightcurve |
|---|---|---|---|---|---|---|---|
| A | 63866 | 54413 | 0 | 0 | 0.00% | 0.00% |  |
| B | 63866 | 54414 | 0 | 0 | 0.00% | 0.00% |  |
| C | 63866 | 54430 | 0 | 0 | 0.00% | 0.00% |  |
| D | 63866 | 54269 | 0 | 0 | 0.00% | 0.00% |  |
Top three noisy pixels from each quadrant. If the there are fewer than three noisy pixels in the level2.evt file, extra rows are filled as -1
| Pixel properties | Quadrant properties | ||||||
|---|---|---|---|---|---|---|---|
| Quadrant | DetID | PixID | Counts | Sigma | Mean | Median | Sigma |
| A | 0 | 29 | 2978 | 10.95 | 812 | 760 | 202.6 |
| A | 7 | 110 | 2527 | 8.72 | 812 | 760 | 202.6 |
| A | 9 | 19 | 2314 | 7.67 | 812 | 760 | 202.6 |
| B | 2 | 9 | 2562 | 11.81 | 781 | 746 | 153.8 |
| B | 2 | 8 | 1956 | 7.87 | 781 | 746 | 153.8 |
| B | 3 | 17 | 1922 | 7.65 | 781 | 746 | 153.8 |
| C | 1 | 81 | 2394 | 7.44 | 832 | 779 | 217.1 |
| C | 12 | 250 | 2341 | 7.19 | 832 | 779 | 217.1 |
| C | 1 | 80 | 2340 | 7.19 | 832 | 779 | 217.1 |
| D | 6 | 231 | 1896 | 6.06 | 748 | 679 | 200.7 |
| D | 3 | 14 | 1877 | 5.97 | 748 | 679 | 200.7 |
| D | 7 | 5 | 1870 | 5.93 | 748 | 679 | 200.7 |
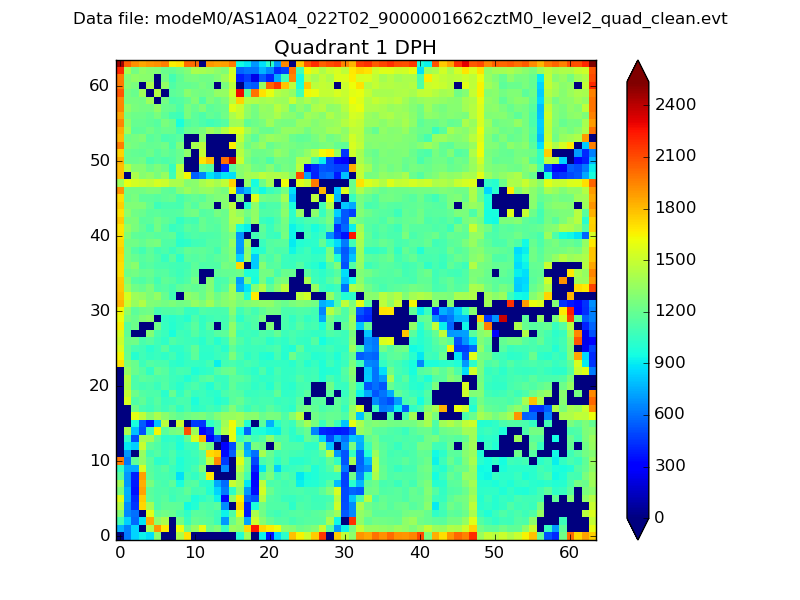
Histogram calculated using DETX and DETY for each event in the final _common_clean file
| Quadrant A |  |
 |
Quadrant B |
|---|---|---|---|
| Quadrant D | 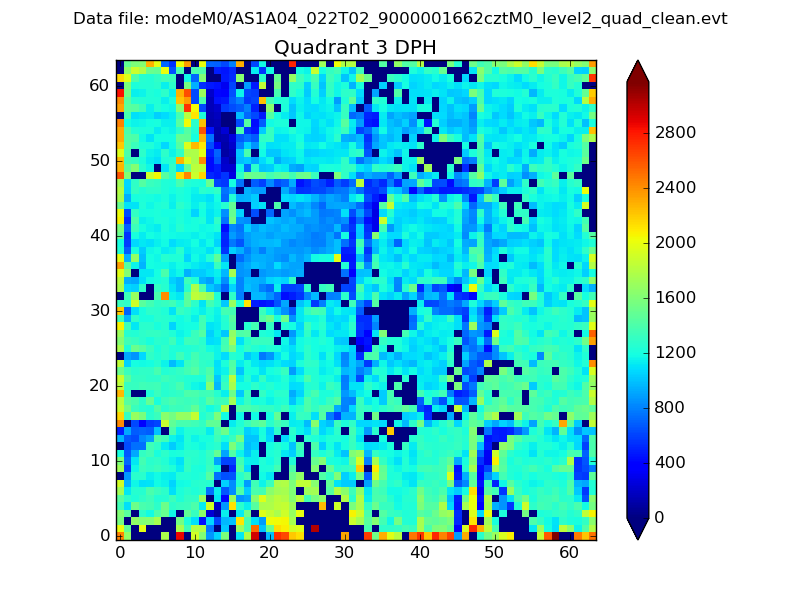 |
 |
Quadrant C |
| Plot type | Count rate plots | Images |
|---|---|---|
| Comparison with Poisson distribution Blue bars denote a histogram of data divided into 1 sec bins. Red curve is a Poisson curve with rate = median count rate of data. |
 |
 |
| Quadrant-wise count rates Data is divided into 100 sec bins |
 |
|
| Module-wise count rates for Quadrant A Data is divided into 100 sec bins |
 |
 |
| Module-wise count rates for Quadrant B Data is divided into 100 sec bins |
 |
 |
| Module-wise count rates for Quadrant C Data is divided into 100 sec bins |
 |
 |
| Module-wise count rates for Quadrant D Data is divided into 100 sec bins |
 |
 |
| Parameter | Plot |
|---|---|
| CZT HV Monitor |  |
| D_VDD |  |
| Temperature 1 |  |
| Veto HV Monitor |  |
| Veto LLD |  |
| Alpha Counter |  |
| _CPM_Rate |  |
| CZT Counter |  |
| +2.5 Volts monitor |  |
| +5 Volts monitor |  |
| _ROLL_ROT |  |
| _Roll_DEC |  |
| _Roll_RA |  |
| Veto Counter |  |