| Param | Original file | Final file |
|---|---|---|
| Filename | modeM0/AS1A04_022T02_9000001662_11371cztM0_level2.evt | modeM0/AS1A04_022T02_9000001662_11371cztM0_level2_quad_clean.evt |
| Size (bytes) | 241,718,400 | 37,411,200 |
| Size | 230.5 MB | 35.7 MB |
| Events in quadrant A | 1,596,848 | 222,330 |
| Events in quadrant B | 2,171,581 | 221,354 |
| Events in quadrant C | 1,501,790 | 239,910 |
| Events in quadrant D | 1,832,880 | 223,200 |
| Mode SS | |||
|---|---|---|---|
| Quadrant | BADHDUFLAG | Total packets | Discarded packets |
| A | 0 | 66 | 0 |
| B | 0 | 66 | 0 |
| C | 0 | 66 | 0 |
| D | 0 | 66 | 0 |
| Mode M0 | |||
|---|---|---|---|
| Quadrant | BADHDUFLAG | Total packets | Discarded packets |
| A | 0 | 6747 | 2 |
| B | 0 | 8481 | 1 |
| C | 0 | 6479 | 1 |
| D | 0 | 7470 | 1 |
| Mode M9 | |||
|---|---|---|---|
| Quadrant | BADHDUFLAG | Total packets | Discarded packets |
| A | 0 | 9 | 0 |
| B | 0 | 9 | 0 |
| C | 0 | 9 | 0 |
| D | 0 | 9 | 0 |
| Quadrant | Total seconds | Saturated seconds | Saturation percentage |
|---|---|---|---|
| A | 3171 | 64 | 2.018291% |
| B | 3171 | 179 | 5.644907% |
| C | 3171 | 50 | 1.576790% |
| D | 3171 | 98 | 3.090508% |
Noise dominated data is calculated using 1-second bins in cleaned event files. If a bin has >2000 counts, and if more than 50% of those come from <1% of pixels, then it is considered to be noise-dominated and hence unusable.
| Quadrant | # 1 sec bins | Bins with >0 counts | Bins with >2000 counts | High rate bins dominated by noise | Noise dominated (total time) | Noise dominated (detector-on time) | Marked lightcurve |
|---|---|---|---|---|---|---|---|
| A | 4096 | 3171 | 0 | 0 | 0.00% | 0.00% | 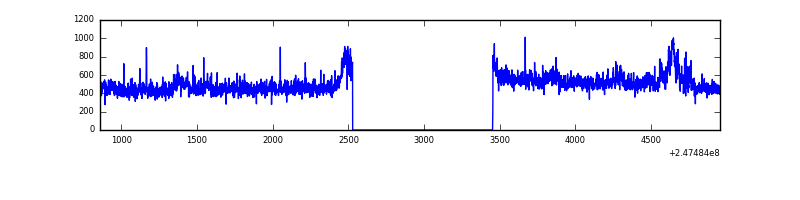 |
| B | 4096 | 3171 | 75 | 75 | 1.83% | 2.37% | 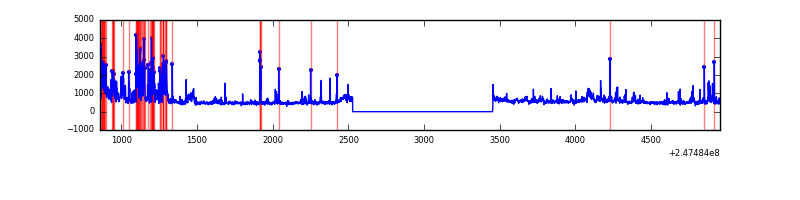 |
| C | 4096 | 3172 | 0 | 0 | 0.00% | 0.00% | 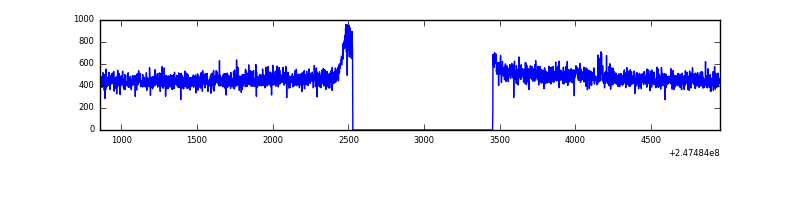 |
| D | 4096 | 3172 | 33 | 33 | 0.81% | 1.04% | 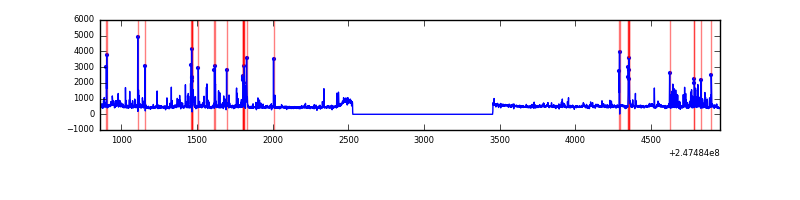 |
Top three noisy pixels from each quadrant. If the there are fewer than three noisy pixels in the level2.evt file, extra rows are filled as -1
| Pixel properties | Quadrant properties | ||||||
|---|---|---|---|---|---|---|---|
| Quadrant | DetID | PixID | Counts | Sigma | Mean | Median | Sigma |
| A | 15 | 174 | 41622 | 509.58 | 388 | 379 | 80.9 |
| A | 13 | 210 | 14035 | 168.73 | 388 | 379 | 80.9 |
| A | 1 | 162 | 10823 | 129.04 | 388 | 379 | 80.9 |
| B | 3 | 64 | 366287 | 4785.21 | 385 | 375 | 76.5 |
| B | 4 | 239 | 123132 | 1605.35 | 385 | 375 | 76.5 |
| B | 3 | 189 | 102450 | 1334.88 | 385 | 375 | 76.5 |
| C | 13 | 61 | 2849 | 26.94 | 384 | 386 | 91.4 |
| C | 14 | 67 | 2577 | 23.97 | 384 | 386 | 91.4 |
| C | 14 | 234 | 2249 | 20.38 | 384 | 386 | 91.4 |
| D | 10 | 253 | 101678 | 1130.23 | 373 | 364 | 89.6 |
| D | 2 | 120 | 77925 | 865.25 | 373 | 364 | 89.6 |
| D | 13 | 249 | 58405 | 647.49 | 373 | 364 | 89.6 |
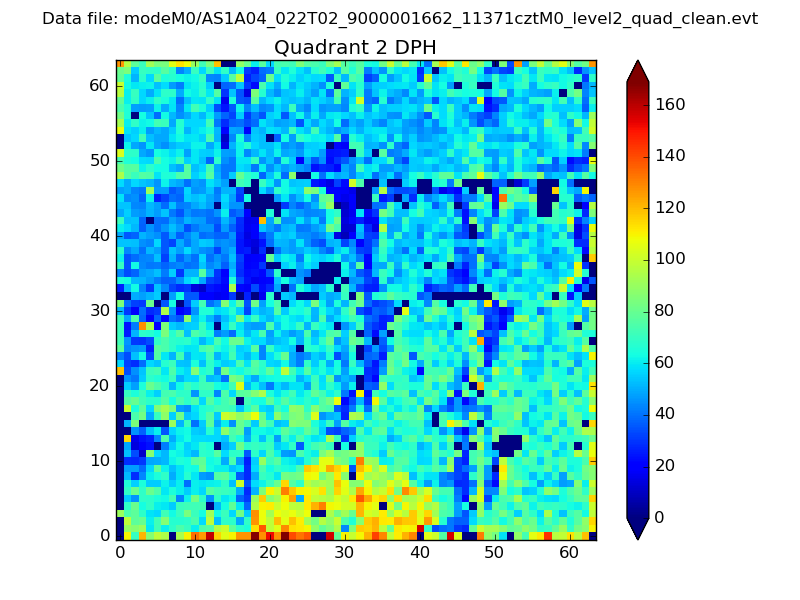
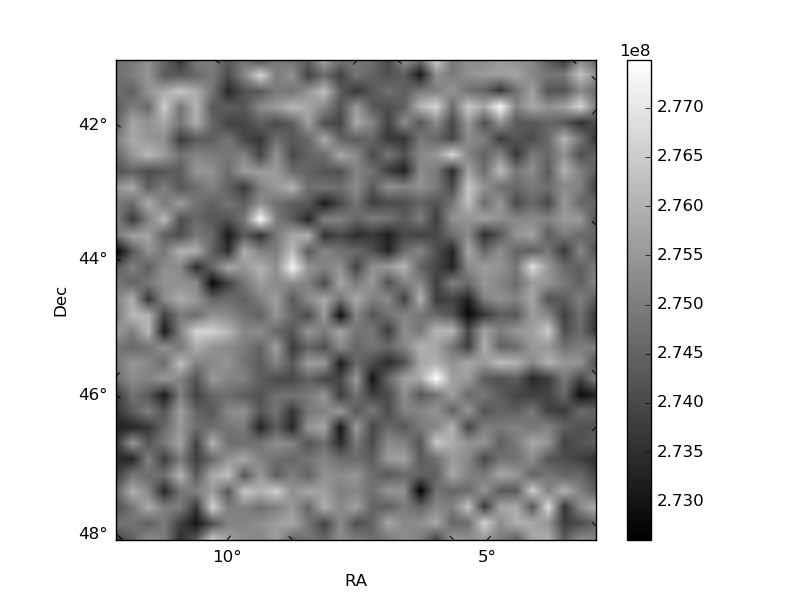
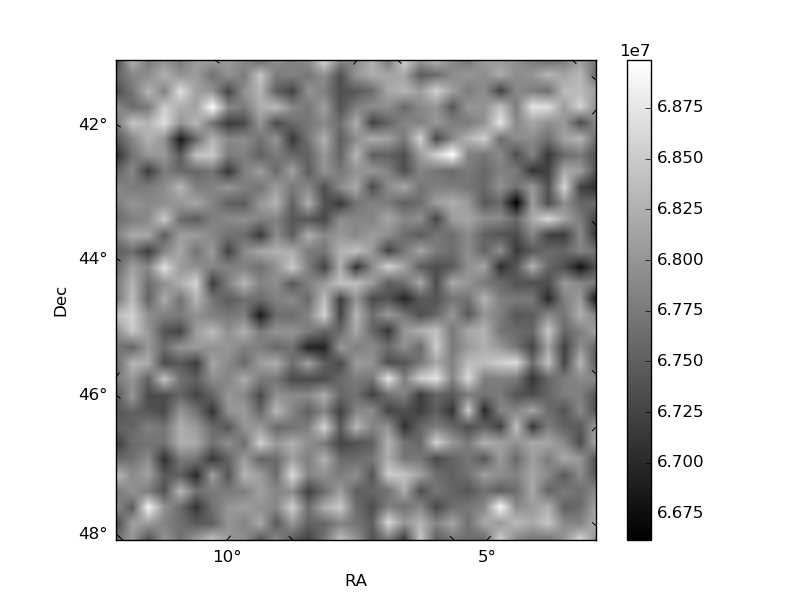
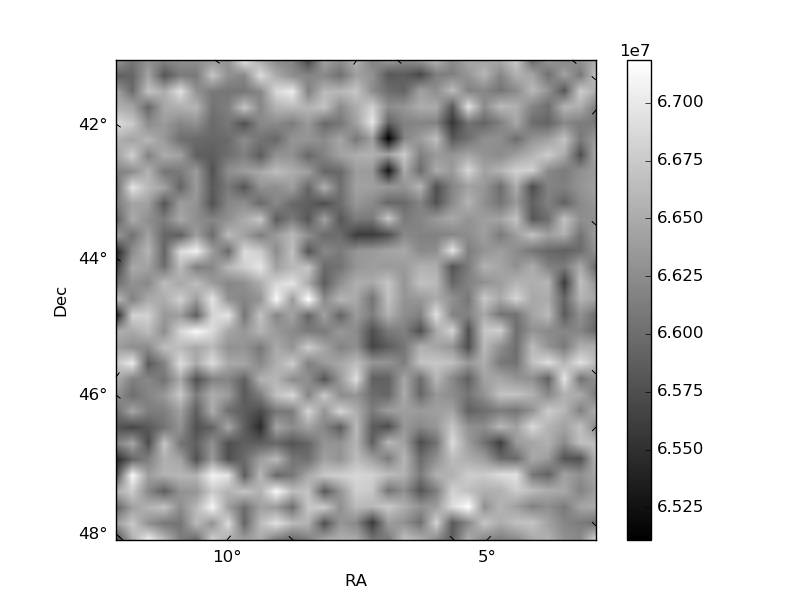
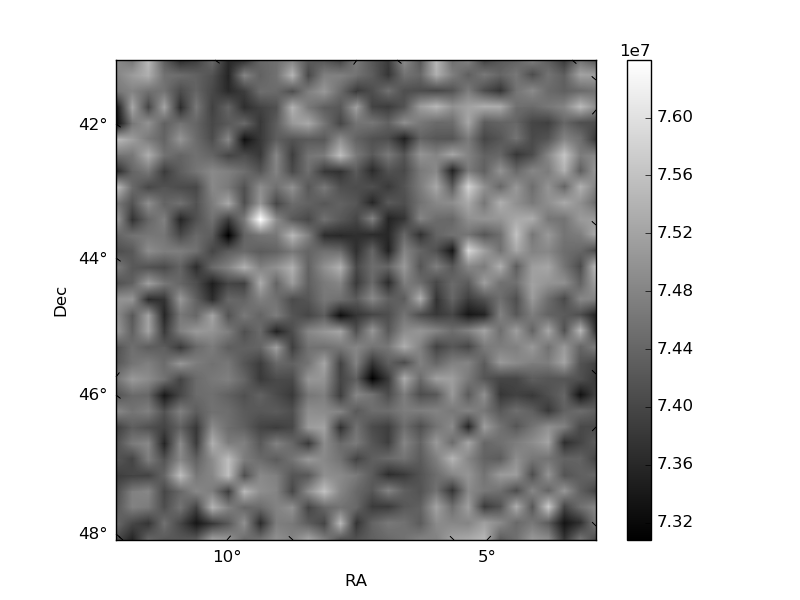
Histogram calculated using DETX and DETY for each event in the final _common_clean file
| Quadrant A | 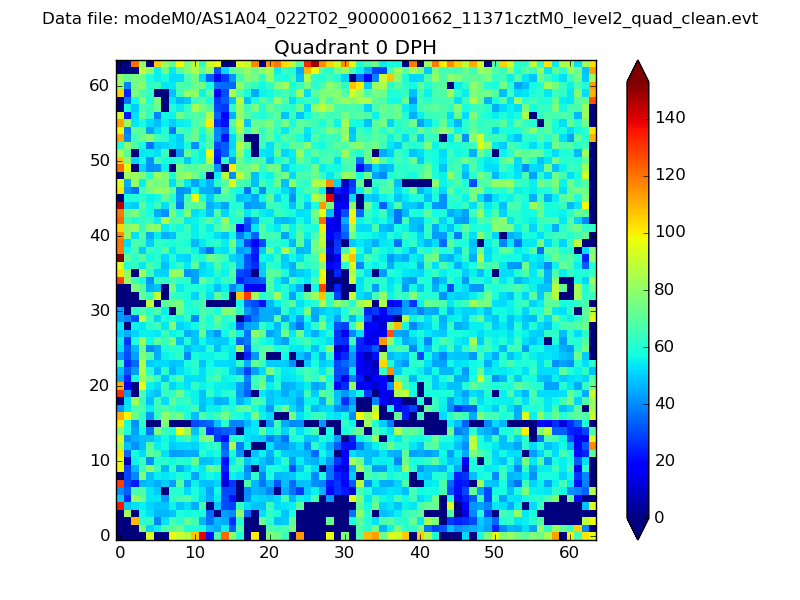 |
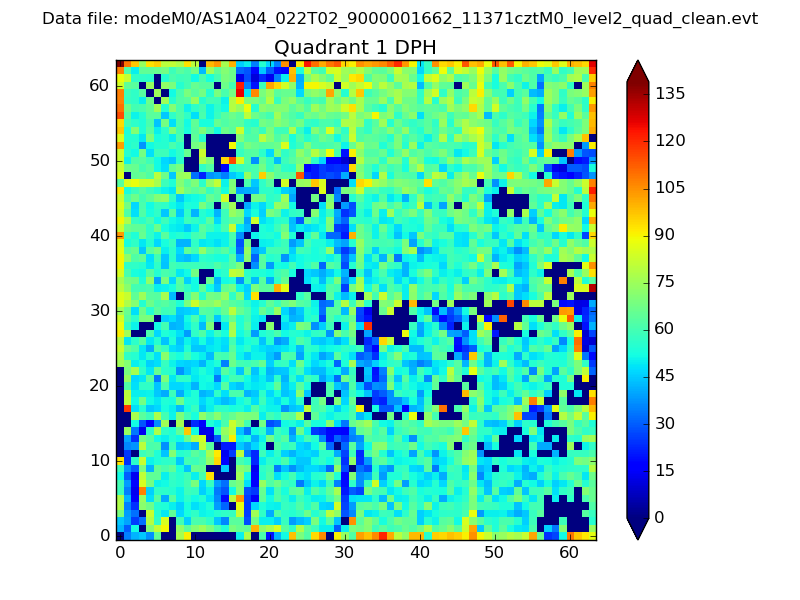 |
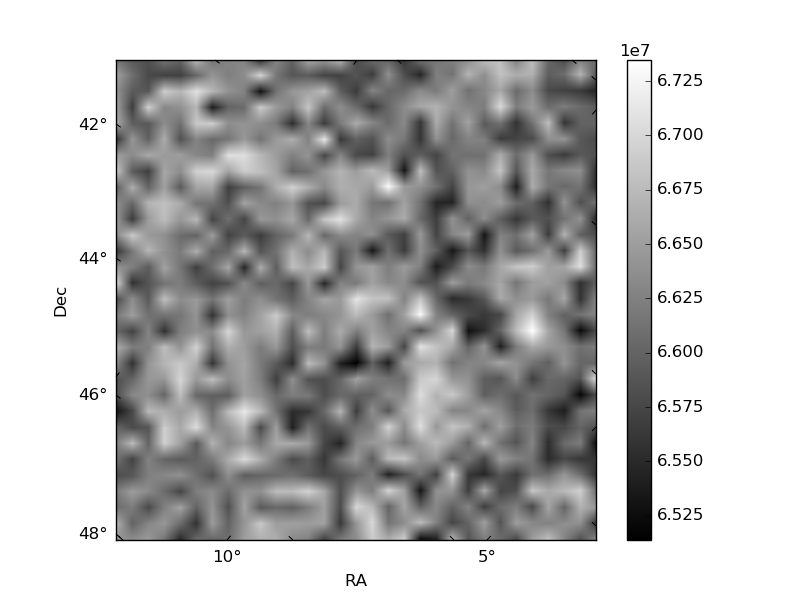
Quadrant B |
|---|---|---|---|
| Quadrant D | 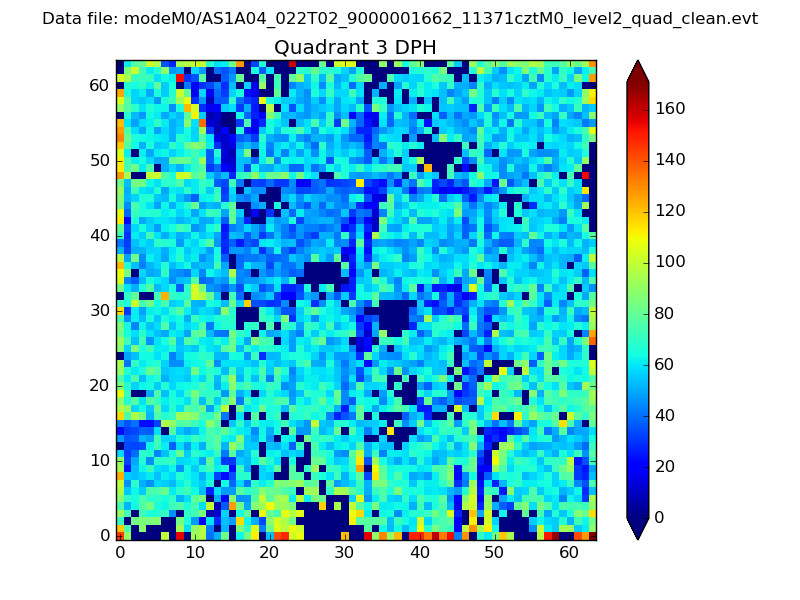 |
 |
Quadrant C |
| Plot type | Count rate plots | Images |
|---|---|---|
| Comparison with Poisson distribution Blue bars denote a histogram of data divided into 1 sec bins. Red curve is a Poisson curve with rate = median count rate of data. |
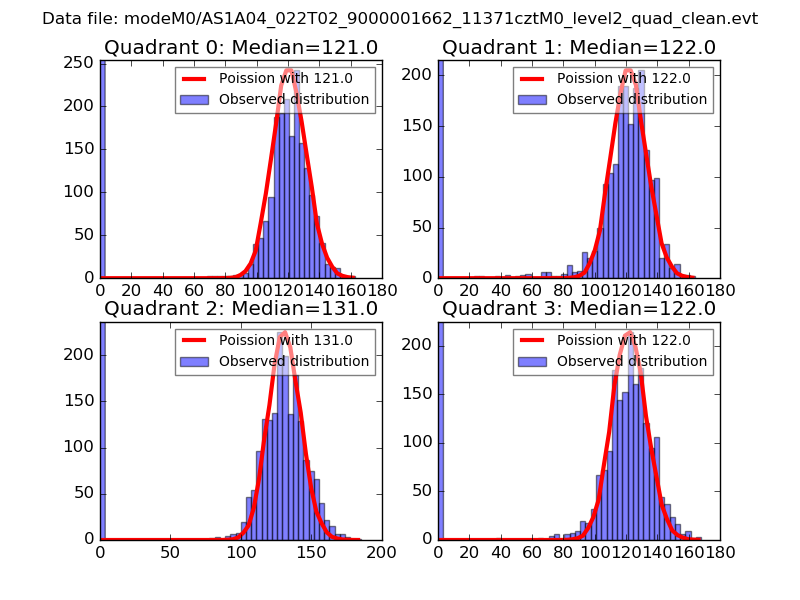 |
 |
| Quadrant-wise count rates Data is divided into 100 sec bins |
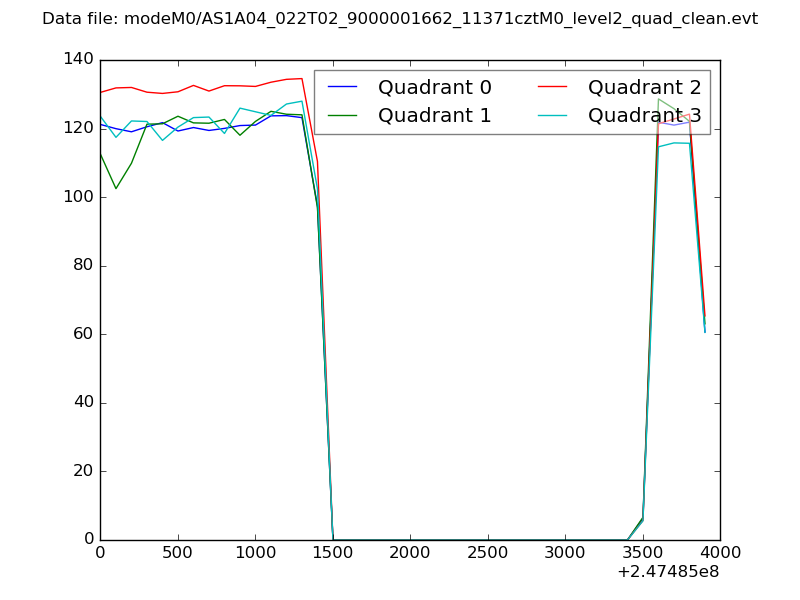 |
|
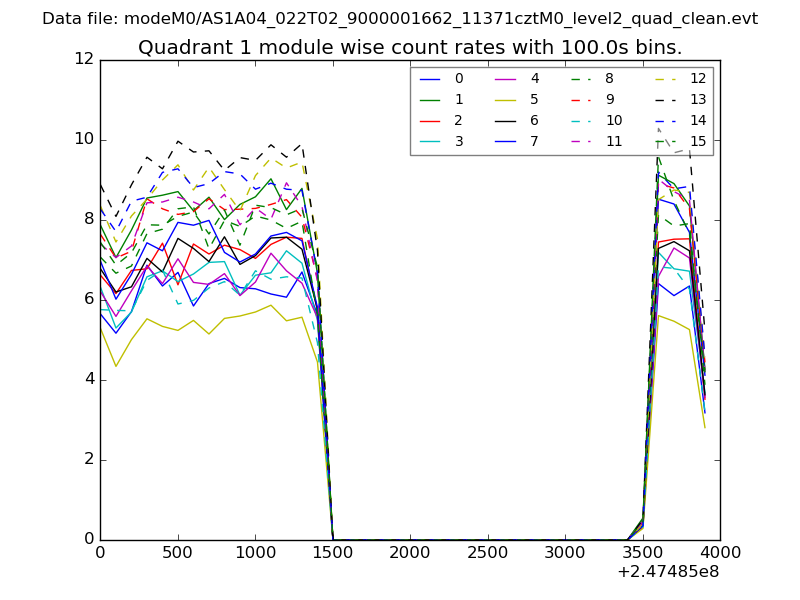
| Module-wise count rates for Quadrant A Data is divided into 100 sec bins |
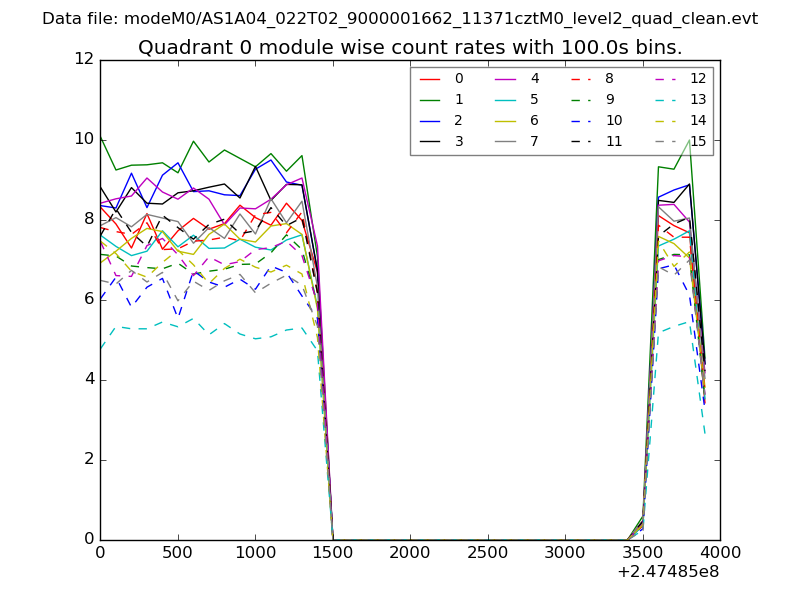 |
 |
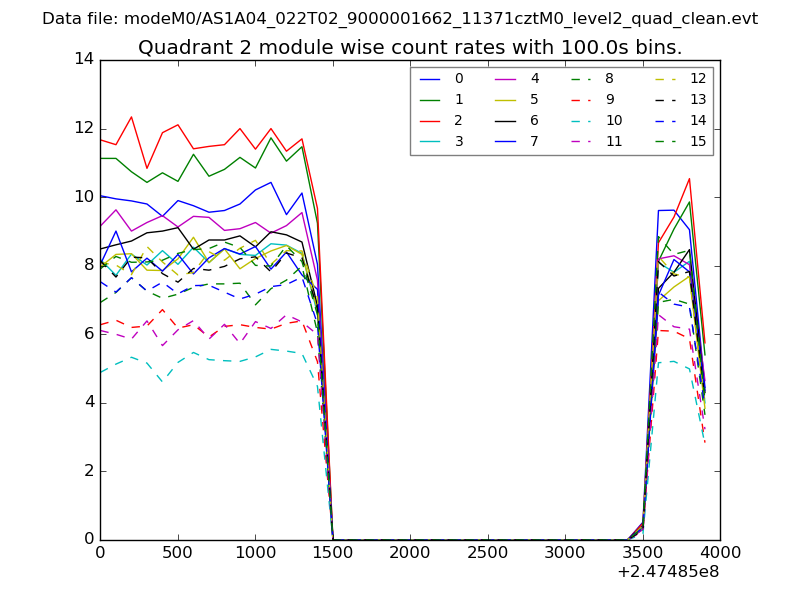
| Module-wise count rates for Quadrant B Data is divided into 100 sec bins |
 |
 |
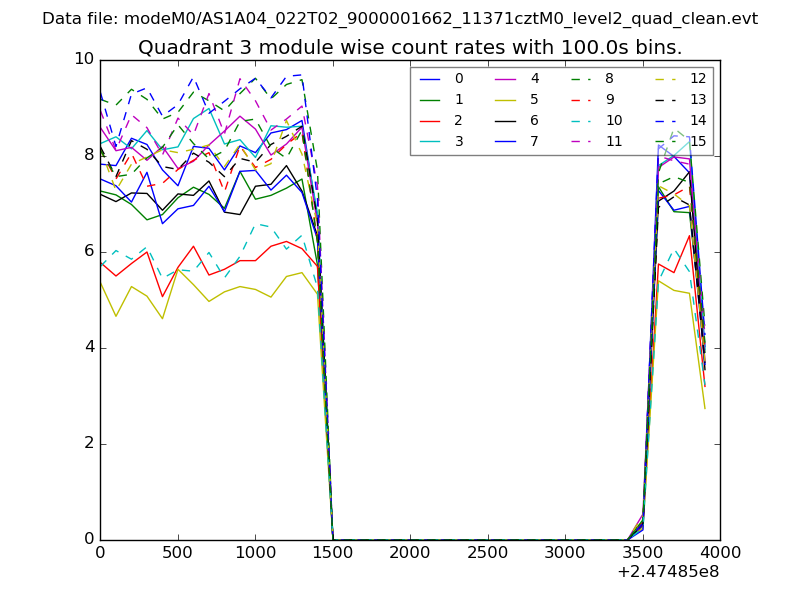
| Module-wise count rates for Quadrant C Data is divided into 100 sec bins |
 |
 |
| Module-wise count rates for Quadrant D Data is divided into 100 sec bins |
 |
 |
| Parameter | Plot |
|---|---|
| CZT HV Monitor | 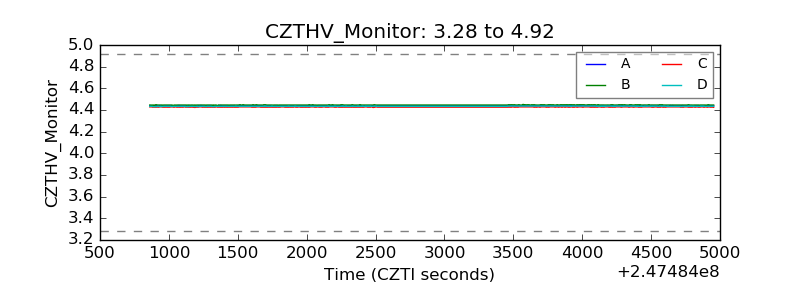 |
| D_VDD | 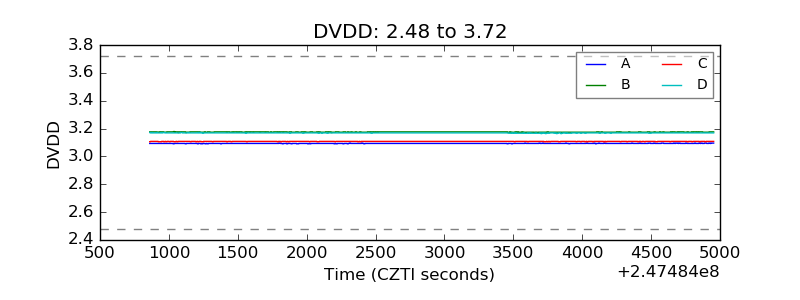 |
| Temperature 1 | 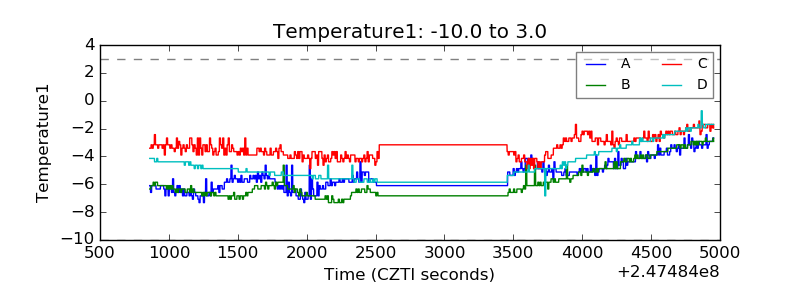 |
| Veto HV Monitor | 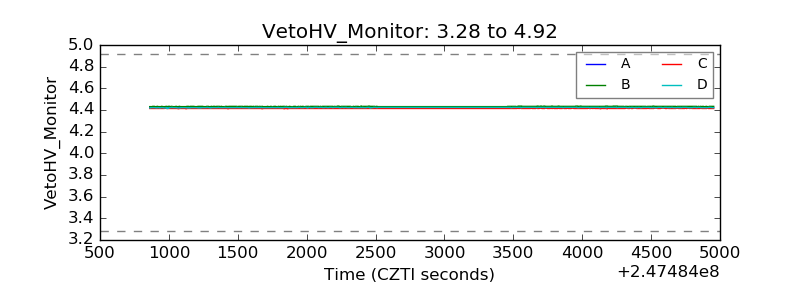 |
| Veto LLD |  |
| Alpha Counter | 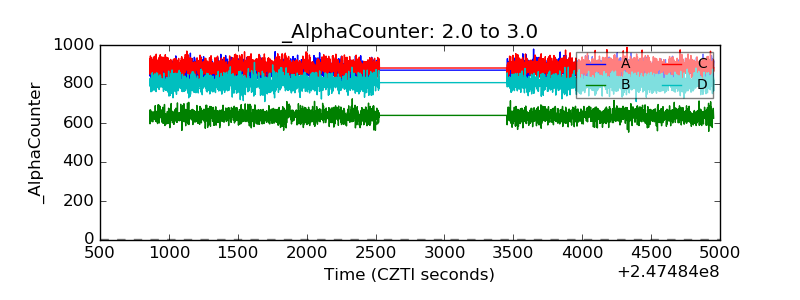 |
| _CPM_Rate | 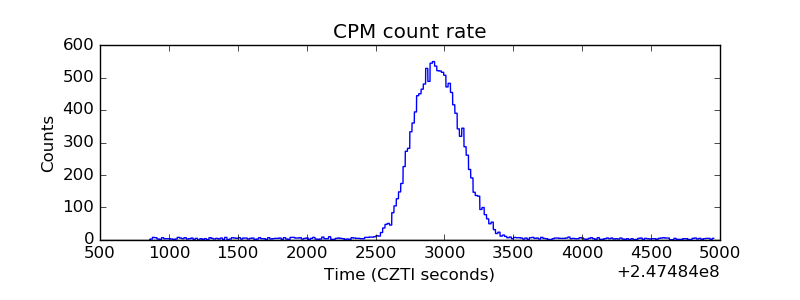 |
| CZT Counter | 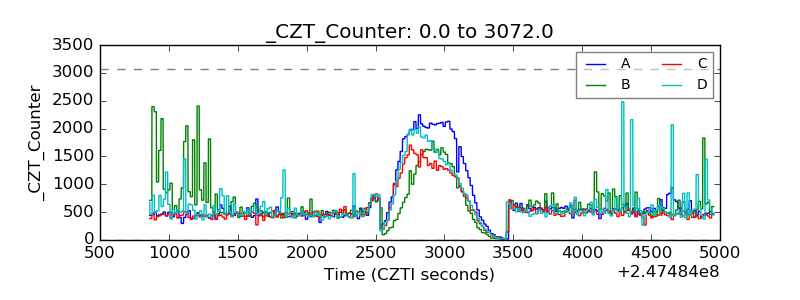 |
| +2.5 Volts monitor |  |
| +5 Volts monitor |  |
| _ROLL_ROT | 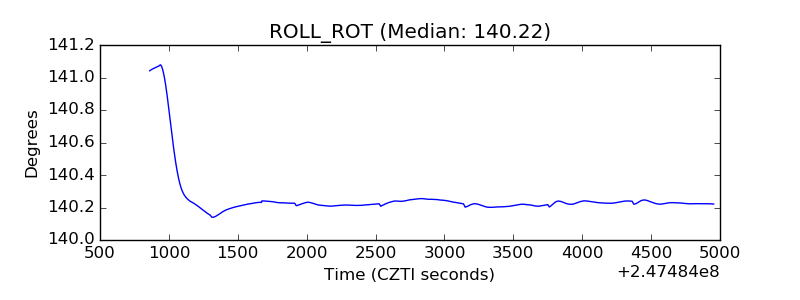 |
| _Roll_DEC | 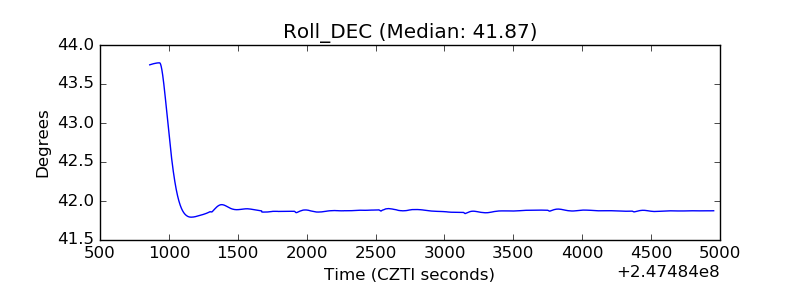 |
| _Roll_RA | 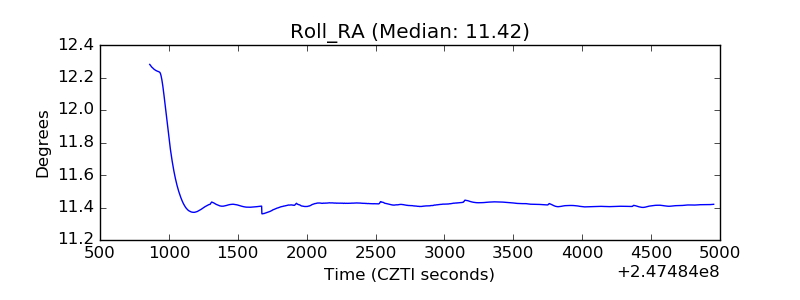 |
| Veto Counter | 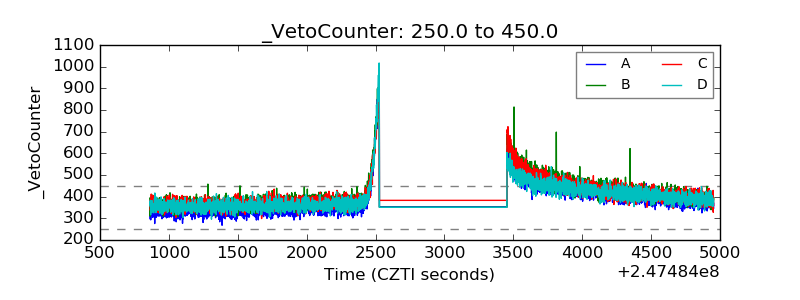 |