| Param | Original file | Final file |
|---|---|---|
| Filename | modeM0/AS1A04_022T02_9000001662_11372cztM0_level2.evt | modeM0/AS1A04_022T02_9000001662_11372cztM0_level2_quad_clean.evt |
| Size (bytes) | 492,595,200 | 88,922,880 |
| Size | 469.8 MB | 84.8 MB |
| Events in quadrant A | 3,278,488 | 550,248 |
| Events in quadrant B | 4,020,476 | 551,465 |
| Events in quadrant C | 3,136,601 | 584,423 |
| Events in quadrant D | 4,026,090 | 538,023 |
| Mode SS | |||
|---|---|---|---|
| Quadrant | BADHDUFLAG | Total packets | Discarded packets |
| A | 0 | 138 | 0 |
| B | 0 | 138 | 0 |
| C | 0 | 138 | 0 |
| D | 0 | 138 | 0 |
| Mode M0 | |||
|---|---|---|---|
| Quadrant | BADHDUFLAG | Total packets | Discarded packets |
| A | 0 | 14179 | 3 |
| B | 0 | 16263 | 2 |
| C | 0 | 13748 | 2 |
| D | 0 | 16378 | 2 |
| Mode M9 | |||
|---|---|---|---|
| Quadrant | BADHDUFLAG | Total packets | Discarded packets |
| A | 0 | 20 | 0 |
| B | 0 | 20 | 0 |
| C | 0 | 20 | 0 |
| D | 0 | 20 | 0 |
| Quadrant | Total seconds | Saturated seconds | Saturation percentage |
|---|---|---|---|
| A | 6725 | 86 | 1.278810% |
| B | 6725 | 160 | 2.379182% |
| C | 6725 | 56 | 0.832714% |
| D | 6725 | 242 | 3.598513% |
Noise dominated data is calculated using 1-second bins in cleaned event files. If a bin has >2000 counts, and if more than 50% of those come from <1% of pixels, then it is considered to be noise-dominated and hence unusable.
| Quadrant | # 1 sec bins | Bins with >0 counts | Bins with >2000 counts | High rate bins dominated by noise | Noise dominated (total time) | Noise dominated (detector-on time) | Marked lightcurve |
|---|---|---|---|---|---|---|---|
| A | 8710 | 6727 | 0 | 0 | 0.00% | 0.00% |  |
| B | 8710 | 6727 | 44 | 44 | 0.51% | 0.65% | 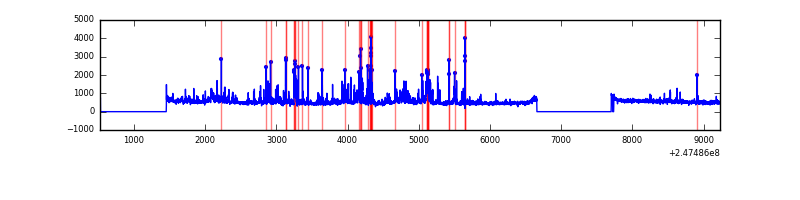 |
| C | 8710 | 6728 | 1 | 1 | 0.01% | 0.01% | 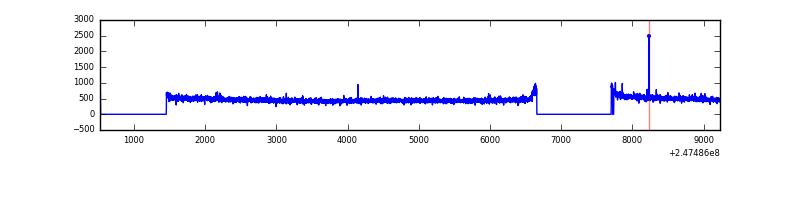 |
| D | 8710 | 6728 | 149 | 149 | 1.71% | 2.21% | 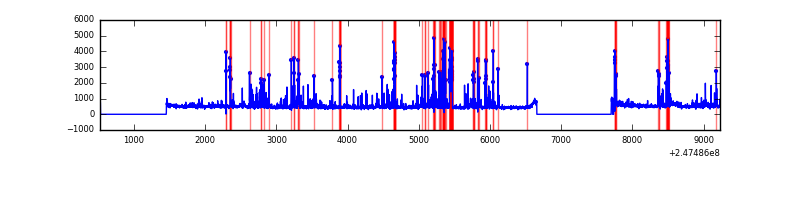 |
Top three noisy pixels from each quadrant. If the there are fewer than three noisy pixels in the level2.evt file, extra rows are filled as -1
| Pixel properties | Quadrant properties | ||||||
|---|---|---|---|---|---|---|---|
| Quadrant | DetID | PixID | Counts | Sigma | Mean | Median | Sigma |
| A | 15 | 174 | 57411 | 338.66 | 820 | 802 | 167.2 |
| A | 11 | 29 | 24890 | 144.11 | 820 | 802 | 167.2 |
| A | 8 | 15 | 12487 | 69.91 | 820 | 802 | 167.2 |
| B | 3 | 64 | 337173 | 2162.45 | 812 | 791 | 155.6 |
| B | 4 | 239 | 237044 | 1518.77 | 812 | 791 | 155.6 |
| B | 3 | 189 | 134759 | 861.22 | 812 | 791 | 155.6 |
| C | 14 | 234 | 6357 | 29.78 | 802 | 808 | 186.3 |
| C | 13 | 61 | 5841 | 27.01 | 802 | 808 | 186.3 |
| C | 14 | 67 | 3770 | 15.9 | 802 | 808 | 186.3 |
| D | 1 | 52 | 255967 | 1366.77 | 785 | 767 | 186.7 |
| D | 10 | 253 | 180500 | 962.59 | 785 | 767 | 186.7 |
| D | 2 | 120 | 145134 | 773.18 | 785 | 767 | 186.7 |
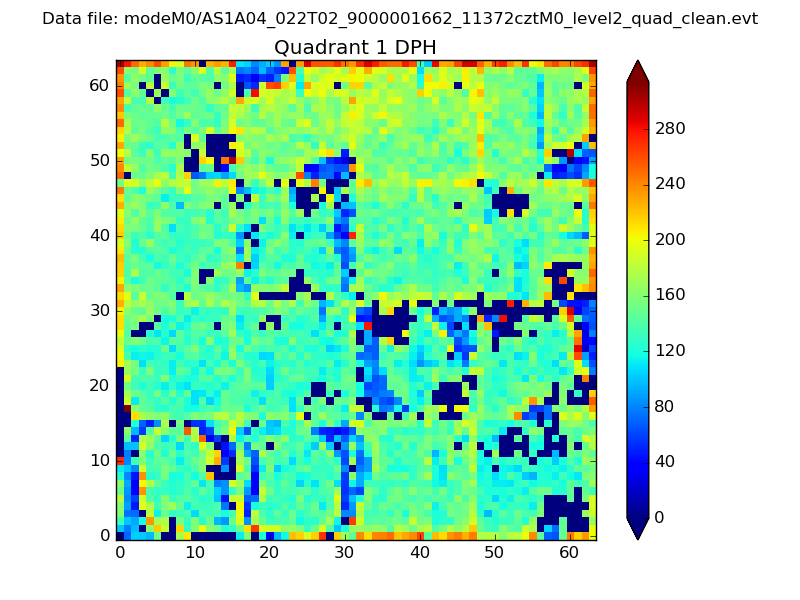
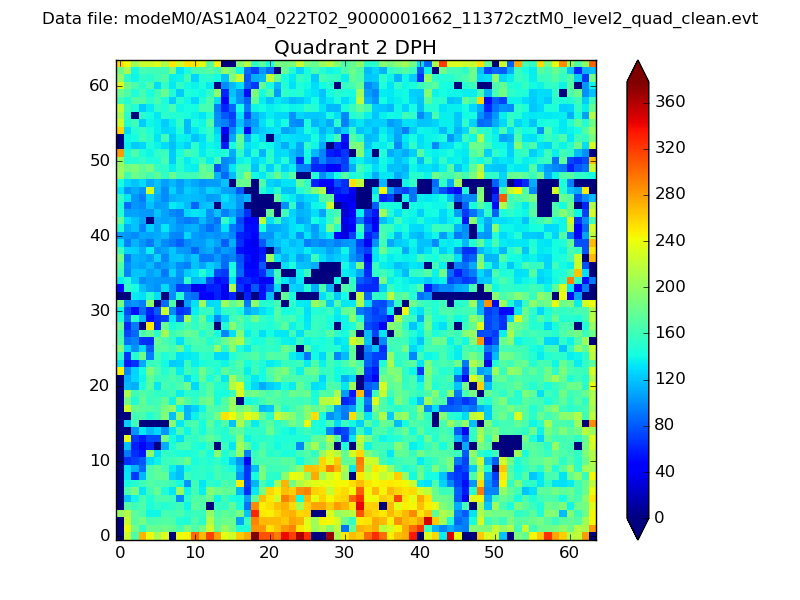
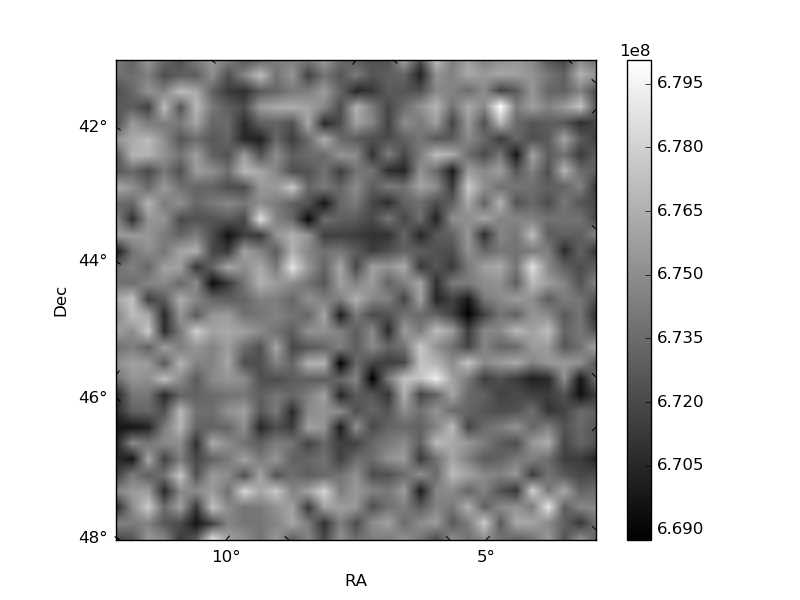
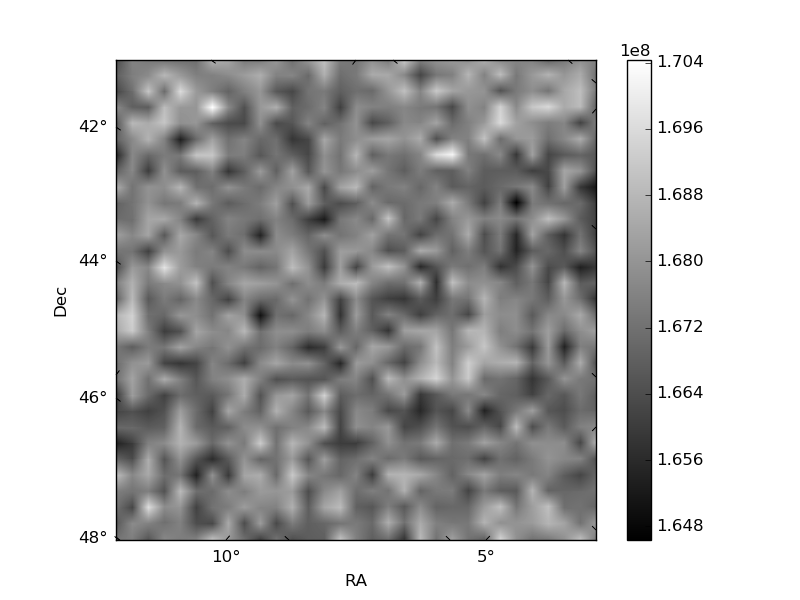
Histogram calculated using DETX and DETY for each event in the final _common_clean file
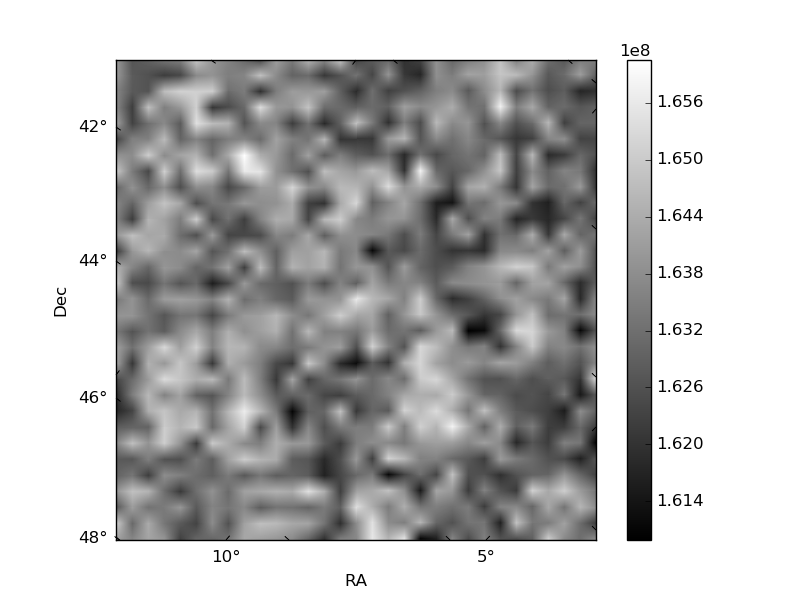
| Quadrant A | 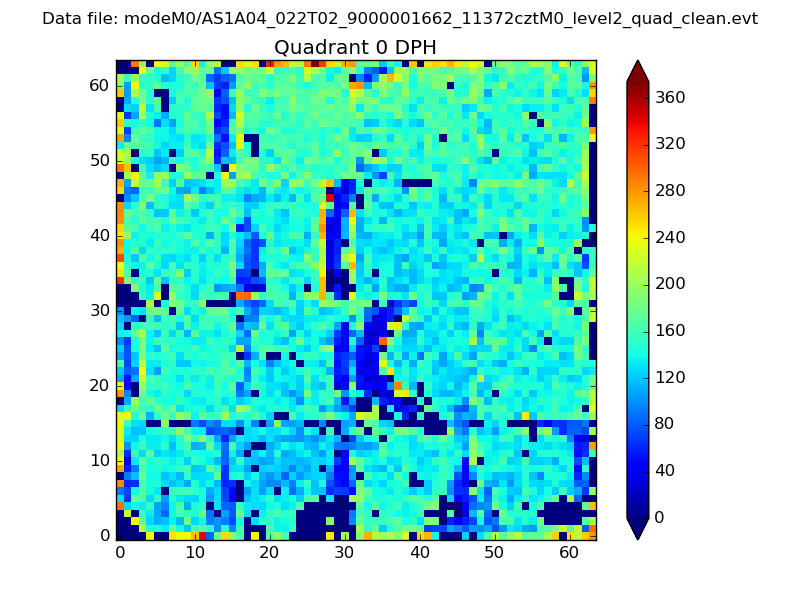 |
 |
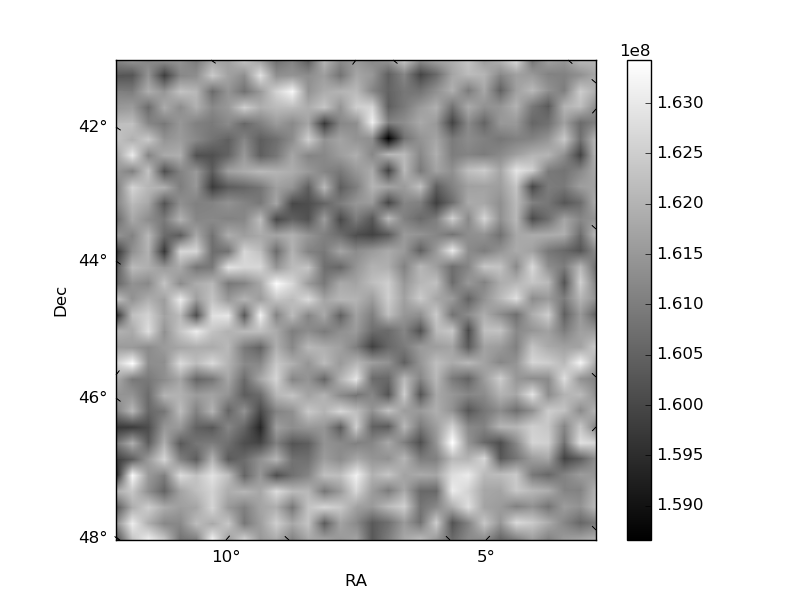
Quadrant B |
|---|---|---|---|
| Quadrant D | 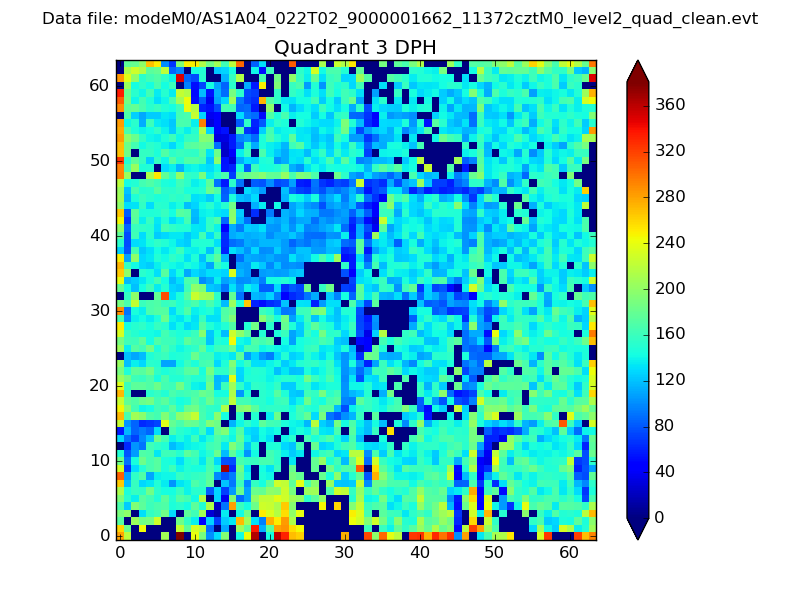 |
 |
Quadrant C |
| Plot type | Count rate plots | Images |
|---|---|---|
| Comparison with Poisson distribution Blue bars denote a histogram of data divided into 1 sec bins. Red curve is a Poisson curve with rate = median count rate of data. |
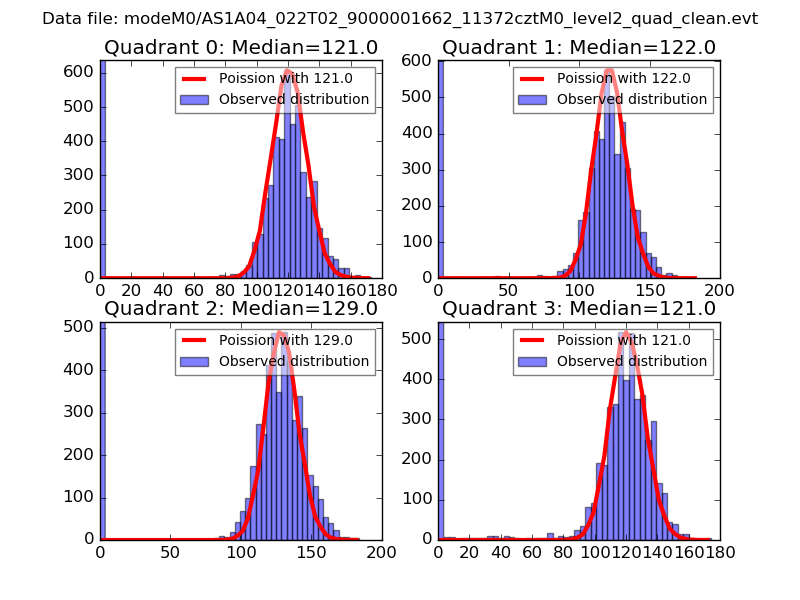 |
 |
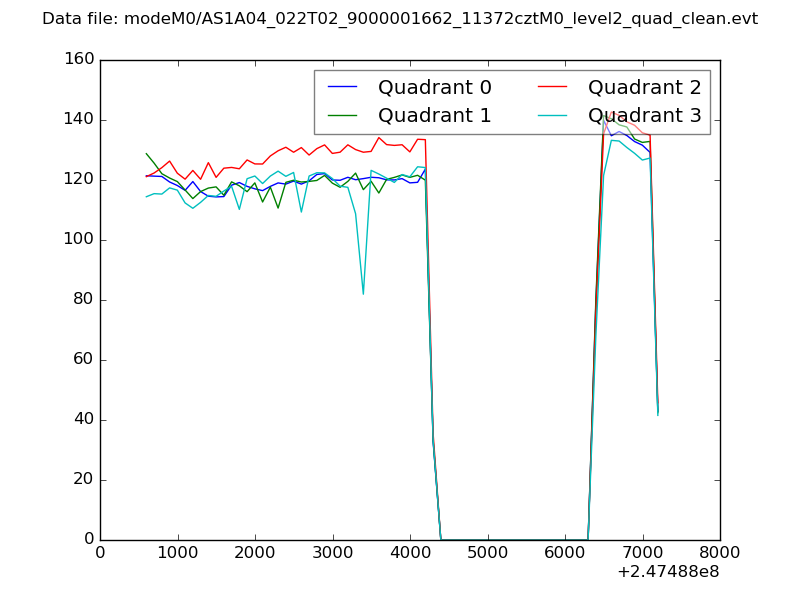
| Quadrant-wise count rates Data is divided into 100 sec bins |
 |
|
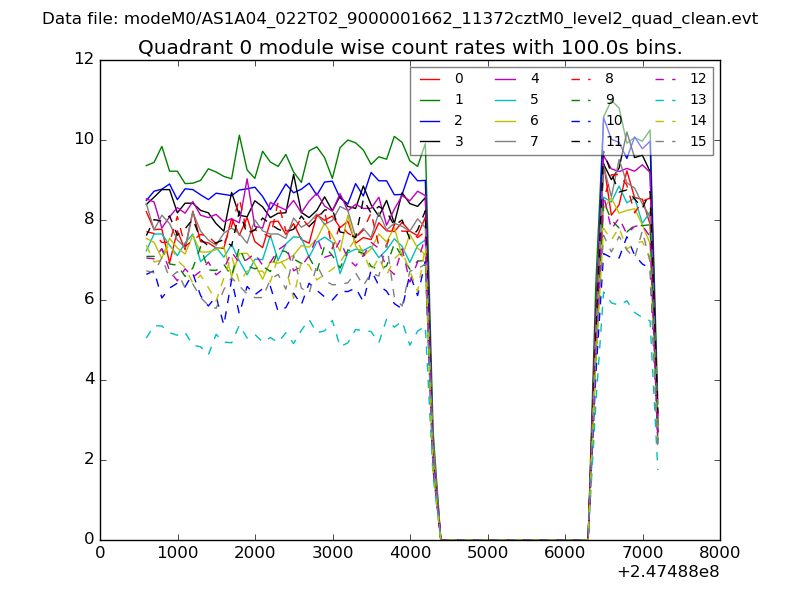
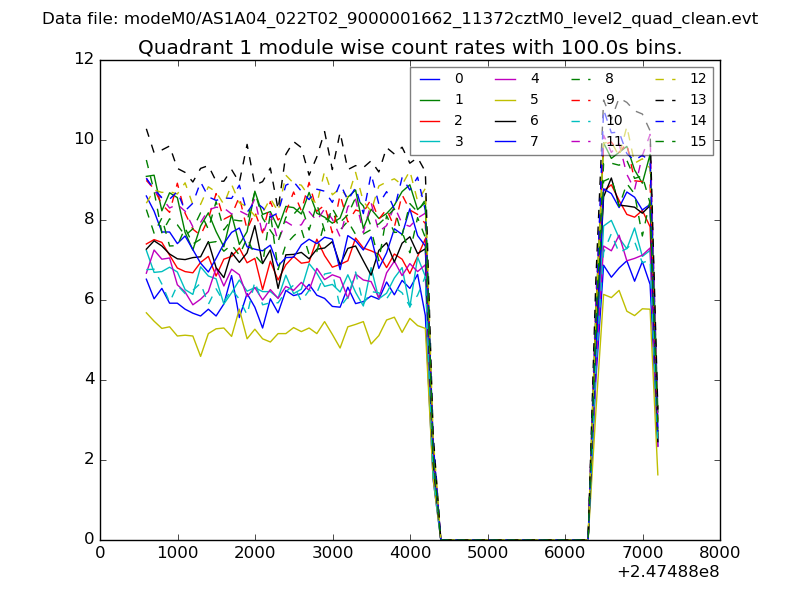
| Module-wise count rates for Quadrant A Data is divided into 100 sec bins |
 |
 |
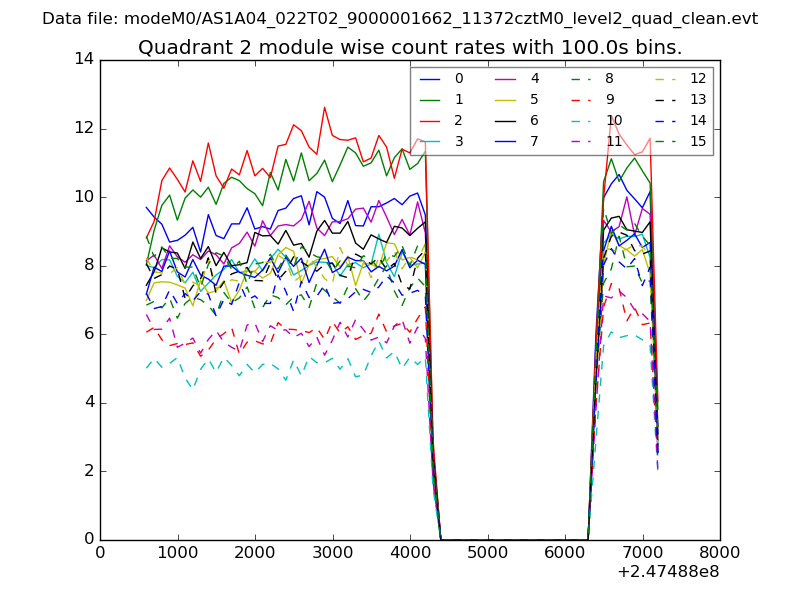
| Module-wise count rates for Quadrant B Data is divided into 100 sec bins |
 |
 |
| Module-wise count rates for Quadrant C Data is divided into 100 sec bins |
 |
 |
| Module-wise count rates for Quadrant D Data is divided into 100 sec bins |
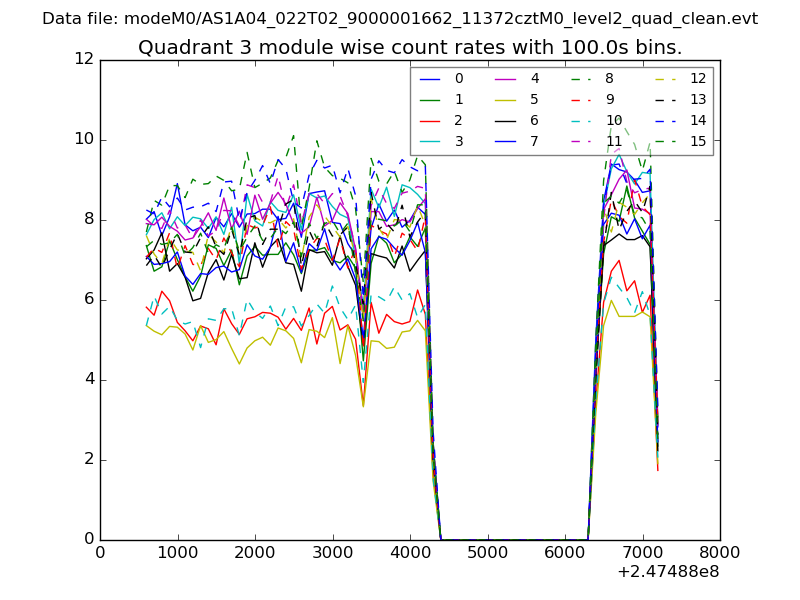 |
 |
| Parameter | Plot |
|---|---|
| CZT HV Monitor | 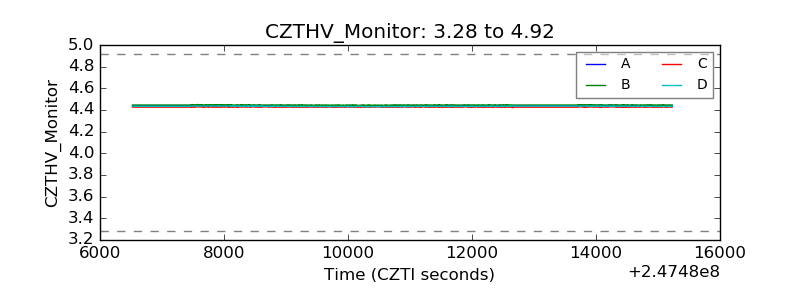 |
| D_VDD | 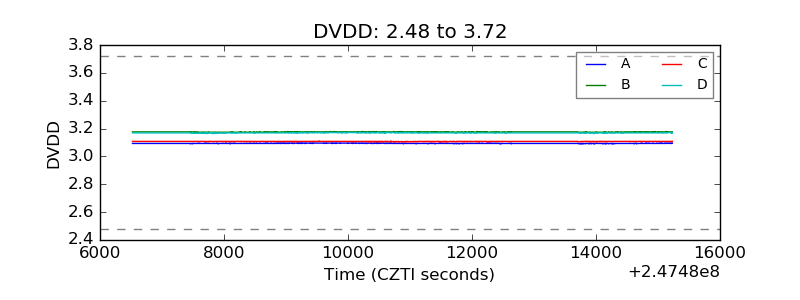 |
| Temperature 1 | 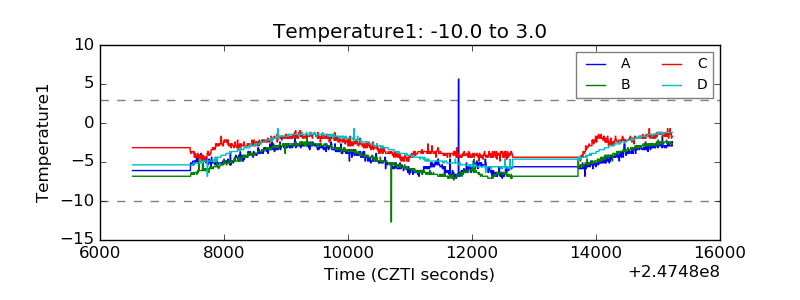 |
| Veto HV Monitor | 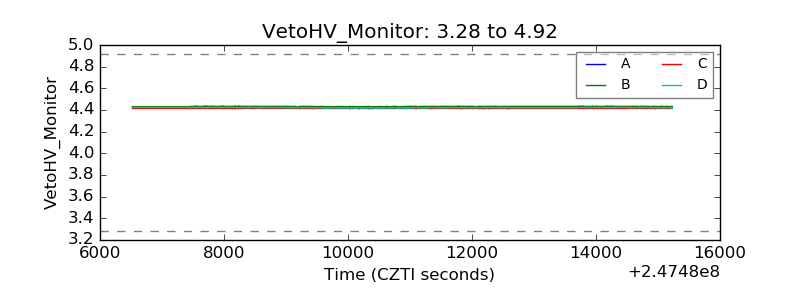 |
| Veto LLD | 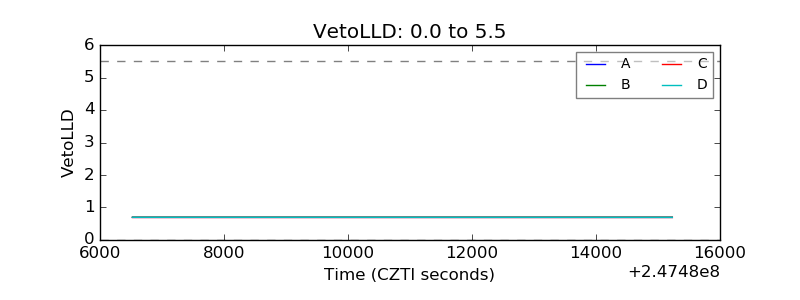 |
| Alpha Counter | 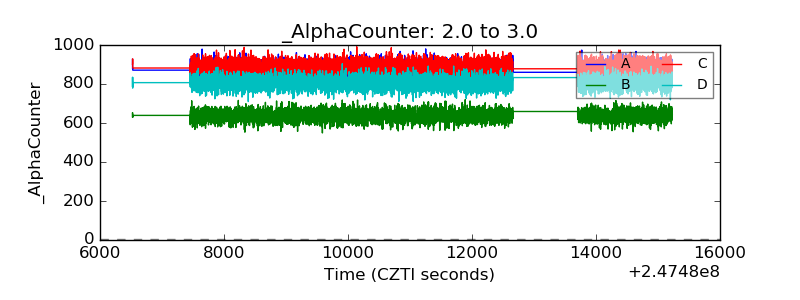 |
| _CPM_Rate | 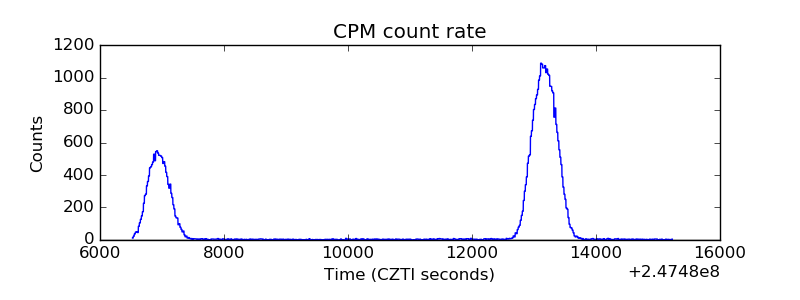 |
| CZT Counter | 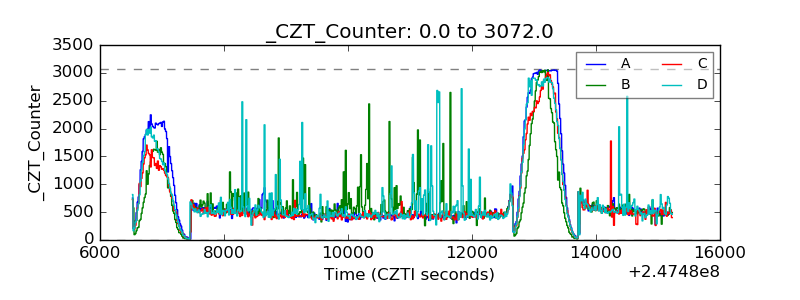 |
| +2.5 Volts monitor |  |
| +5 Volts monitor |  |
| _ROLL_ROT | 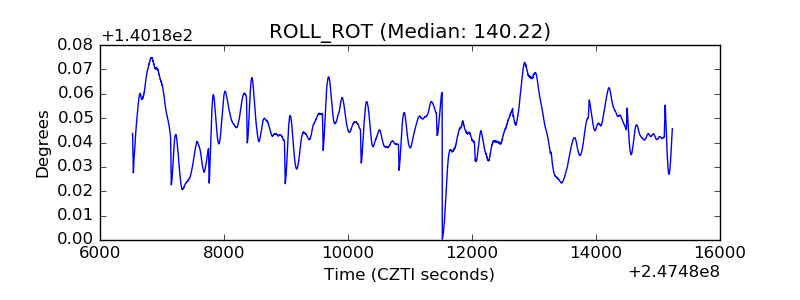 |
| _Roll_DEC | 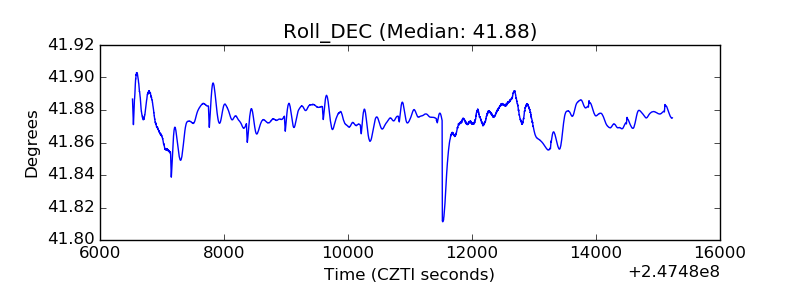 |
| _Roll_RA | 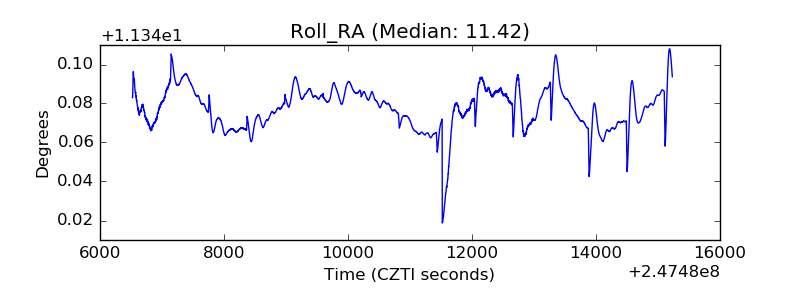 |
| Veto Counter | 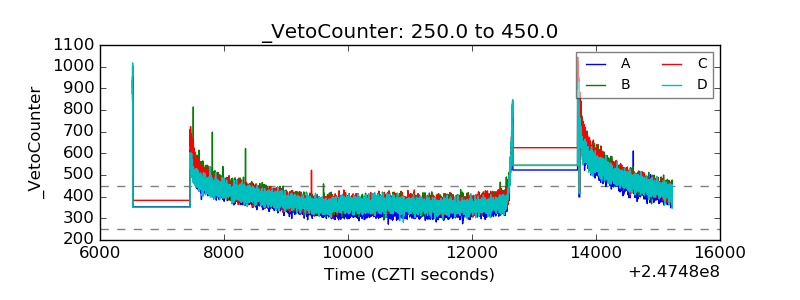 |