| Param | Original file | Final file |
|---|---|---|
| Filename | modeM0/AS1A04_022T02_9000001662_11374cztM0_level2.evt | modeM0/AS1A04_022T02_9000001662_11374cztM0_level2_quad_clean.evt |
| Size (bytes) | 544,109,760 | 101,903,040 |
| Size | 518.9 MB | 97.2 MB |
| Events in quadrant A | 3,467,798 | 655,103 |
| Events in quadrant B | 4,430,294 | 643,055 |
| Events in quadrant C | 3,321,170 | 687,156 |
| Events in quadrant D | 4,797,132 | 626,163 |
| Mode SS | |||
|---|---|---|---|
| Quadrant | BADHDUFLAG | Total packets | Discarded packets |
| A | 0 | 140 | 0 |
| B | 0 | 140 | 0 |
| C | 0 | 140 | 0 |
| D | 0 | 140 | 0 |
| Mode M0 | |||
|---|---|---|---|
| Quadrant | BADHDUFLAG | Total packets | Discarded packets |
| A | 0 | 15026 | 2 |
| B | 0 | 17692 | 1 |
| C | 0 | 14268 | 1 |
| D | 0 | 18768 | 1 |
| Mode M9 | |||
|---|---|---|---|
| Quadrant | BADHDUFLAG | Total packets | Discarded packets |
| A | 0 | 23 | 0 |
| B | 0 | 23 | 0 |
| C | 0 | 23 | 0 |
| D | 0 | 23 | 0 |
| Quadrant | Total seconds | Saturated seconds | Saturation percentage |
|---|---|---|---|
| A | 6810 | 140 | 2.055800% |
| B | 6810 | 358 | 5.256975% |
| C | 6810 | 98 | 1.439060% |
| D | 6810 | 461 | 6.769457% |
Noise dominated data is calculated using 1-second bins in cleaned event files. If a bin has >2000 counts, and if more than 50% of those come from <1% of pixels, then it is considered to be noise-dominated and hence unusable.
| Quadrant | # 1 sec bins | Bins with >0 counts | Bins with >2000 counts | High rate bins dominated by noise | Noise dominated (total time) | Noise dominated (detector-on time) | Marked lightcurve |
|---|---|---|---|---|---|---|---|
| A | 9045 | 6813 | 0 | 0 | 0.00% | 0.00% | 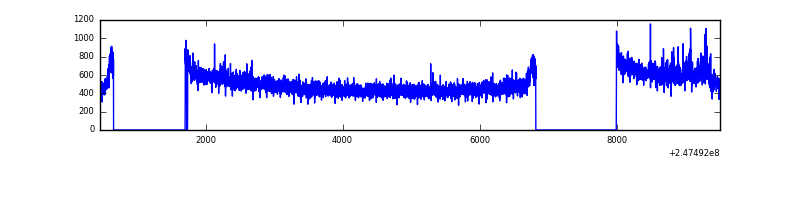 |
| B | 9045 | 6813 | 171 | 171 | 1.89% | 2.51% | 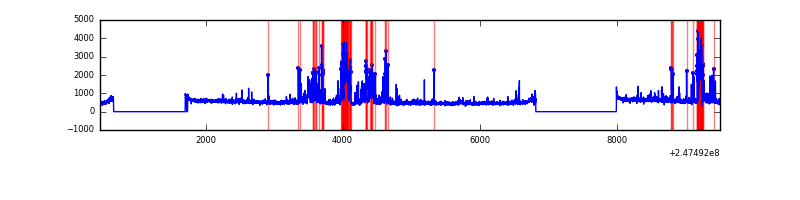 |
| C | 9045 | 6813 | 1 | 1 | 0.01% | 0.01% | 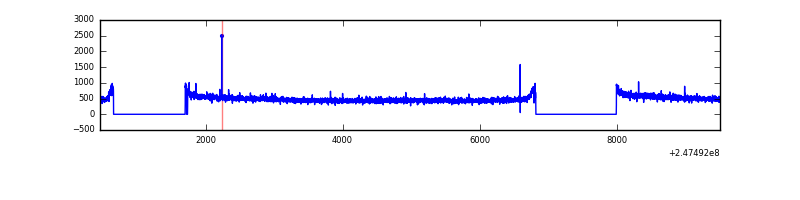 |
| D | 9045 | 6813 | 299 | 299 | 3.31% | 4.39% | 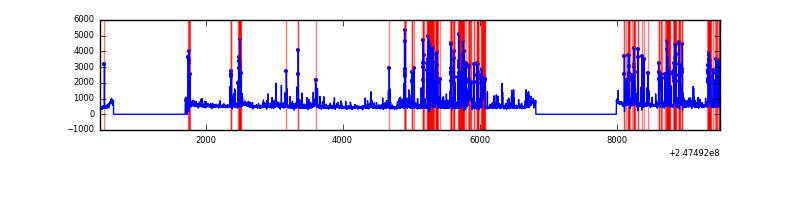 |
Top three noisy pixels from each quadrant. If the there are fewer than three noisy pixels in the level2.evt file, extra rows are filled as -1
| Pixel properties | Quadrant properties | ||||||
|---|---|---|---|---|---|---|---|
| Quadrant | DetID | PixID | Counts | Sigma | Mean | Median | Sigma |
| A | 13 | 251 | 72720 | 406.1 | 865 | 848 | 177.0 |
| A | 1 | 162 | 22009 | 119.57 | 865 | 848 | 177.0 |
| A | 1 | 178 | 12829 | 67.7 | 865 | 848 | 177.0 |
| B | 3 | 64 | 546460 | 3413.27 | 846 | 827 | 159.9 |
| B | 4 | 239 | 350916 | 2190.02 | 846 | 827 | 159.9 |
| B | 11 | 51 | 136707 | 850.01 | 846 | 827 | 159.9 |
| C | 13 | 61 | 6116 | 26.61 | 850 | 857 | 197.6 |
| C | 14 | 234 | 4169 | 16.76 | 850 | 857 | 197.6 |
| C | 12 | 4 | 2929 | 10.48 | 850 | 857 | 197.6 |
| D | 14 | 34 | 414599 | 2159.26 | 823 | 808 | 191.6 |
| D | 10 | 253 | 347667 | 1809.99 | 823 | 808 | 191.6 |
| D | 1 | 52 | 282976 | 1472.42 | 823 | 808 | 191.6 |
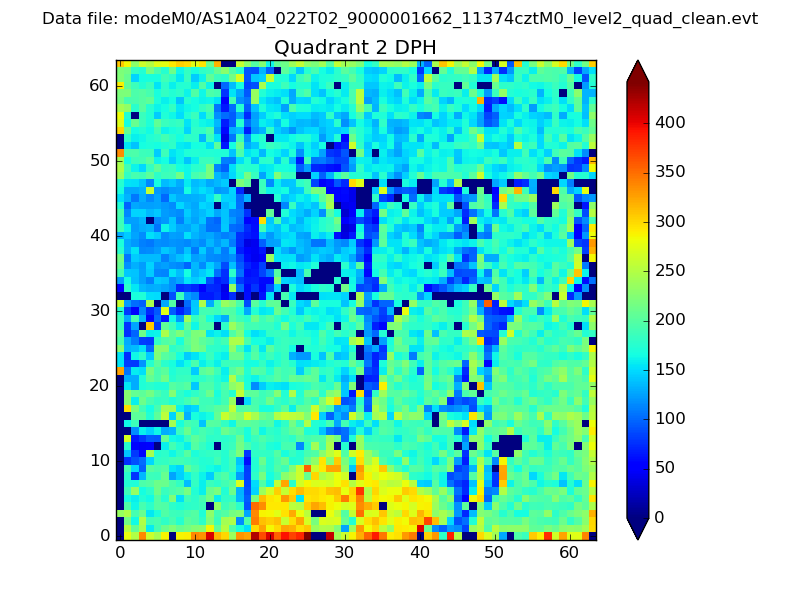
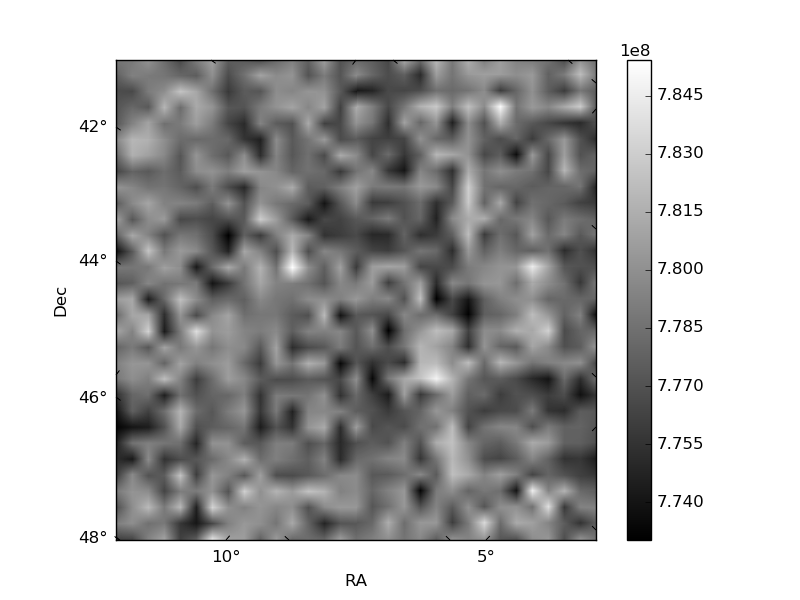
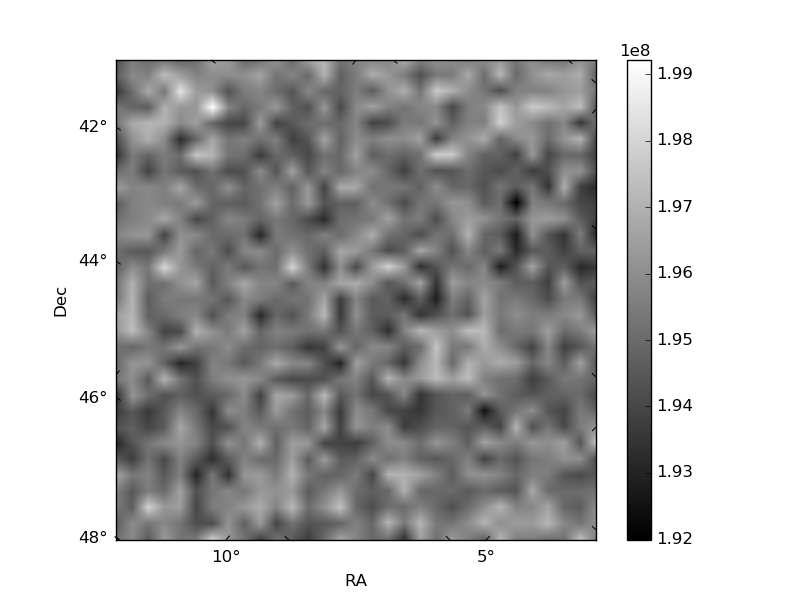
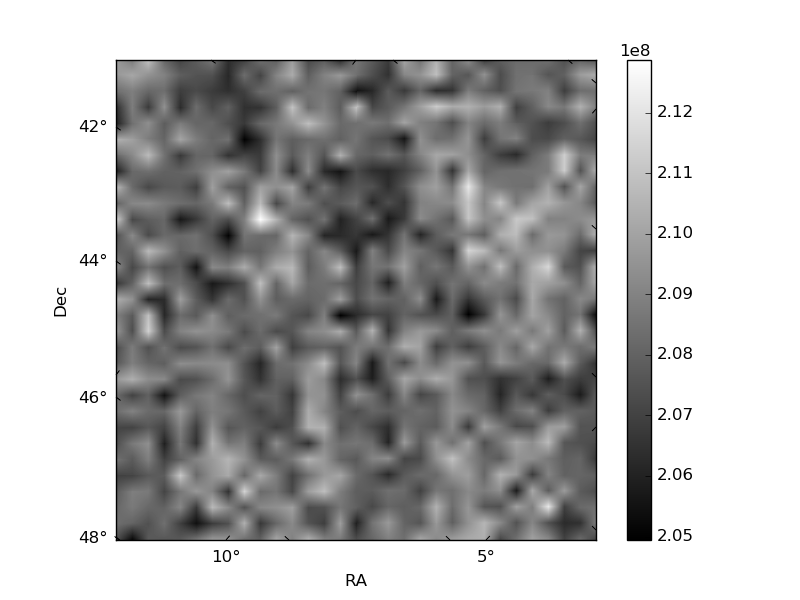
Histogram calculated using DETX and DETY for each event in the final _common_clean file
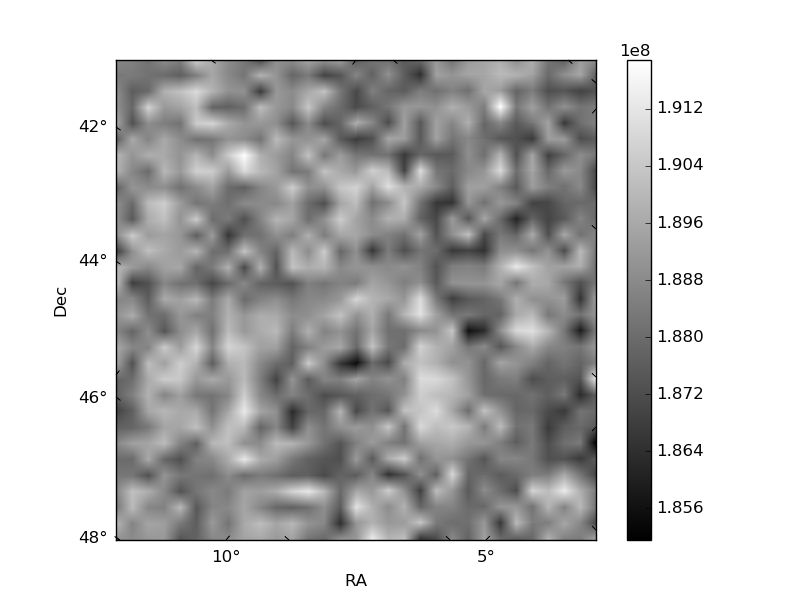
| Quadrant A | 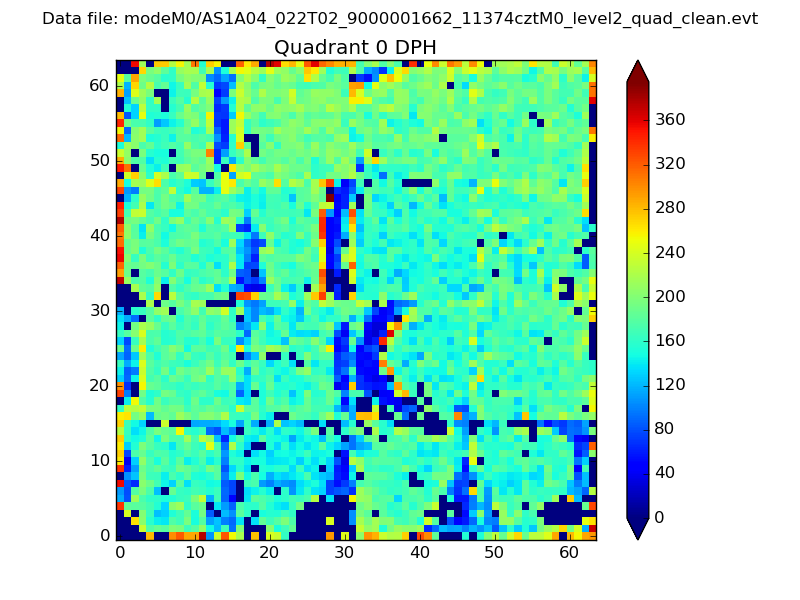 |
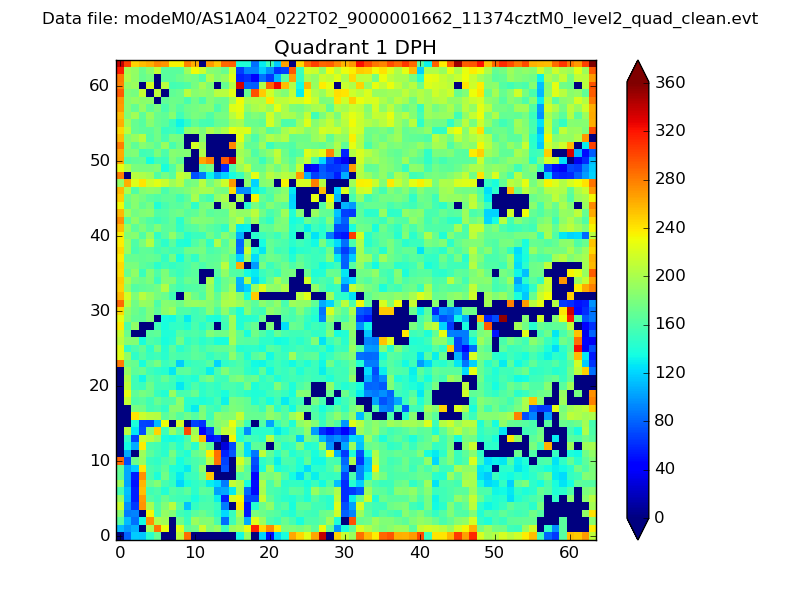 |
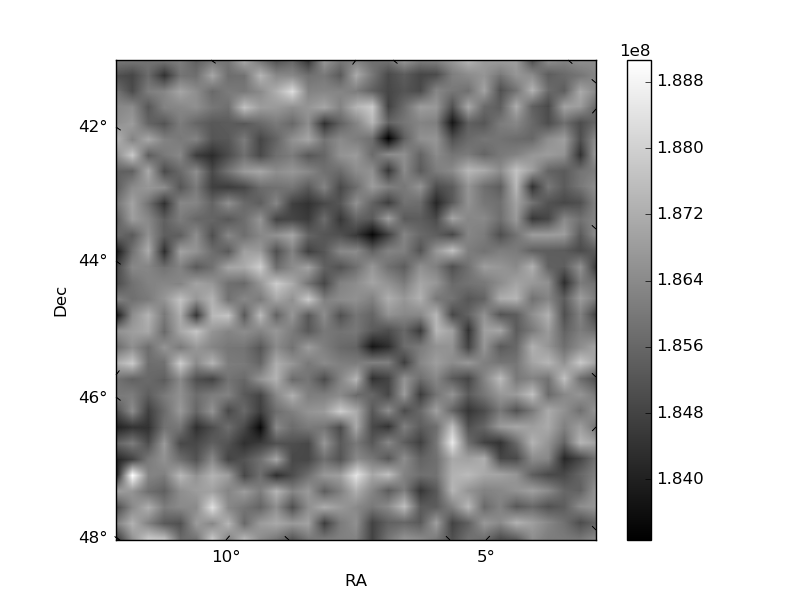
Quadrant B |
|---|---|---|---|
| Quadrant D | 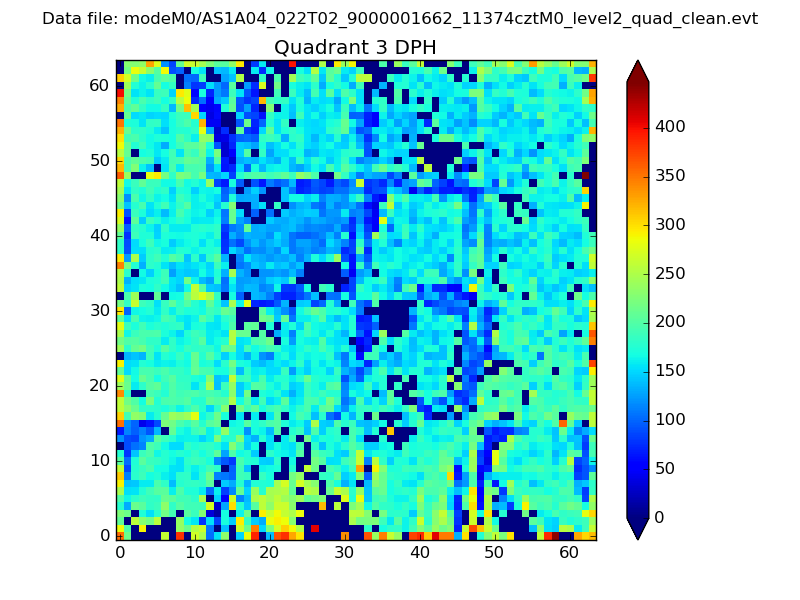 |
 |
Quadrant C |
| Plot type | Count rate plots | Images |
|---|---|---|
| Comparison with Poisson distribution Blue bars denote a histogram of data divided into 1 sec bins. Red curve is a Poisson curve with rate = median count rate of data. |
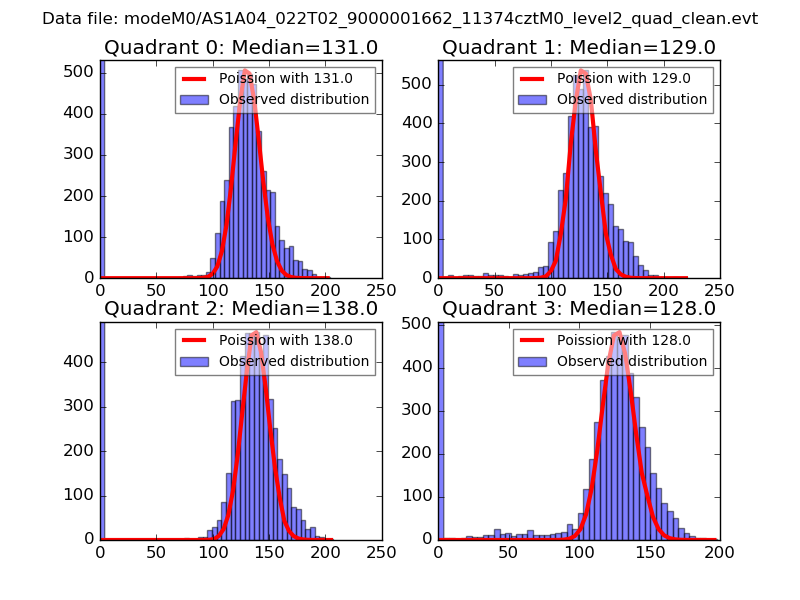 |
 |
| Quadrant-wise count rates Data is divided into 100 sec bins |
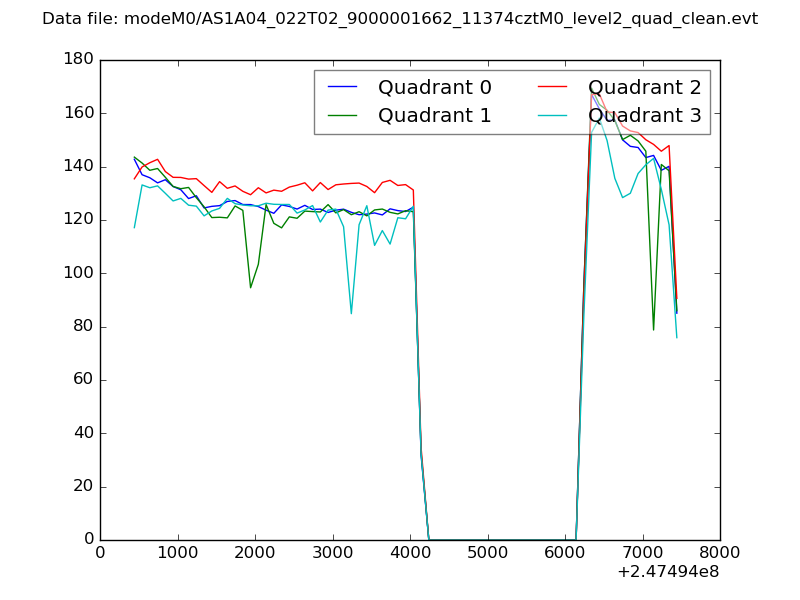 |
|
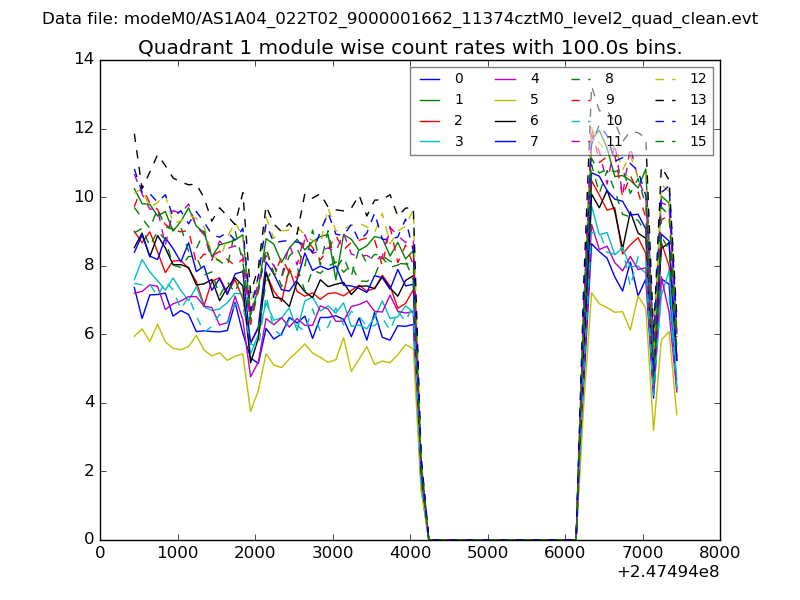
| Module-wise count rates for Quadrant A Data is divided into 100 sec bins |
 |
 |
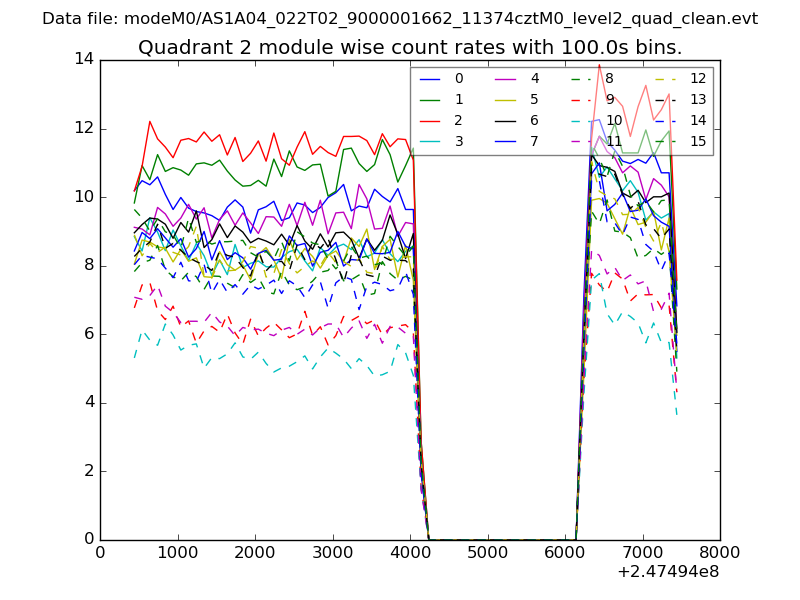
| Module-wise count rates for Quadrant B Data is divided into 100 sec bins |
 |
 |
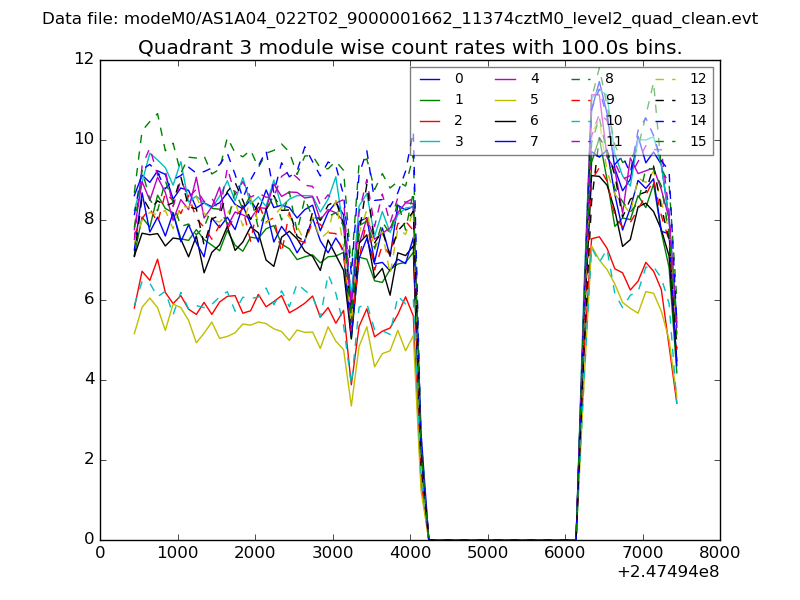
| Module-wise count rates for Quadrant C Data is divided into 100 sec bins |
 |
 |
| Module-wise count rates for Quadrant D Data is divided into 100 sec bins |
 |
 |
| Parameter | Plot |
|---|---|
| CZT HV Monitor | 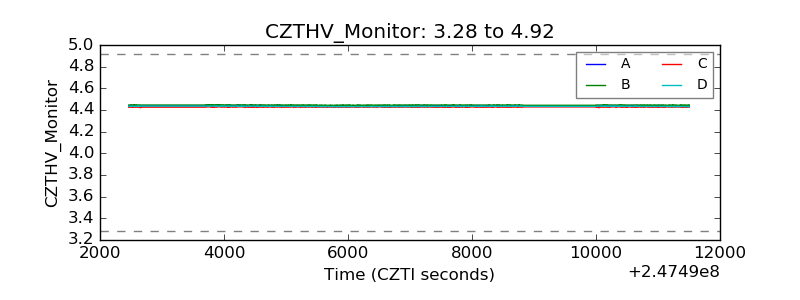 |
| D_VDD | 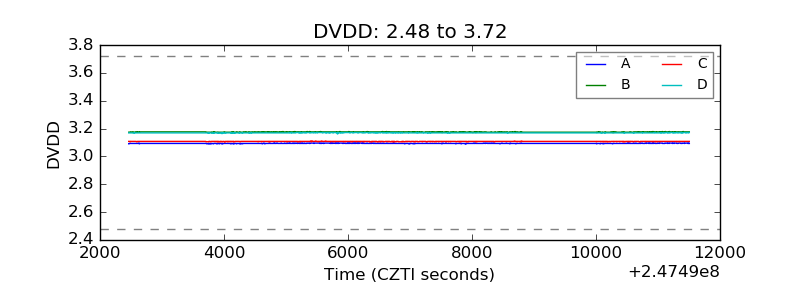 |
| Temperature 1 |  |
| Veto HV Monitor | 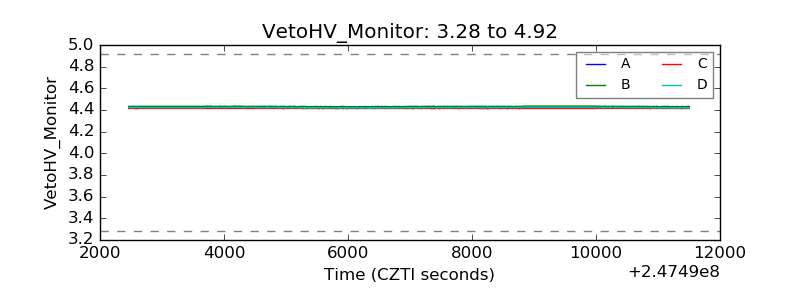 |
| Veto LLD | 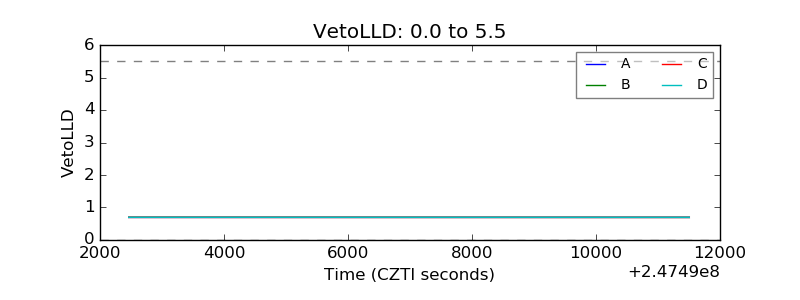 |
| Alpha Counter | 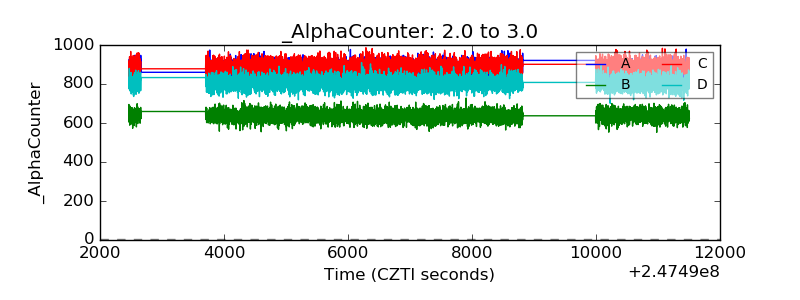 |
| _CPM_Rate | 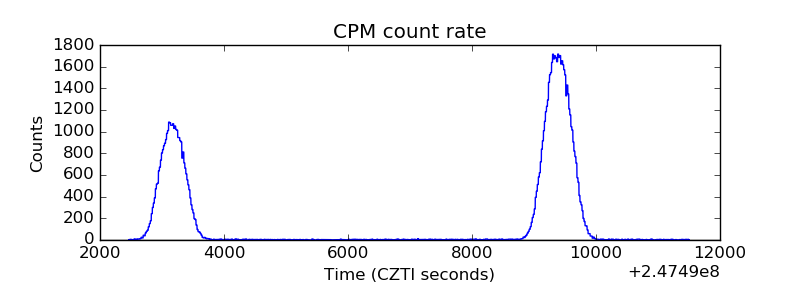 |
| CZT Counter | 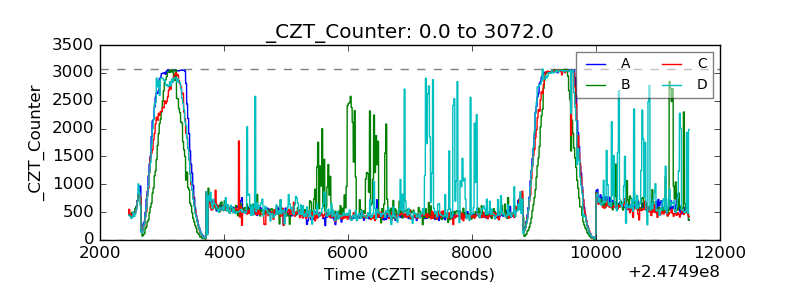 |
| +2.5 Volts monitor |  |
| +5 Volts monitor |  |
| _ROLL_ROT | 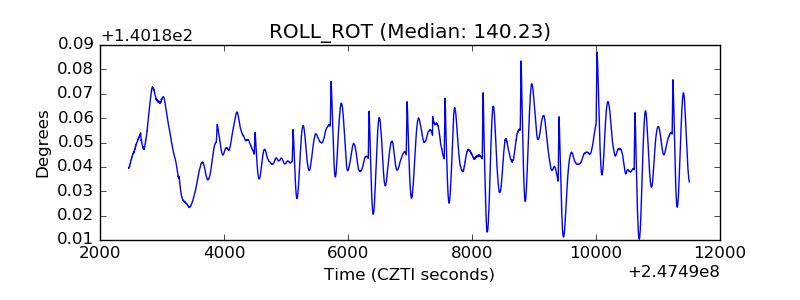 |
| _Roll_DEC | 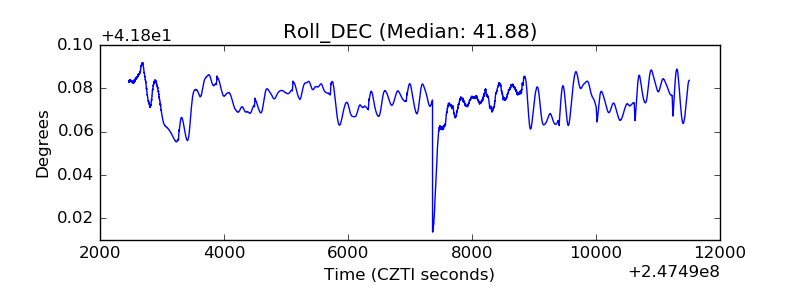 |
| _Roll_RA | 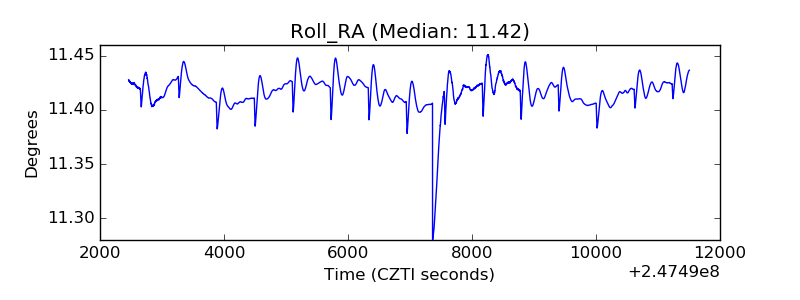 |
| Veto Counter | 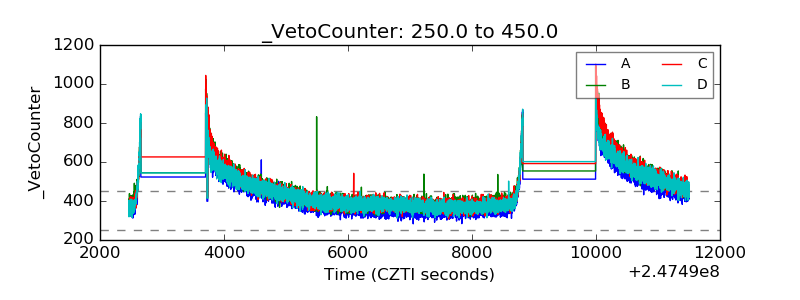 |