| Param | Original file | Final file |
|---|---|---|
| Filename | modeM0/AS1A04_022T02_9000001662_11375cztM0_level2.evt | modeM0/AS1A04_022T02_9000001662_11375cztM0_level2_quad_clean.evt |
| Size (bytes) | 491,722,560 | 108,077,760 |
| Size | 468.9 MB | 103.1 MB |
| Events in quadrant A | 3,265,848 | 715,056 |
| Events in quadrant B | 4,357,906 | 692,241 |
| Events in quadrant C | 2,919,499 | 754,756 |
| Events in quadrant D | 3,943,792 | 694,489 |
| Mode SS | |||
|---|---|---|---|
| Quadrant | BADHDUFLAG | Total packets | Discarded packets |
| A | 0 | 122 | 0 |
| B | 0 | 122 | 0 |
| C | 0 | 122 | 0 |
| D | 0 | 122 | 0 |
| Mode M0 | |||
|---|---|---|---|
| Quadrant | BADHDUFLAG | Total packets | Discarded packets |
| A | 0 | 13669 | 2 |
| B | 0 | 16896 | 1 |
| C | 0 | 12469 | 1 |
| D | 0 | 15698 | 1 |
| Mode M9 | |||
|---|---|---|---|
| Quadrant | BADHDUFLAG | Total packets | Discarded packets |
| A | 0 | 13 | 0 |
| B | 0 | 13 | 0 |
| C | 0 | 13 | 0 |
| D | 0 | 13 | 0 |
| Quadrant | Total seconds | Saturated seconds | Saturation percentage |
|---|---|---|---|
| A | 5961 | 70 | 1.174300% |
| B | 5961 | 437 | 7.330985% |
| C | 5961 | 41 | 0.687804% |
| D | 5961 | 302 | 5.066264% |
Noise dominated data is calculated using 1-second bins in cleaned event files. If a bin has >2000 counts, and if more than 50% of those come from <1% of pixels, then it is considered to be noise-dominated and hence unusable.
| Quadrant | # 1 sec bins | Bins with >0 counts | Bins with >2000 counts | High rate bins dominated by noise | Noise dominated (total time) | Noise dominated (detector-on time) | Marked lightcurve |
|---|---|---|---|---|---|---|---|
| A | 7246 | 5962 | 0 | 0 | 0.00% | 0.00% | 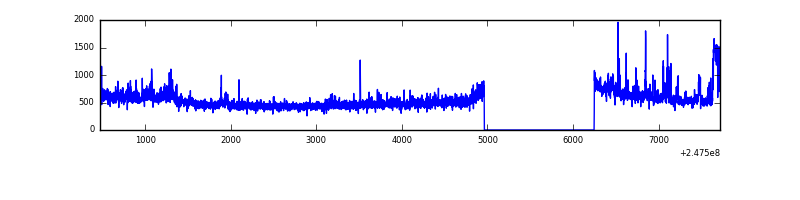 |
| B | 7246 | 5962 | 277 | 277 | 3.82% | 4.65% | 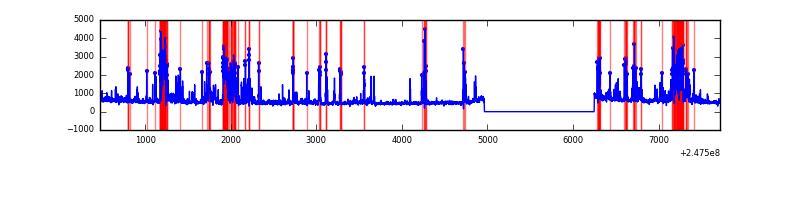 |
| C | 7246 | 5962 | 0 | 0 | 0.00% | 0.00% | 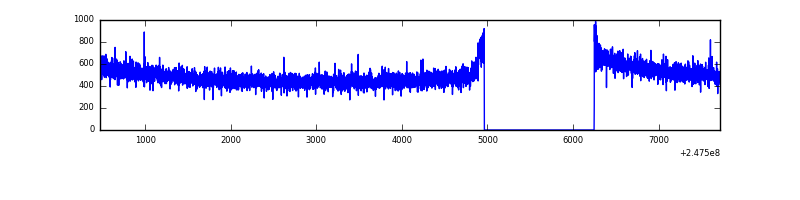 |
| D | 7246 | 5962 | 193 | 193 | 2.66% | 3.24% | 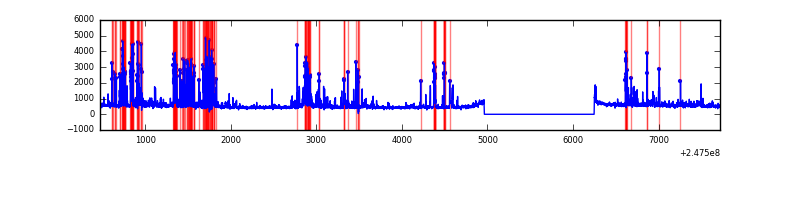 |
Top three noisy pixels from each quadrant. If the there are fewer than three noisy pixels in the level2.evt file, extra rows are filled as -1
| Pixel properties | Quadrant properties | ||||||
|---|---|---|---|---|---|---|---|
| Quadrant | DetID | PixID | Counts | Sigma | Mean | Median | Sigma |
| A | 13 | 251 | 138627 | 909.12 | 752 | 737 | 151.7 |
| A | 15 | 174 | 114616 | 750.81 | 752 | 737 | 151.7 |
| A | 8 | 15 | 57654 | 375.26 | 752 | 737 | 151.7 |
| B | 4 | 239 | 846698 | 6255.97 | 727 | 709 | 135.2 |
| B | 3 | 64 | 339968 | 2508.77 | 727 | 709 | 135.2 |
| B | 11 | 51 | 155612 | 1145.49 | 727 | 709 | 135.2 |
| C | 13 | 61 | 5382 | 26.38 | 749 | 754 | 175.4 |
| C | 3 | 202 | 1803 | 5.98 | 749 | 754 | 175.4 |
| C | -1 | -1 | -1 | -1.0 | 749 | 754 | 175.4 |
| D | 1 | 52 | 403022 | 2374.74 | 727 | 714 | 169.4 |
| D | 2 | 120 | 183386 | 1078.27 | 727 | 714 | 169.4 |
| D | 14 | 34 | 175475 | 1031.58 | 727 | 714 | 169.4 |
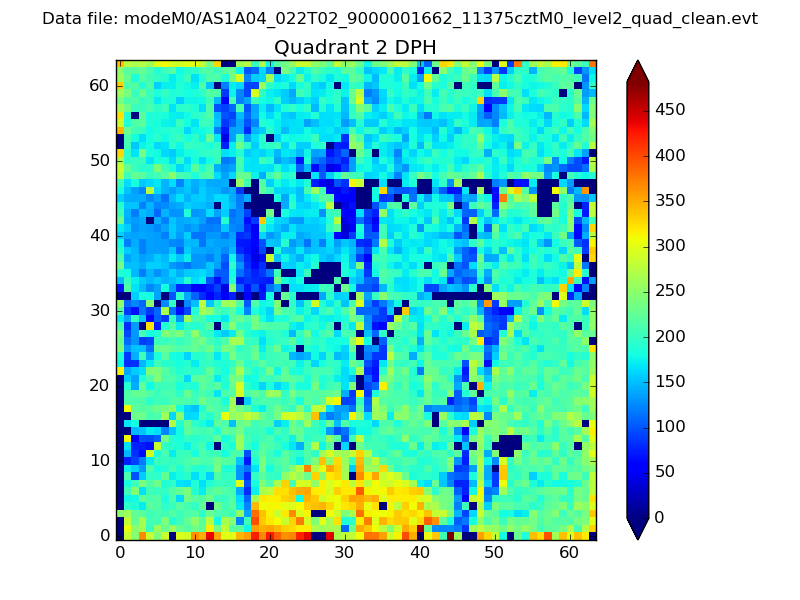
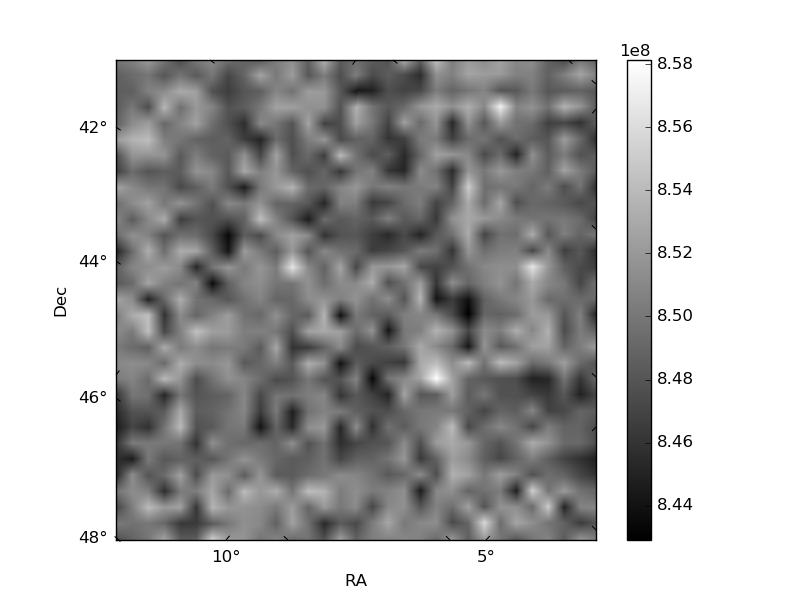
Histogram calculated using DETX and DETY for each event in the final _common_clean file
| Quadrant A | 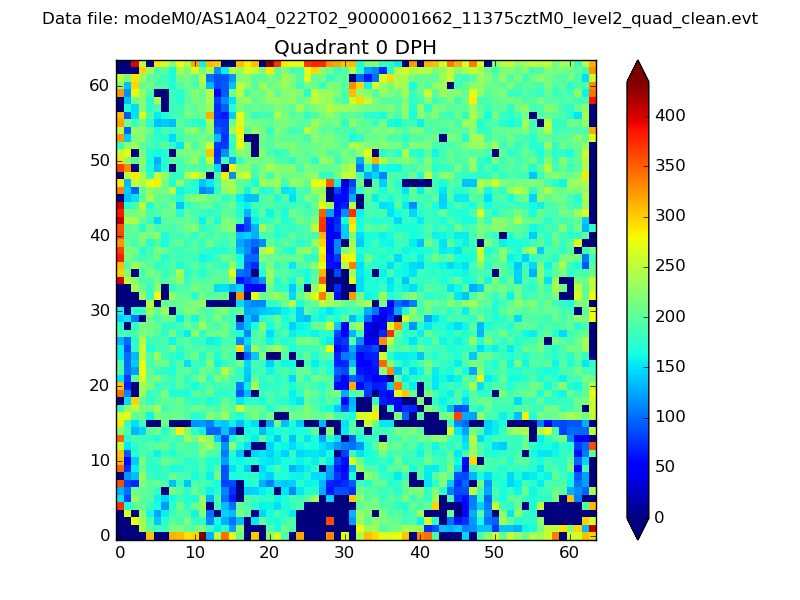 |
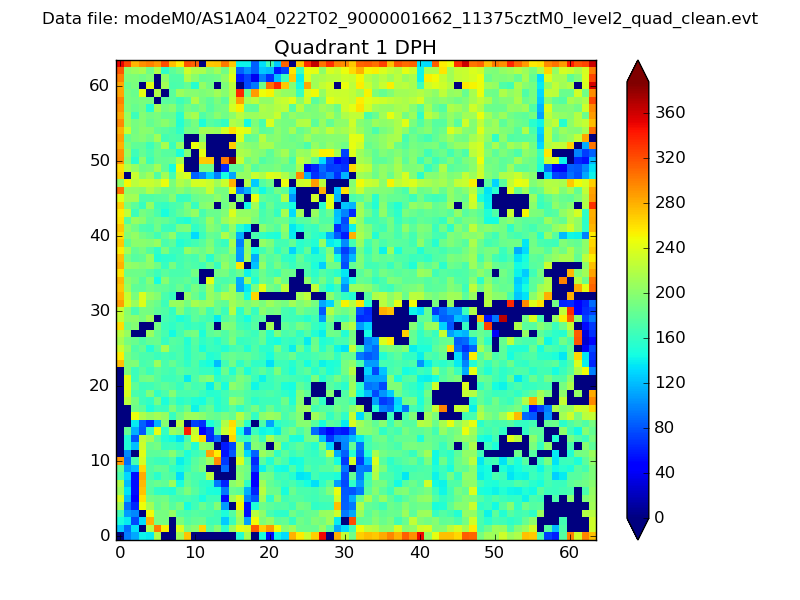 |
Quadrant B |
|---|---|---|---|
| Quadrant D | 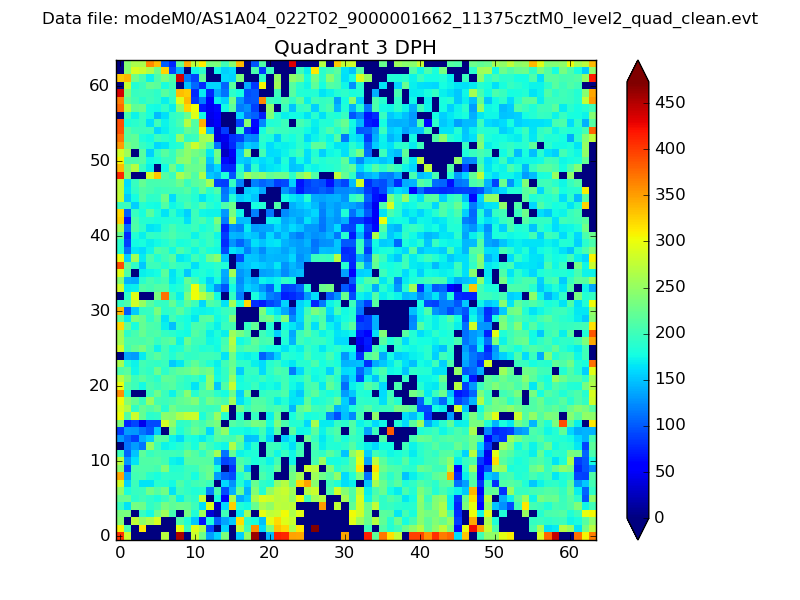 |
 |
Quadrant C |
| Plot type | Count rate plots | Images |
|---|---|---|
| Comparison with Poisson distribution Blue bars denote a histogram of data divided into 1 sec bins. Red curve is a Poisson curve with rate = median count rate of data. |
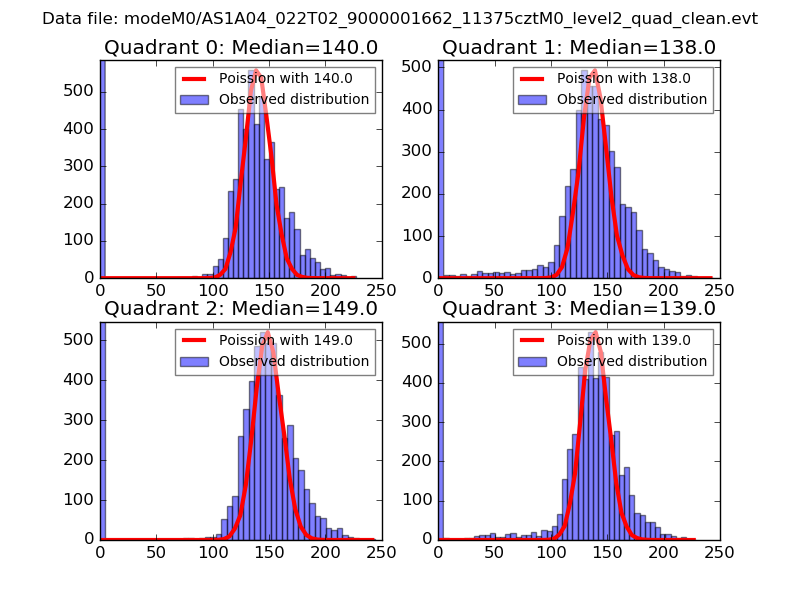 |
 |
| Quadrant-wise count rates Data is divided into 100 sec bins |
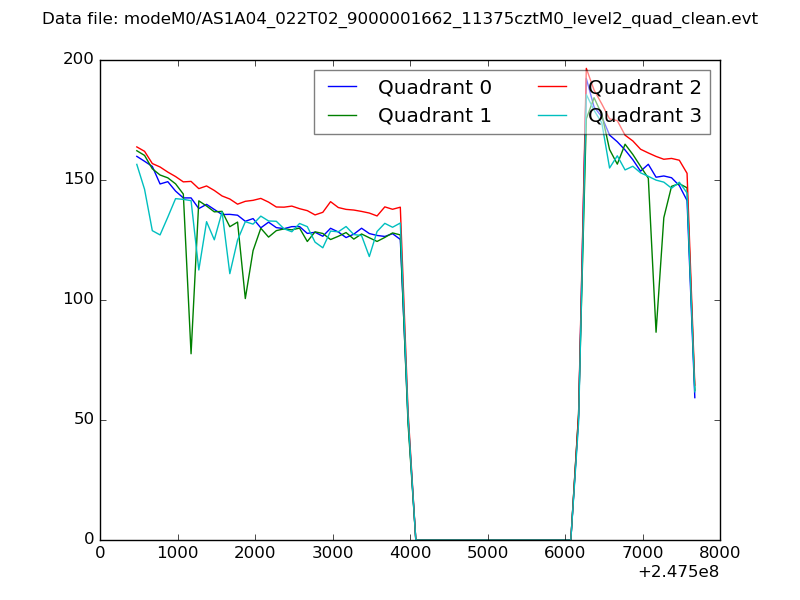 |
|
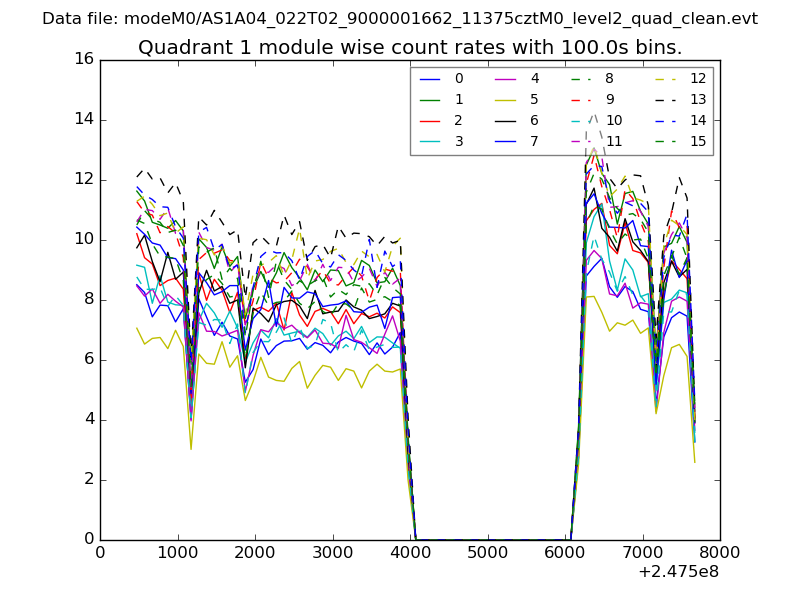
| Module-wise count rates for Quadrant A Data is divided into 100 sec bins |
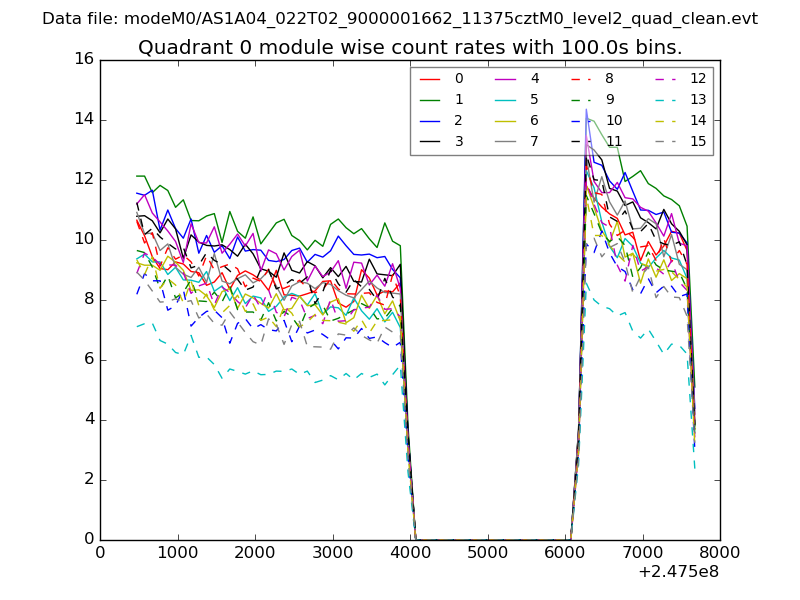 |
 |
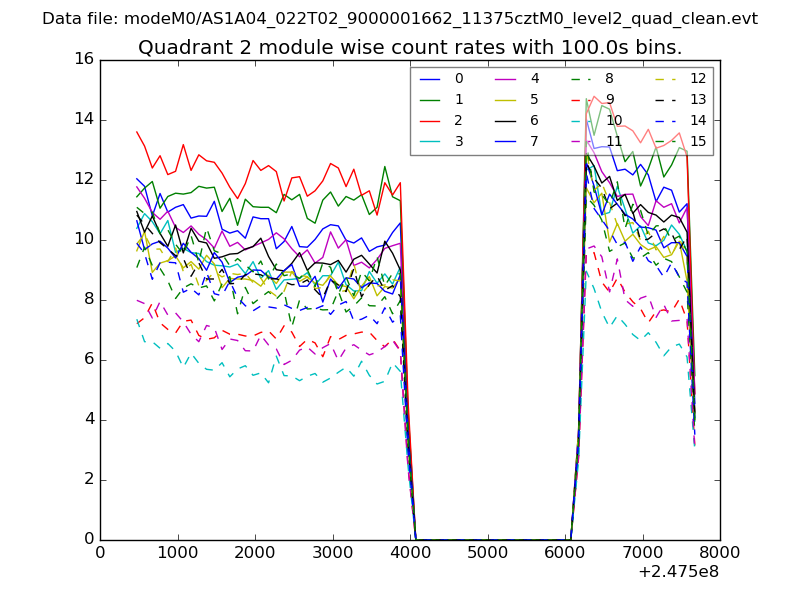
| Module-wise count rates for Quadrant B Data is divided into 100 sec bins |
 |
 |
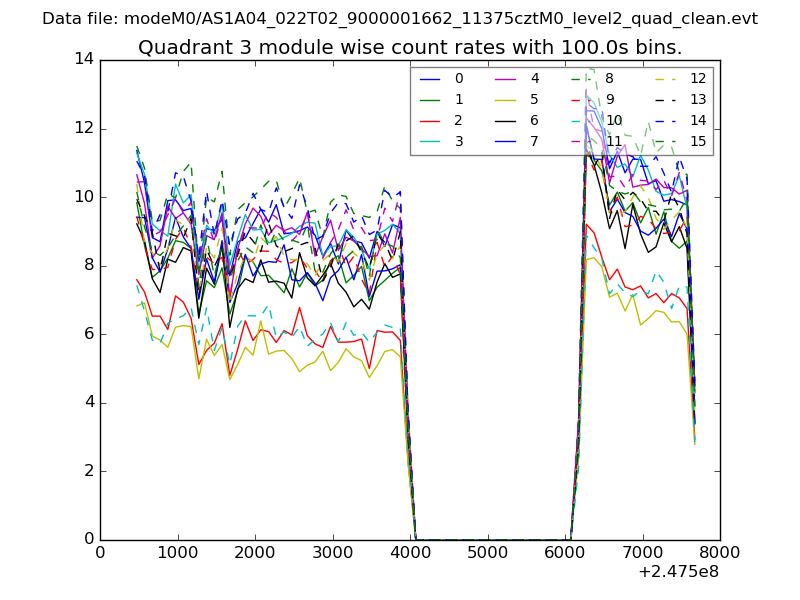
| Module-wise count rates for Quadrant C Data is divided into 100 sec bins |
 |
 |
| Module-wise count rates for Quadrant D Data is divided into 100 sec bins |
 |
 |
| Parameter | Plot |
|---|---|
| CZT HV Monitor | 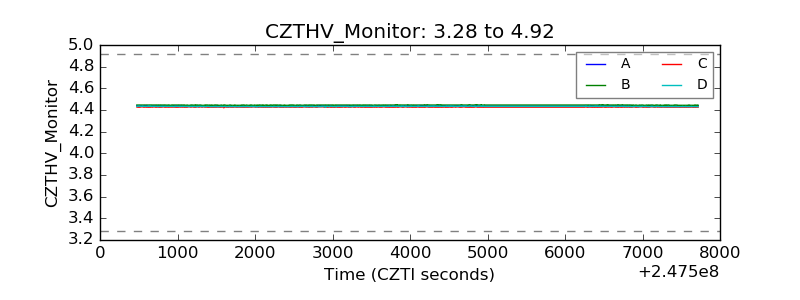 |
| D_VDD | 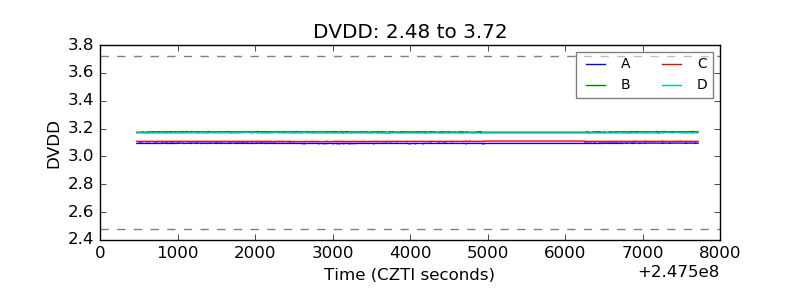 |
| Temperature 1 | 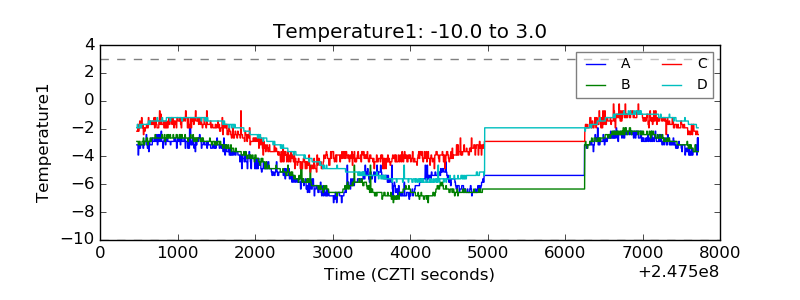 |
| Veto HV Monitor | 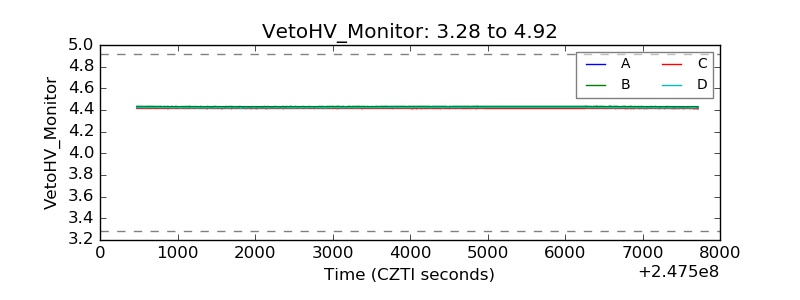 |
| Veto LLD | 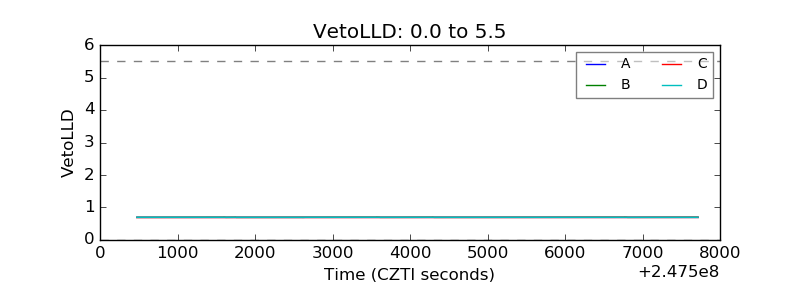 |
| Alpha Counter | 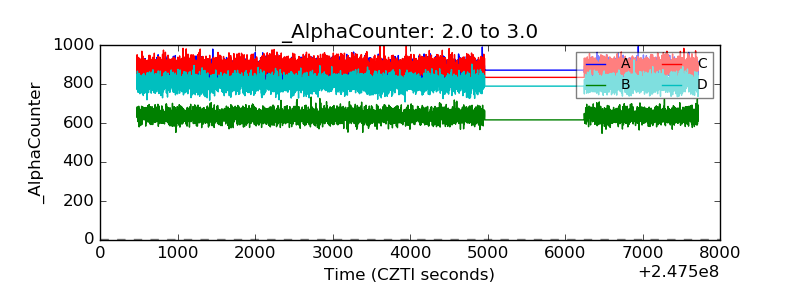 |
| _CPM_Rate | 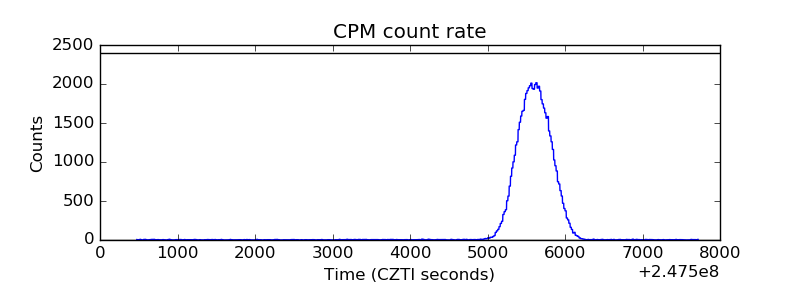 |
| CZT Counter | 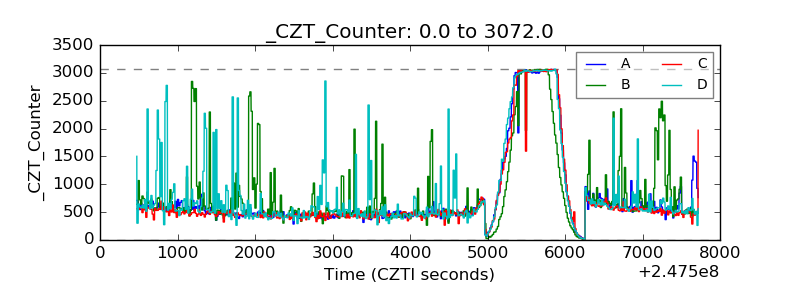 |
| +2.5 Volts monitor |  |
| +5 Volts monitor |  |
| _ROLL_ROT | 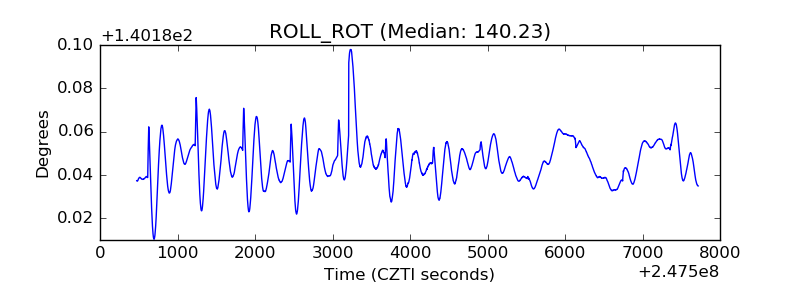 |
| _Roll_DEC | 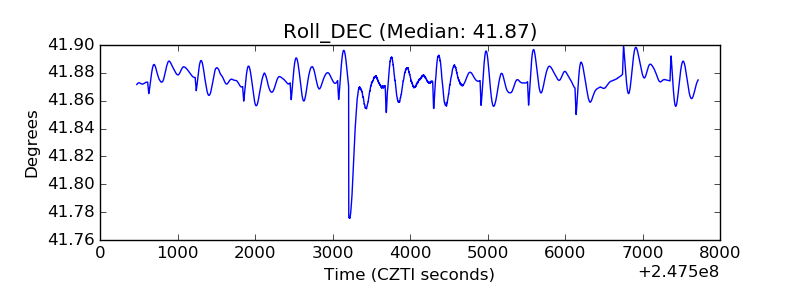 |
| _Roll_RA | 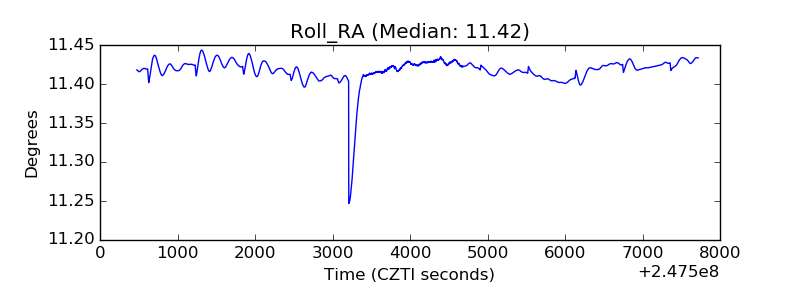 |
| Veto Counter | 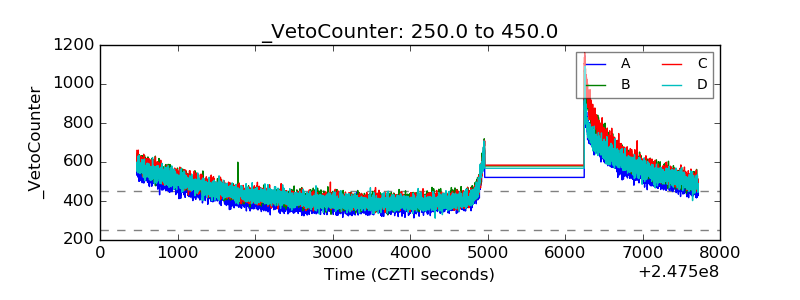 |