| Param | Original file | Final file |
|---|---|---|
| Filename | modeM0/AS1A04_022T02_9000001662_11376cztM0_level2.evt | modeM0/AS1A04_022T02_9000001662_11376cztM0_level2_quad_clean.evt |
| Size (bytes) | 541,886,400 | 108,550,080 |
| Size | 516.8 MB | 103.5 MB |
| Events in quadrant A | 4,046,602 | 707,047 |
| Events in quadrant B | 4,652,141 | 691,043 |
| Events in quadrant C | 3,093,054 | 757,443 |
| Events in quadrant D | 4,200,054 | 699,873 |
| Mode SS | |||
|---|---|---|---|
| Quadrant | BADHDUFLAG | Total packets | Discarded packets |
| A | 0 | 124 | 0 |
| B | 0 | 124 | 0 |
| C | 0 | 124 | 0 |
| D | 0 | 124 | 0 |
| Mode M0 | |||
|---|---|---|---|
| Quadrant | BADHDUFLAG | Total packets | Discarded packets |
| A | 0 | 16245 | 2 |
| B | 0 | 17937 | 1 |
| C | 0 | 13047 | 1 |
| D | 0 | 16613 | 1 |
| Mode M9 | |||
|---|---|---|---|
| Quadrant | BADHDUFLAG | Total packets | Discarded packets |
| A | 0 | 14 | 0 |
| B | 0 | 14 | 0 |
| C | 0 | 14 | 0 |
| D | 0 | 14 | 0 |
| Quadrant | Total seconds | Saturated seconds | Saturation percentage |
|---|---|---|---|
| A | 6194 | 139 | 2.244107% |
| B | 6194 | 476 | 7.684856% |
| C | 6194 | 52 | 0.839522% |
| D | 6194 | 216 | 3.487246% |
Noise dominated data is calculated using 1-second bins in cleaned event files. If a bin has >2000 counts, and if more than 50% of those come from <1% of pixels, then it is considered to be noise-dominated and hence unusable.
| Quadrant | # 1 sec bins | Bins with >0 counts | Bins with >2000 counts | High rate bins dominated by noise | Noise dominated (total time) | Noise dominated (detector-on time) | Marked lightcurve |
|---|---|---|---|---|---|---|---|
| A | 7524 | 6195 | 40 | 40 | 0.53% | 0.65% | 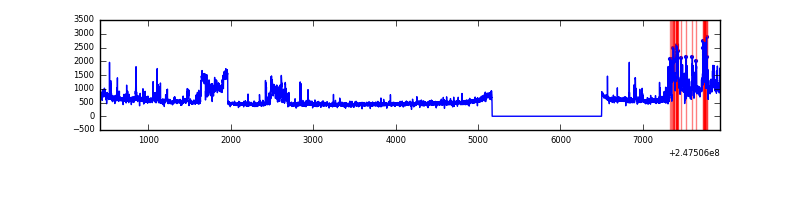 |
| B | 7524 | 6195 | 290 | 290 | 3.85% | 4.68% | 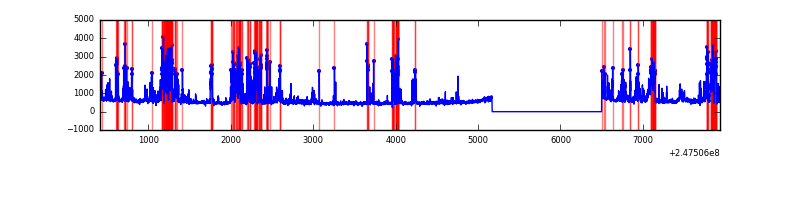 |
| C | 7524 | 6195 | 0 | 0 | 0.00% | 0.00% | 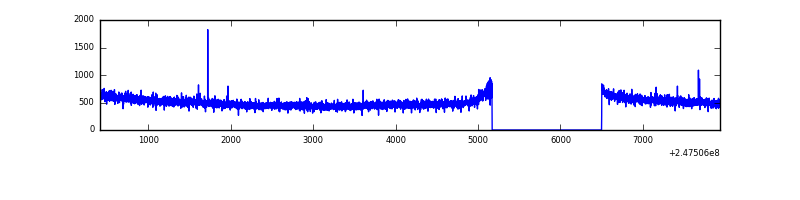 |
| D | 7524 | 6195 | 121 | 121 | 1.61% | 1.95% | 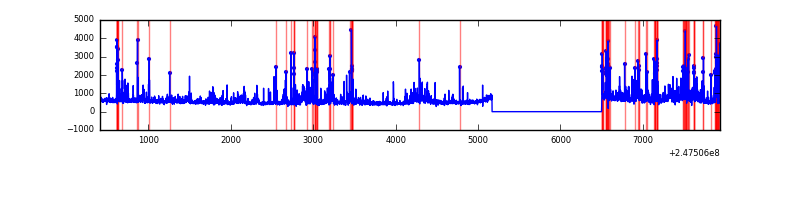 |
Top three noisy pixels from each quadrant. If the there are fewer than three noisy pixels in the level2.evt file, extra rows are filled as -1
| Pixel properties | Quadrant properties | ||||||
|---|---|---|---|---|---|---|---|
| Quadrant | DetID | PixID | Counts | Sigma | Mean | Median | Sigma |
| A | 15 | 174 | 674780 | 4254.59 | 791 | 775 | 158.4 |
| A | 8 | 5 | 231903 | 1458.97 | 791 | 775 | 158.4 |
| A | 8 | 15 | 63828 | 398.02 | 791 | 775 | 158.4 |
| B | 4 | 239 | 1311962 | 9247.22 | 767 | 749 | 141.8 |
| B | 3 | 64 | 146801 | 1030.02 | 767 | 749 | 141.8 |
| B | 11 | 51 | 112966 | 791.4 | 767 | 749 | 141.8 |
| C | 13 | 61 | 5754 | 27.08 | 792 | 797 | 183.0 |
| C | 8 | 222 | 2855 | 11.24 | 792 | 797 | 183.0 |
| C | 12 | 4 | 2672 | 10.24 | 792 | 797 | 183.0 |
| D | 1 | 52 | 384741 | 2071.86 | 770 | 753 | 185.3 |
| D | 14 | 34 | 250968 | 1350.07 | 770 | 753 | 185.3 |
| D | 2 | 120 | 207973 | 1118.09 | 770 | 753 | 185.3 |
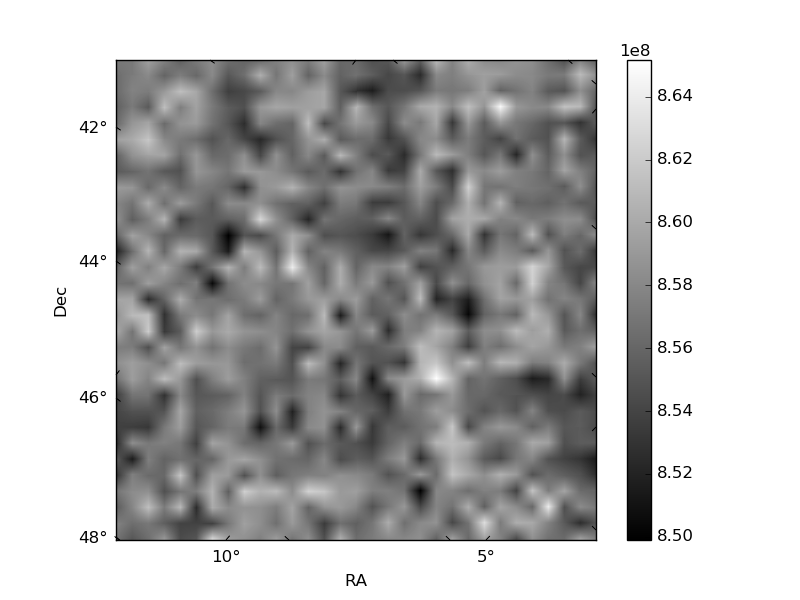
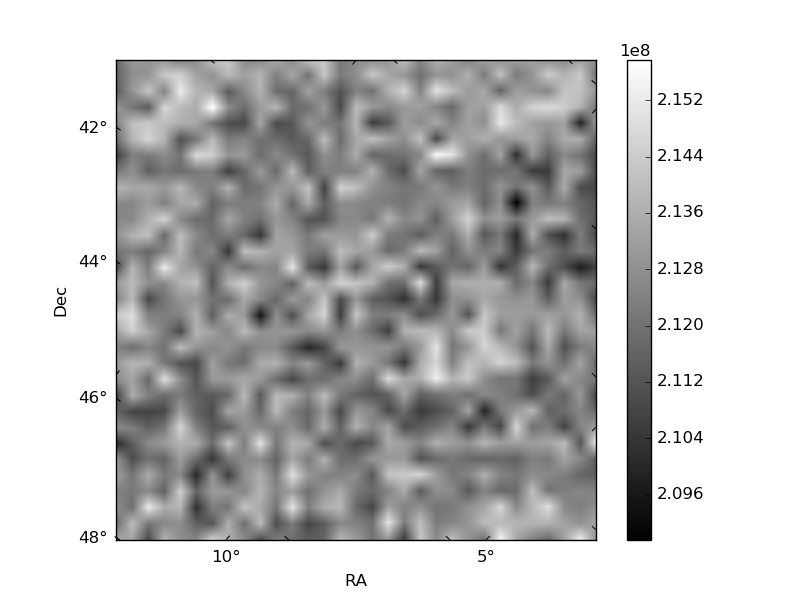
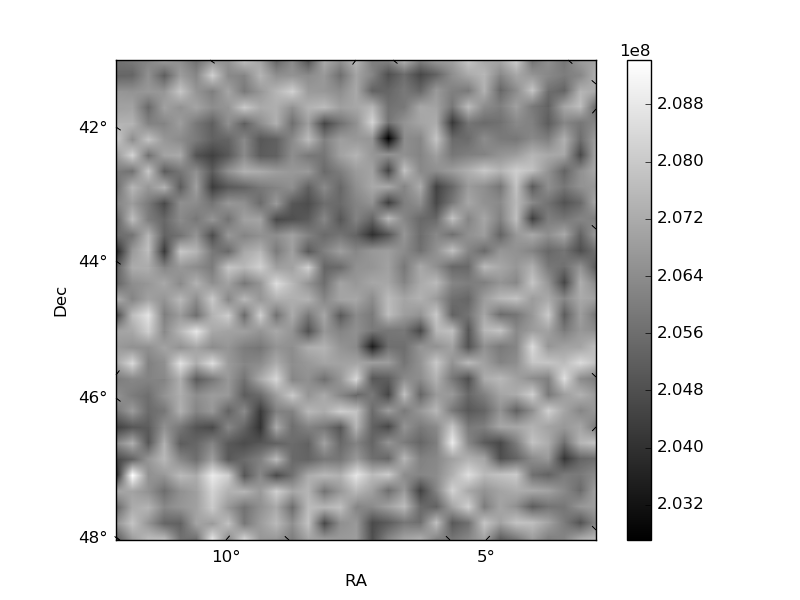
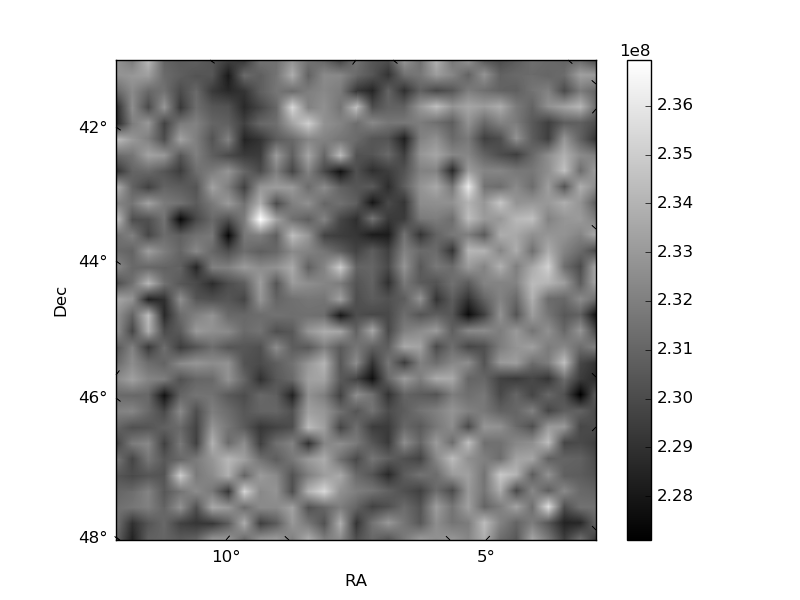
Histogram calculated using DETX and DETY for each event in the final _common_clean file
| Quadrant A | 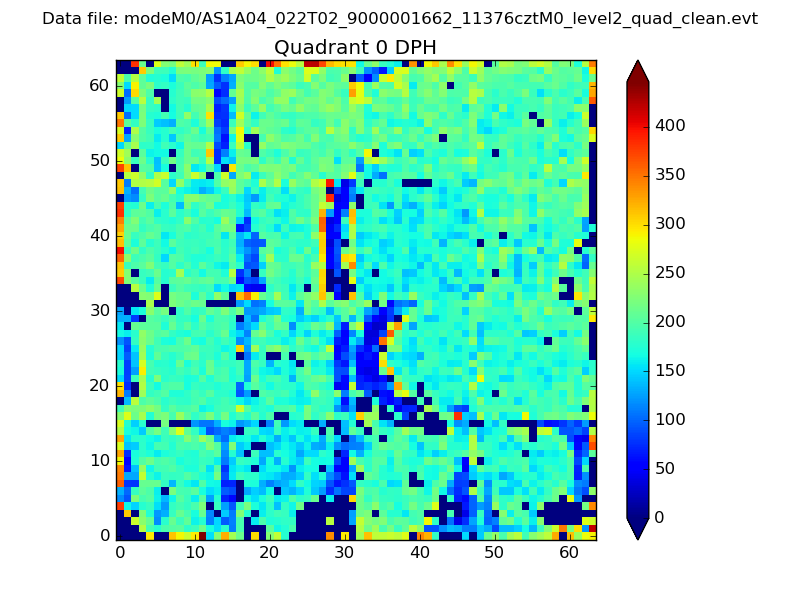 |
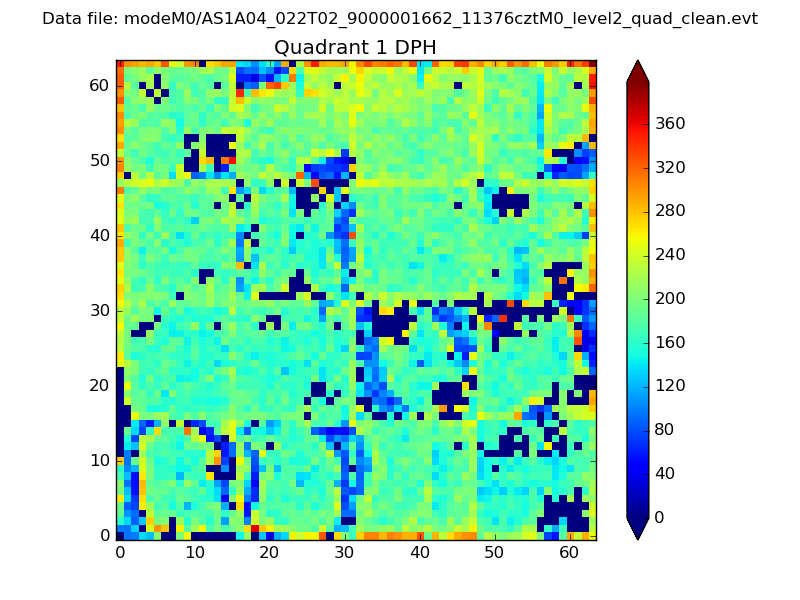 |
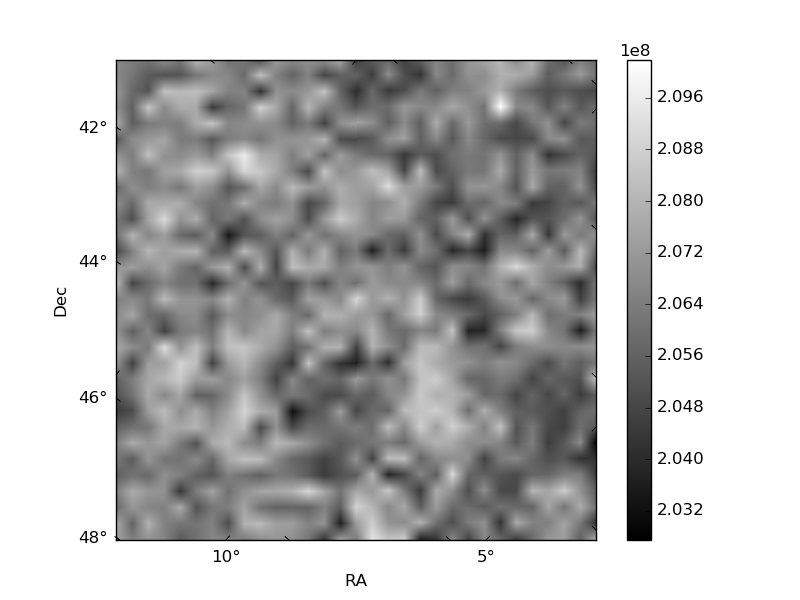
Quadrant B |
|---|---|---|---|
| Quadrant D | 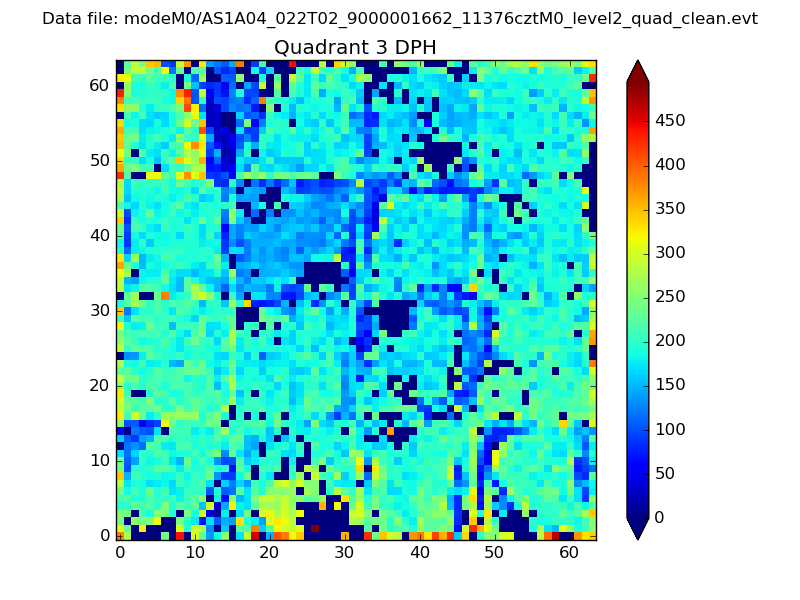 |
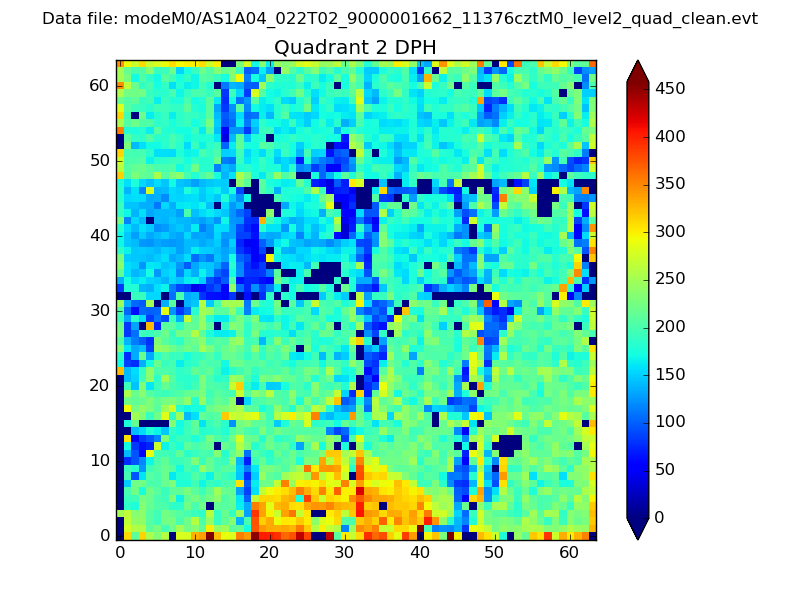 |
Quadrant C |
| Plot type | Count rate plots | Images |
|---|---|---|
| Comparison with Poisson distribution Blue bars denote a histogram of data divided into 1 sec bins. Red curve is a Poisson curve with rate = median count rate of data. |
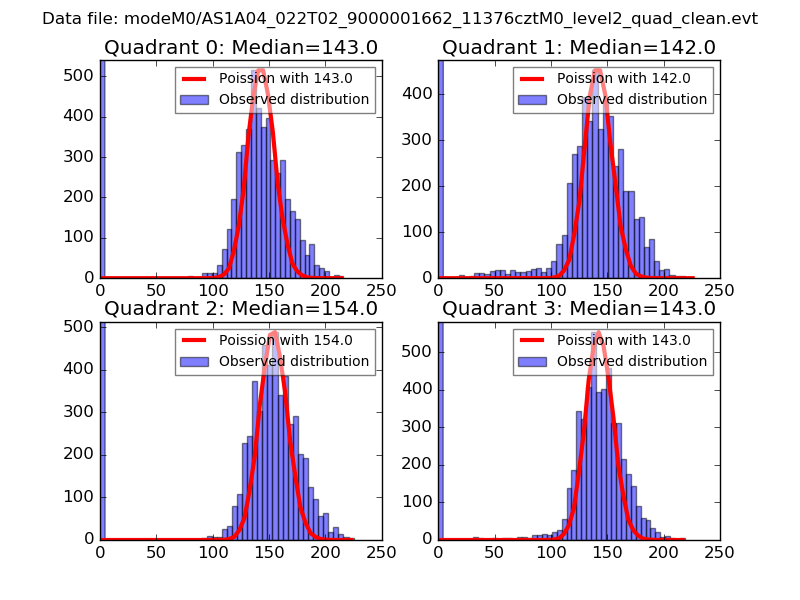 |
 |
| Quadrant-wise count rates Data is divided into 100 sec bins |
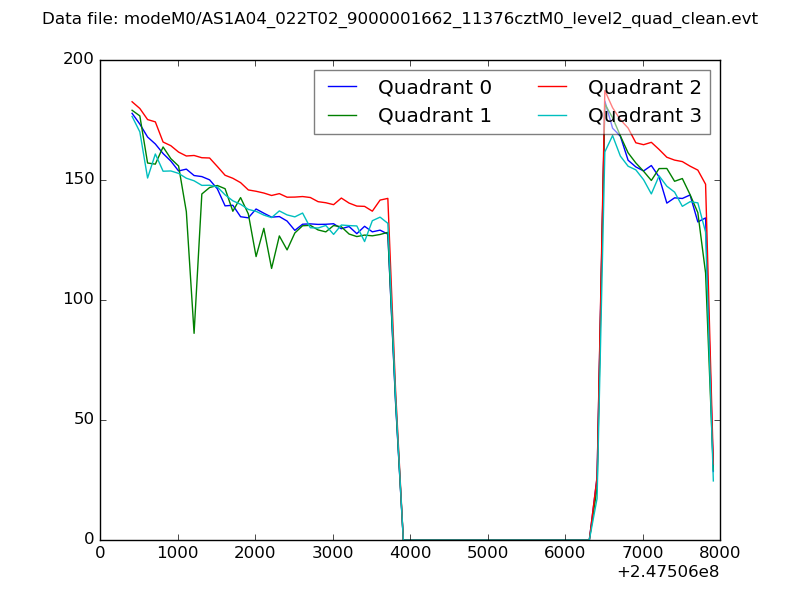 |
|
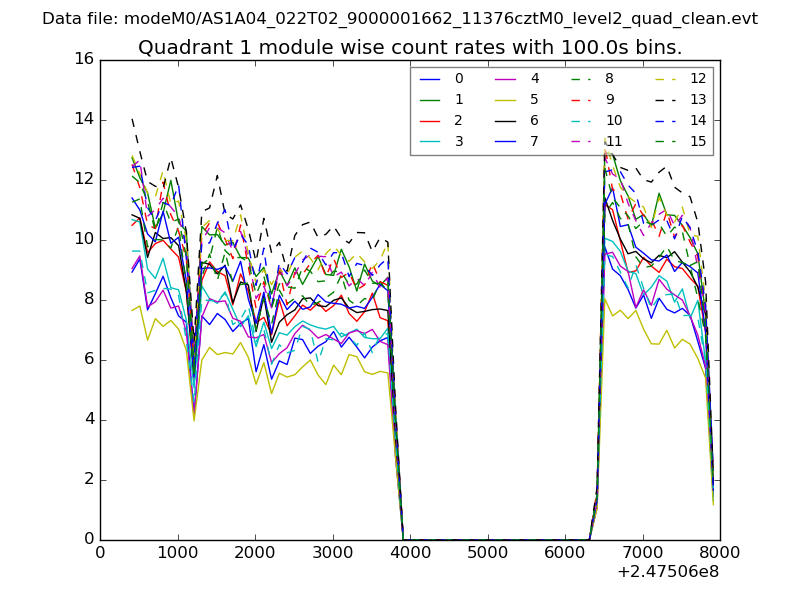
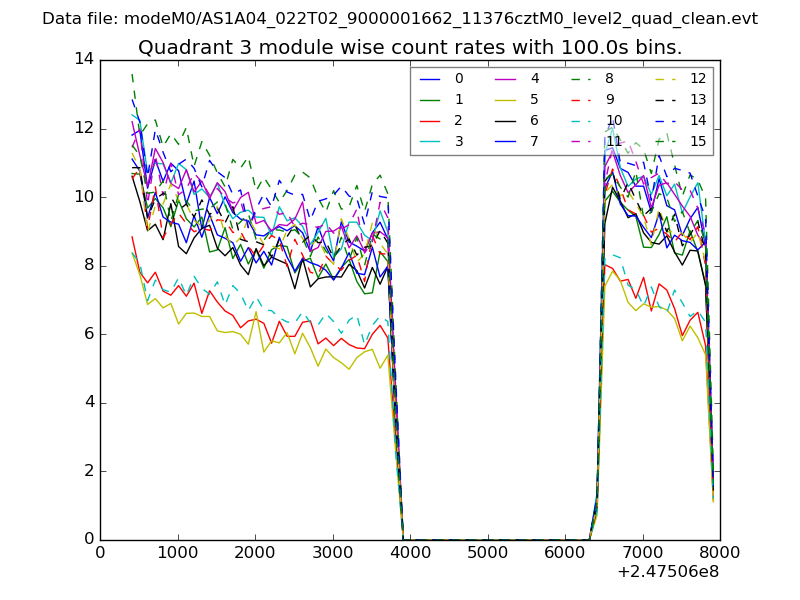
| Module-wise count rates for Quadrant A Data is divided into 100 sec bins |
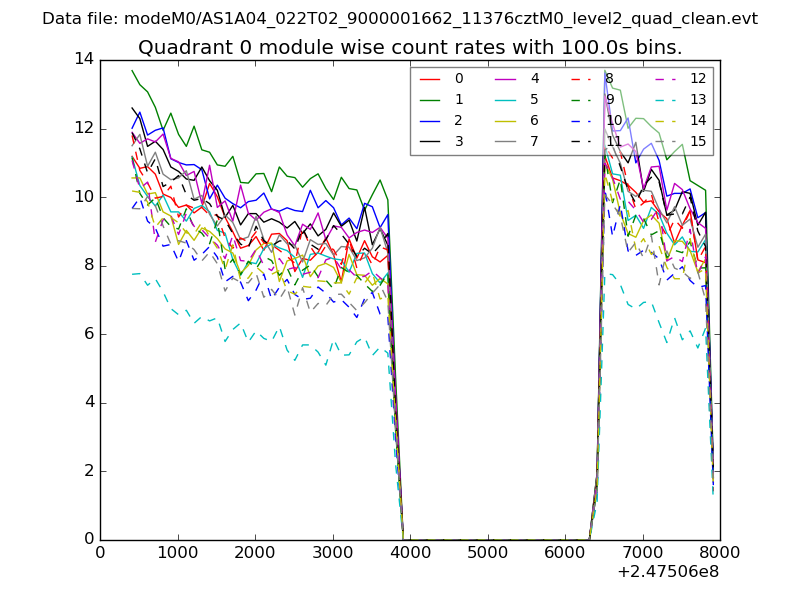 |
 |
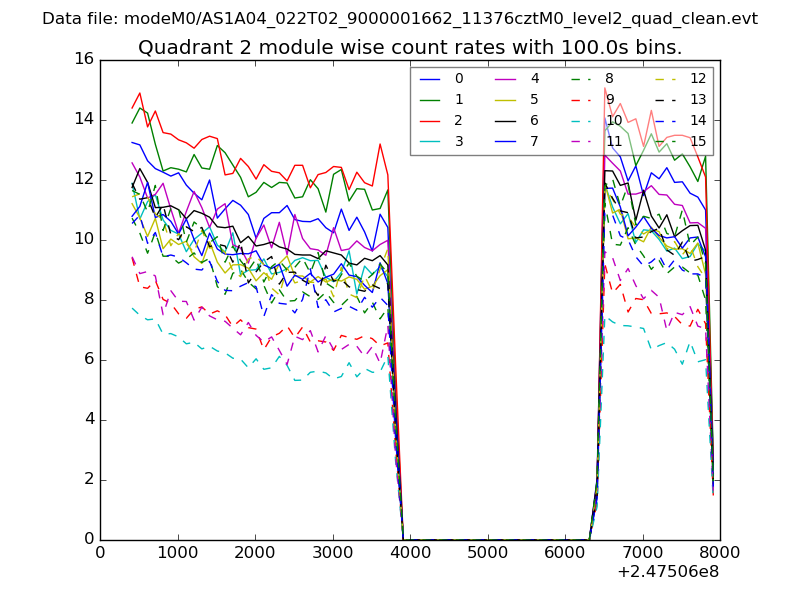
| Module-wise count rates for Quadrant B Data is divided into 100 sec bins |
 |
 |
| Module-wise count rates for Quadrant C Data is divided into 100 sec bins |
 |
 |
| Module-wise count rates for Quadrant D Data is divided into 100 sec bins |
 |
 |
| Parameter | Plot |
|---|---|
| CZT HV Monitor | 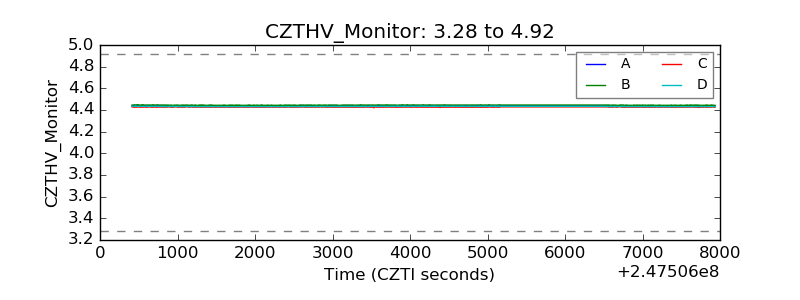 |
| D_VDD | 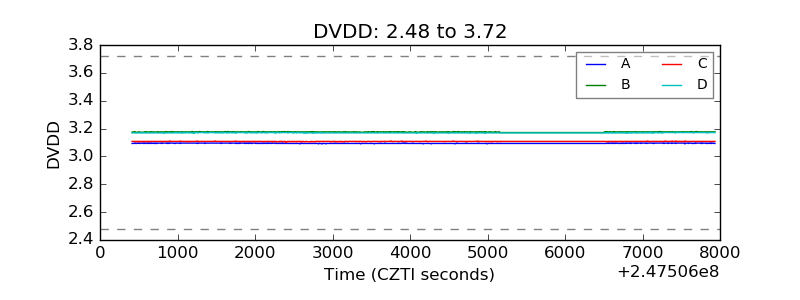 |
| Temperature 1 | 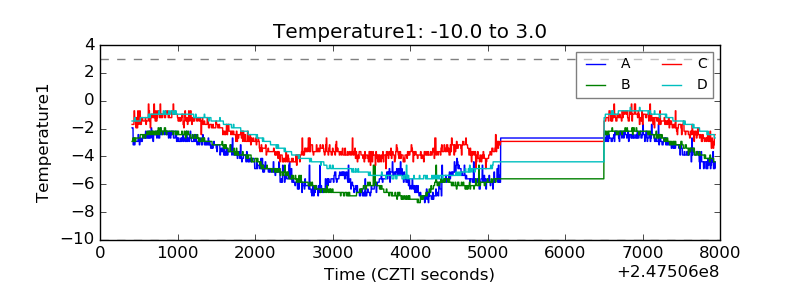 |
| Veto HV Monitor | 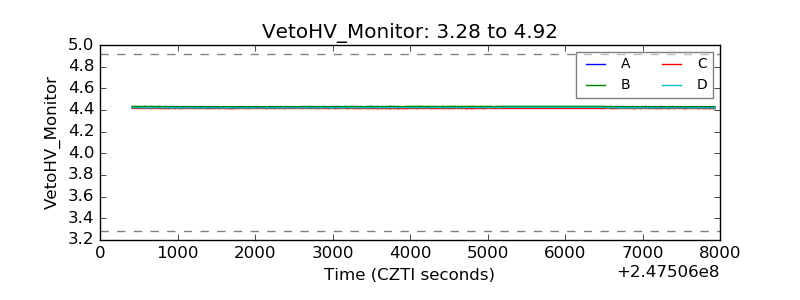 |
| Veto LLD | 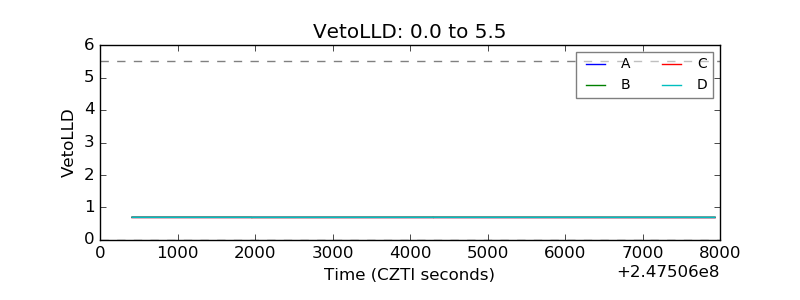 |
| Alpha Counter | 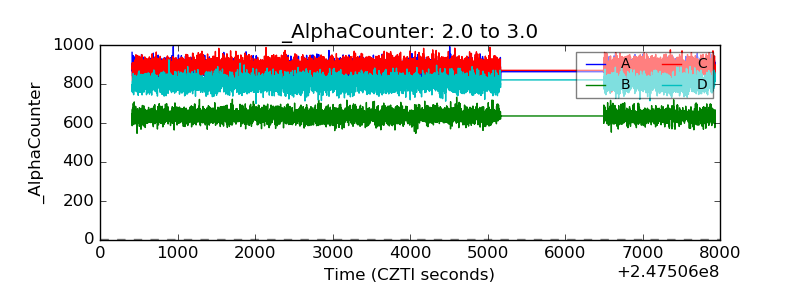 |
| _CPM_Rate | 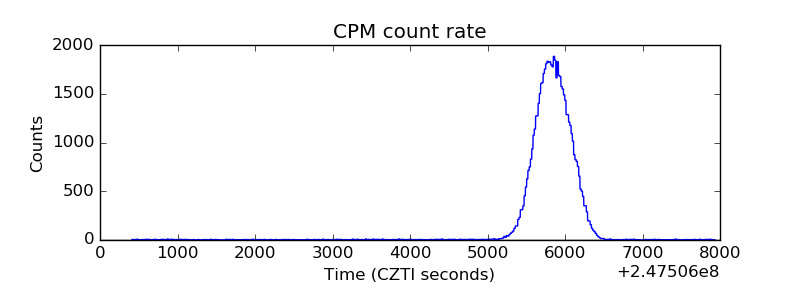 |
| CZT Counter | 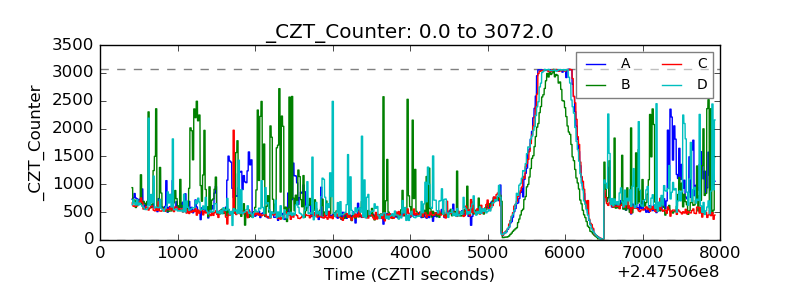 |
| +2.5 Volts monitor | 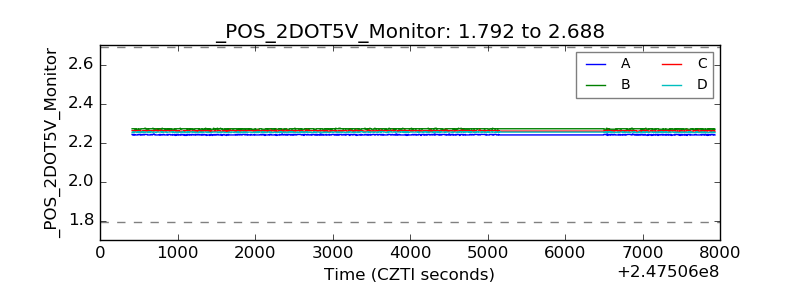 |
| +5 Volts monitor | 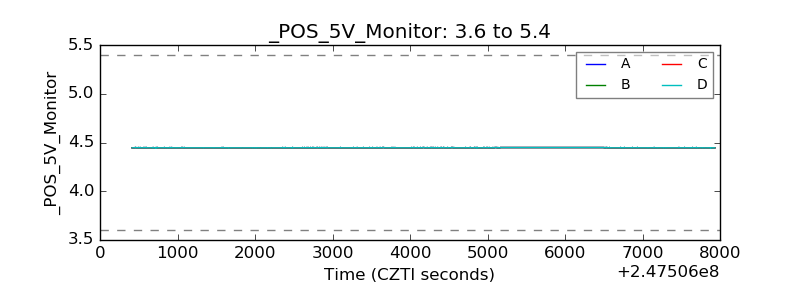 |
| _ROLL_ROT | 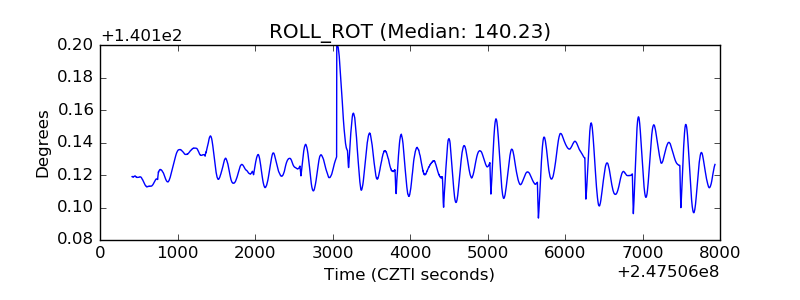 |
| _Roll_DEC | 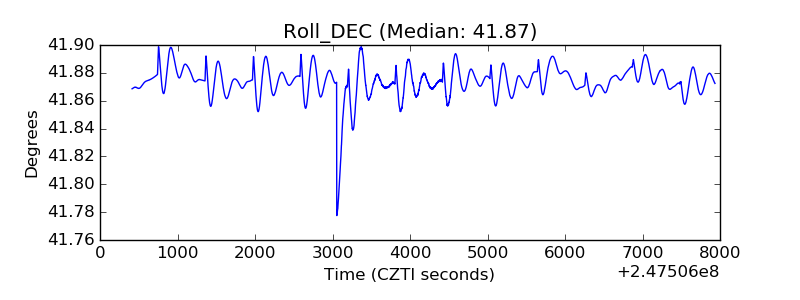 |
| _Roll_RA | 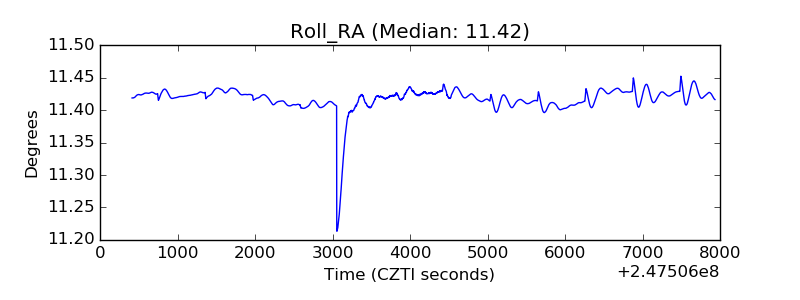 |
| Veto Counter | 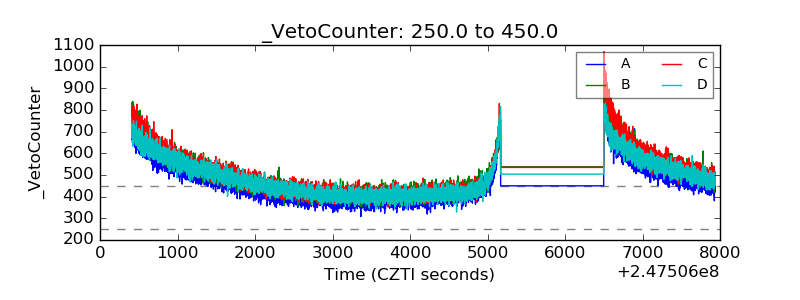 |