| Param | Original file | Final file |
|---|---|---|
| Filename | modeM0/AS1A04_022T02_9000001662_11378cztM0_level2.evt | modeM0/AS1A04_022T02_9000001662_11378cztM0_level2_quad_clean.evt |
| Size (bytes) | 549,780,480 | 90,532,800 |
| Size | 524.3 MB | 86.3 MB |
| Events in quadrant A | 4,624,488 | 558,303 |
| Events in quadrant B | 4,377,624 | 556,114 |
| Events in quadrant C | 3,054,231 | 618,452 |
| Events in quadrant D | 4,159,779 | 561,519 |
| Mode SS | |||
|---|---|---|---|
| Quadrant | BADHDUFLAG | Total packets | Discarded packets |
| A | 0 | 130 | 0 |
| B | 0 | 130 | 0 |
| C | 0 | 130 | 0 |
| D | 0 | 130 | 0 |
| Mode M0 | |||
|---|---|---|---|
| Quadrant | BADHDUFLAG | Total packets | Discarded packets |
| A | 0 | 18085 | 3 |
| B | 0 | 17252 | 2 |
| C | 0 | 13318 | 2 |
| D | 0 | 16694 | 2 |
| Mode M9 | |||
|---|---|---|---|
| Quadrant | BADHDUFLAG | Total packets | Discarded packets |
| A | 0 | 19 | 0 |
| B | 0 | 19 | 0 |
| C | 0 | 19 | 0 |
| D | 0 | 20 | 0 |
| Quadrant | Total seconds | Saturated seconds | Saturation percentage |
|---|---|---|---|
| A | 6405 | 233 | 3.637783% |
| B | 6405 | 435 | 6.791569% |
| C | 6405 | 50 | 0.780640% |
| D | 6405 | 294 | 4.590164% |
Noise dominated data is calculated using 1-second bins in cleaned event files. If a bin has >2000 counts, and if more than 50% of those come from <1% of pixels, then it is considered to be noise-dominated and hence unusable.
| Quadrant | # 1 sec bins | Bins with >0 counts | Bins with >2000 counts | High rate bins dominated by noise | Noise dominated (total time) | Noise dominated (detector-on time) | Marked lightcurve |
|---|---|---|---|---|---|---|---|
| A | 7536 | 6407 | 119 | 119 | 1.58% | 1.86% | 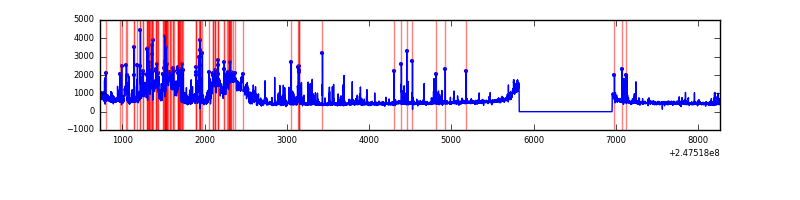 |
| B | 7536 | 6407 | 224 | 224 | 2.97% | 3.50% | 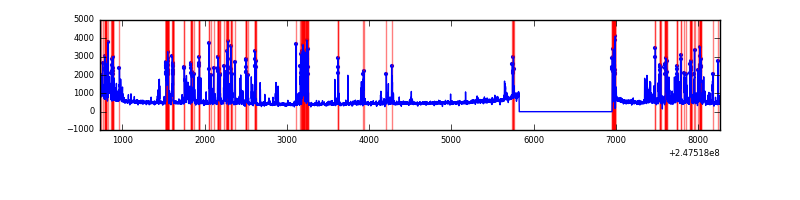 |
| C | 7536 | 6407 | 0 | 0 | 0.00% | 0.00% | 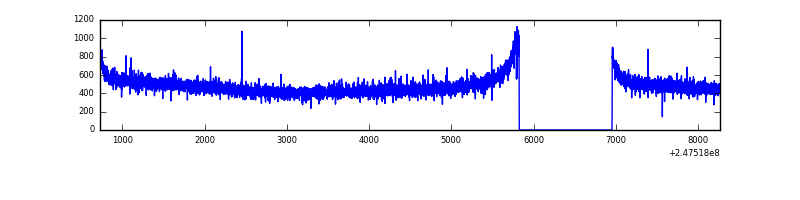 |
| D | 7536 | 6407 | 207 | 207 | 2.75% | 3.23% | 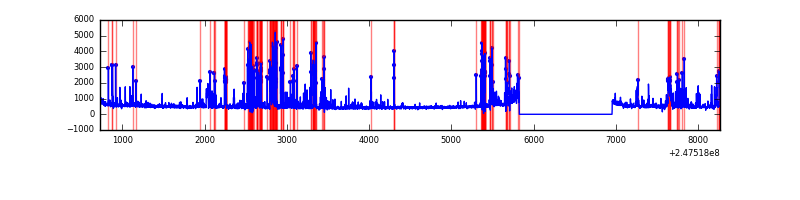 |
Top three noisy pixels from each quadrant. If the there are fewer than three noisy pixels in the level2.evt file, extra rows are filled as -1
| Pixel properties | Quadrant properties | ||||||
|---|---|---|---|---|---|---|---|
| Quadrant | DetID | PixID | Counts | Sigma | Mean | Median | Sigma |
| A | 15 | 174 | 1015276 | 6506.32 | 769 | 752 | 155.9 |
| A | 8 | 5 | 614247 | 3934.45 | 769 | 752 | 155.9 |
| A | 1 | 162 | 8754 | 51.32 | 769 | 752 | 155.9 |
| B | 4 | 239 | 1179409 | 8235.69 | 761 | 743 | 143.1 |
| B | 3 | 64 | 126256 | 877.0 | 761 | 743 | 143.1 |
| B | 0 | 229 | 21740 | 146.71 | 761 | 743 | 143.1 |
| C | 13 | 61 | 5622 | 26.38 | 782 | 789 | 183.2 |
| C | 14 | 234 | 3227 | 13.31 | 782 | 789 | 183.2 |
| C | 3 | 202 | 1972 | 6.46 | 782 | 789 | 183.2 |
| D | 10 | 253 | 576440 | 2915.85 | 746 | 734 | 197.4 |
| D | 1 | 52 | 191143 | 964.39 | 746 | 734 | 197.4 |
| D | 14 | 34 | 163857 | 826.19 | 746 | 734 | 197.4 |
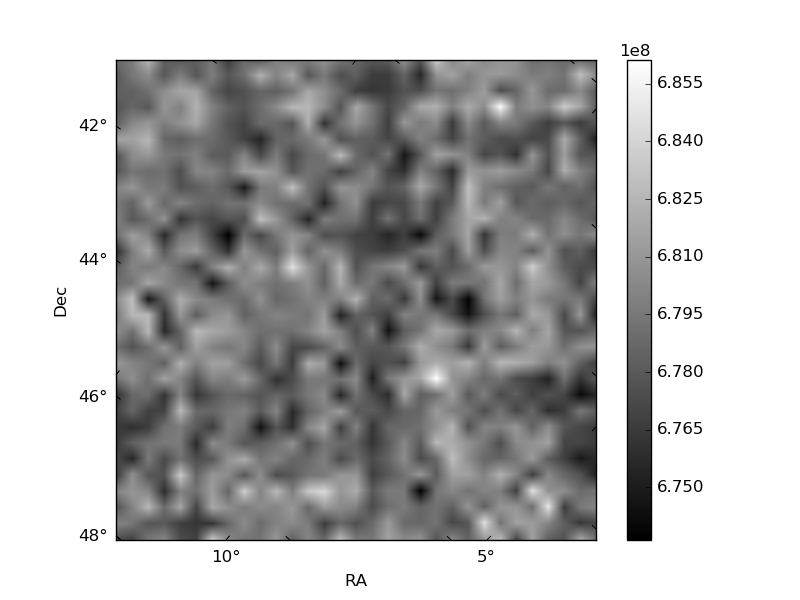
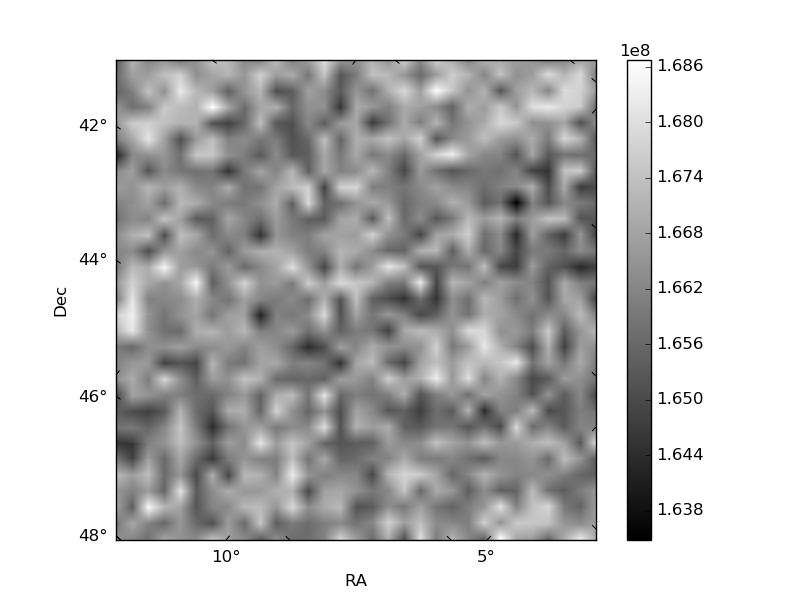
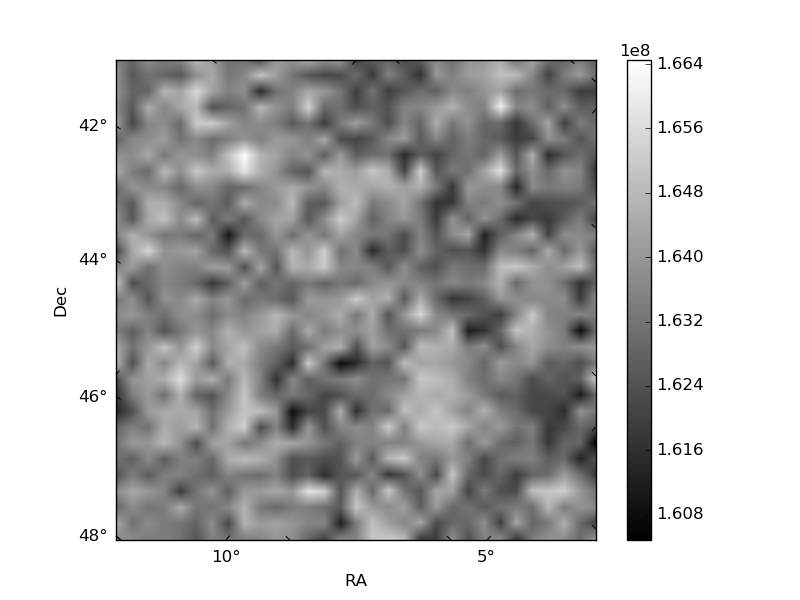
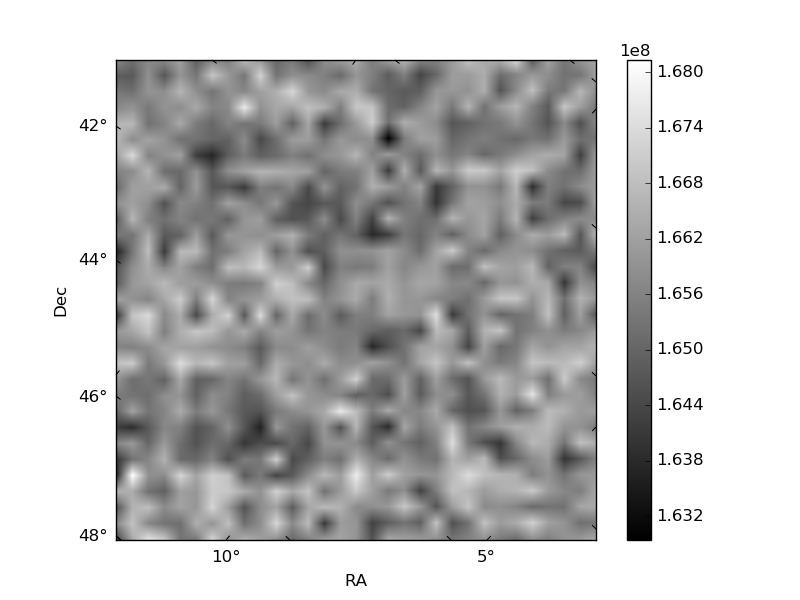
Histogram calculated using DETX and DETY for each event in the final _common_clean file
| Quadrant A | 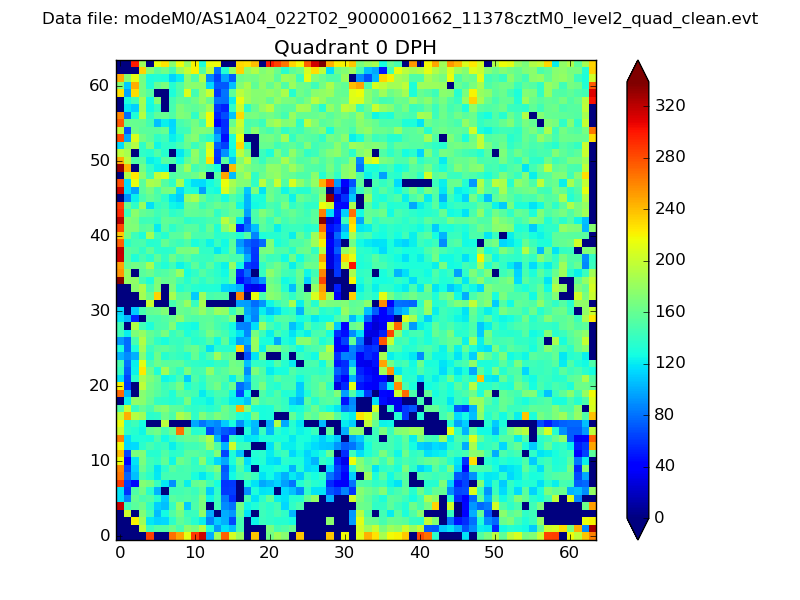 |
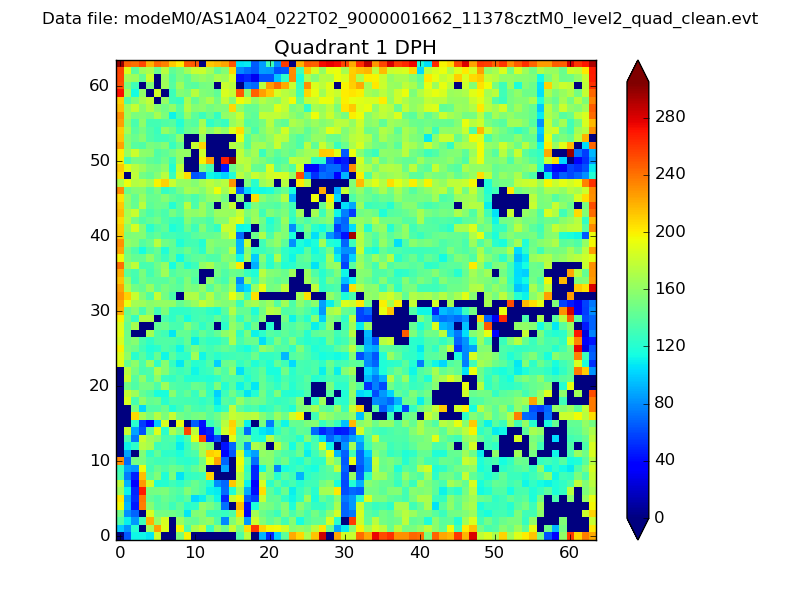 |
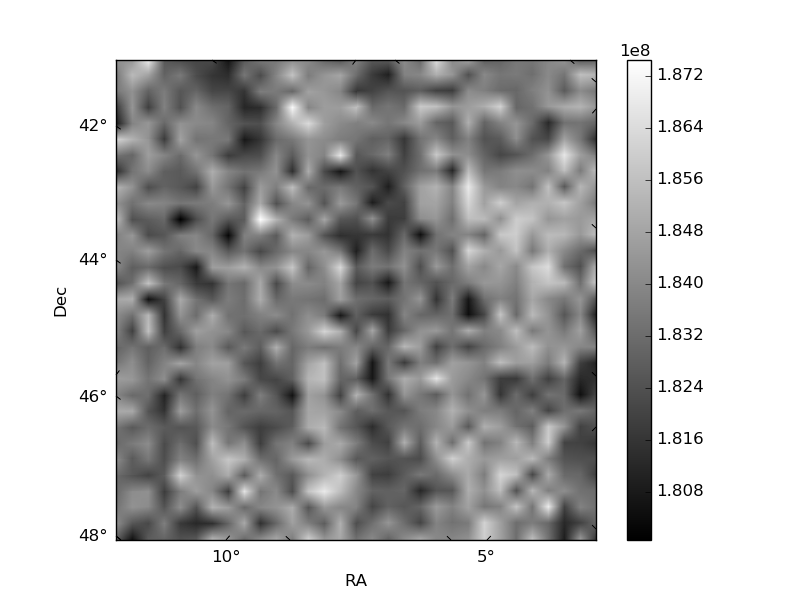
Quadrant B |
|---|---|---|---|
| Quadrant D | 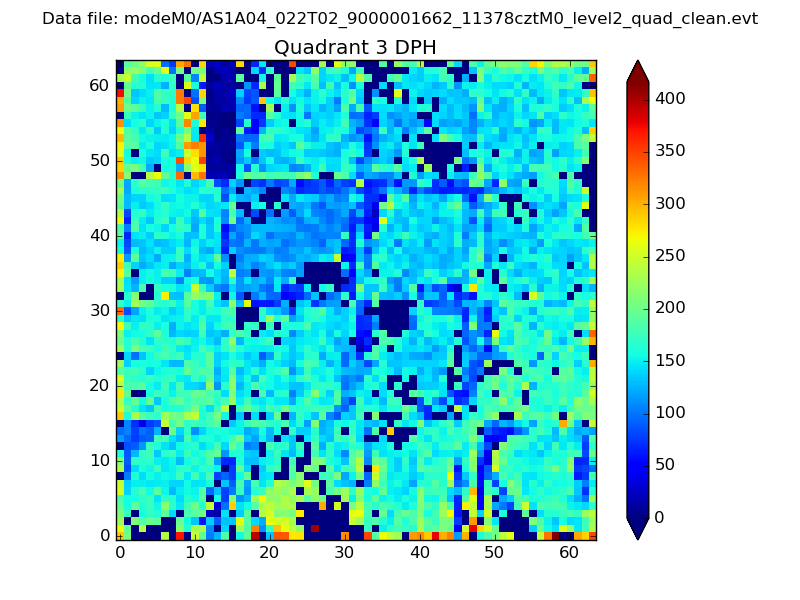 |
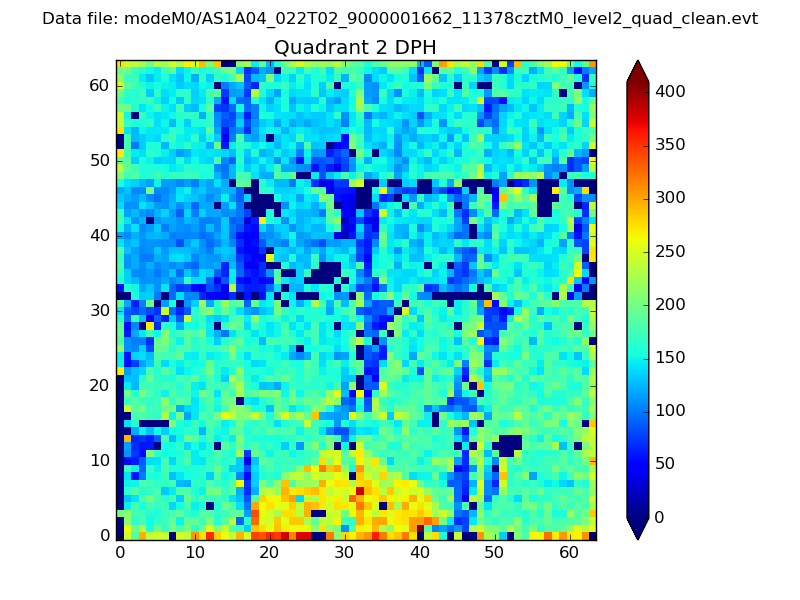 |
Quadrant C |
| Plot type | Count rate plots | Images |
|---|---|---|
| Comparison with Poisson distribution Blue bars denote a histogram of data divided into 1 sec bins. Red curve is a Poisson curve with rate = median count rate of data. |
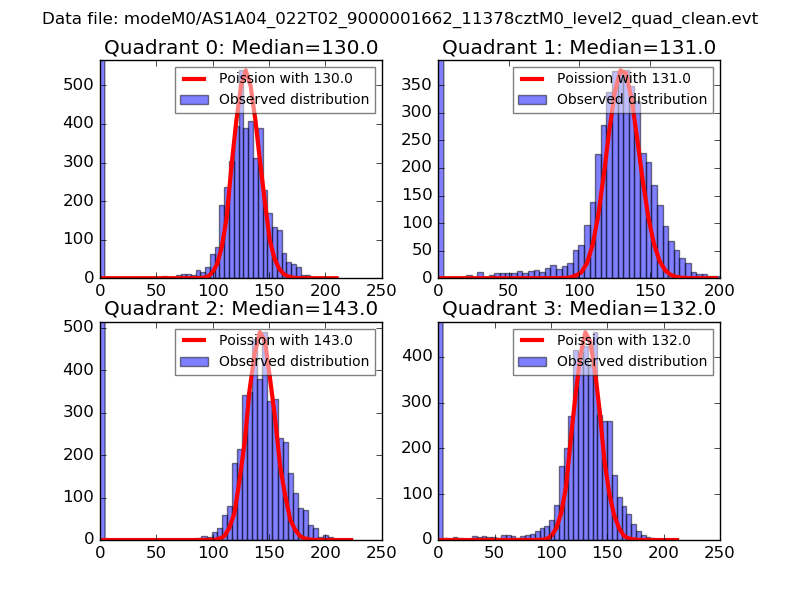 |
 |
| Quadrant-wise count rates Data is divided into 100 sec bins |
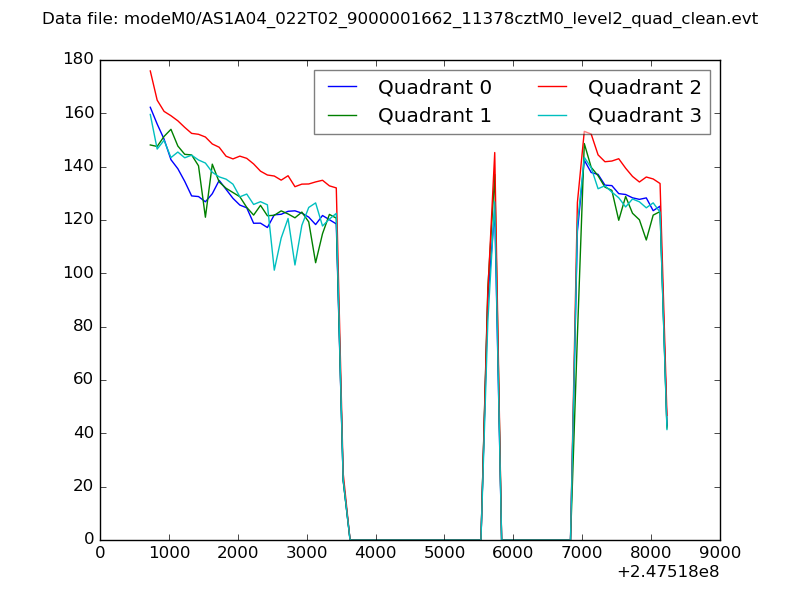 |
|
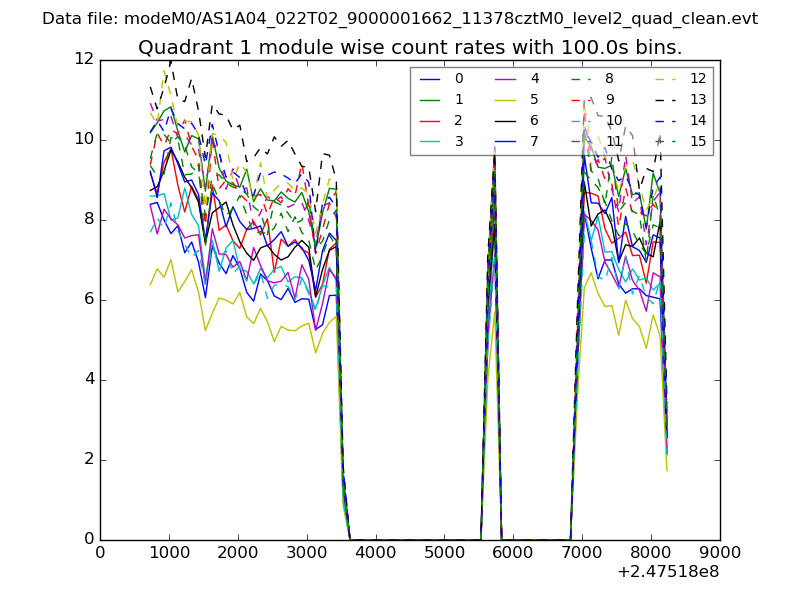
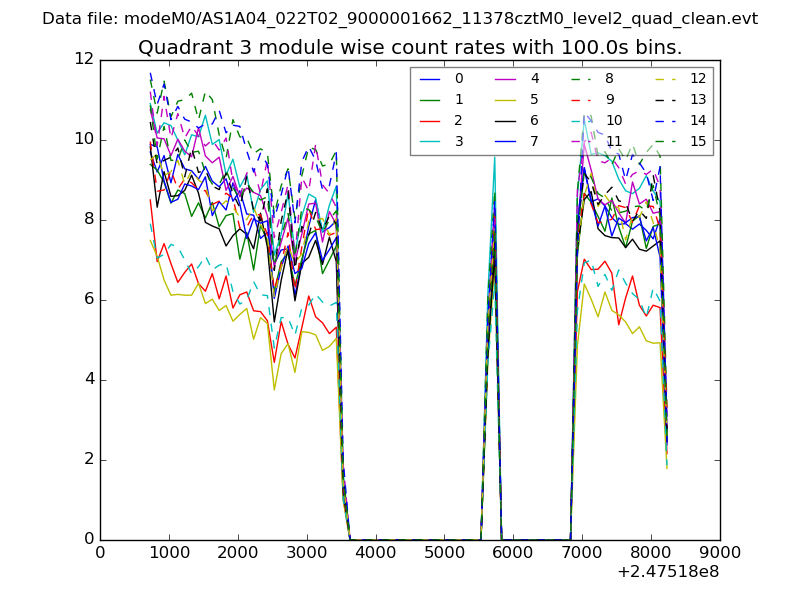
| Module-wise count rates for Quadrant A Data is divided into 100 sec bins |
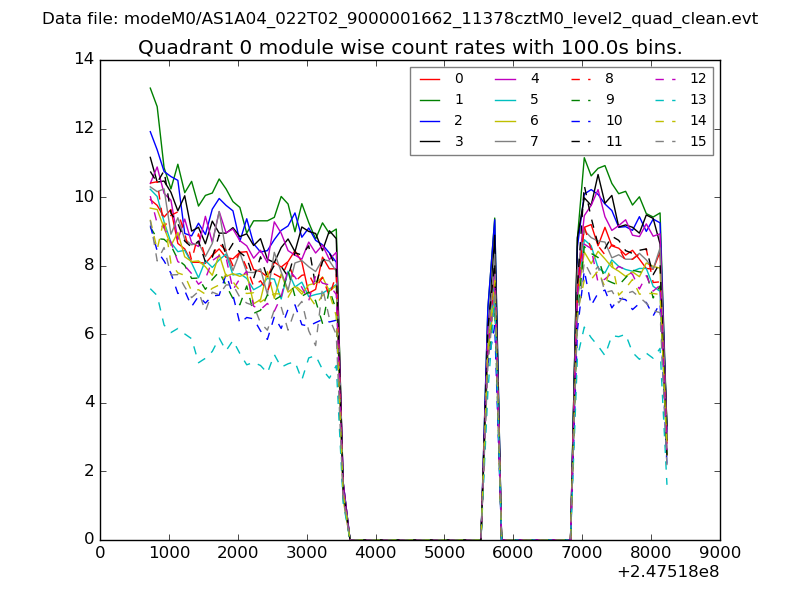 |
 |
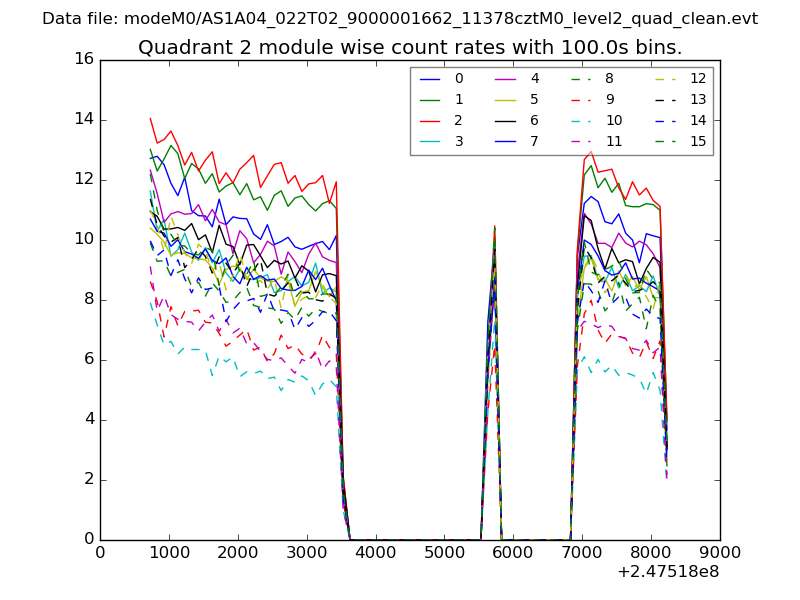
| Module-wise count rates for Quadrant B Data is divided into 100 sec bins |
 |
 |
| Module-wise count rates for Quadrant C Data is divided into 100 sec bins |
 |
 |
| Module-wise count rates for Quadrant D Data is divided into 100 sec bins |
 |
 |
| Parameter | Plot |
|---|---|
| CZT HV Monitor | 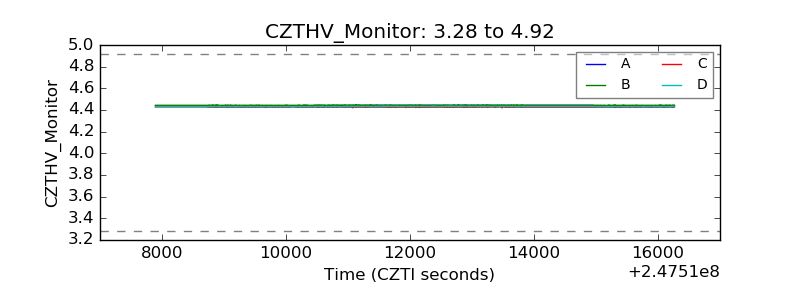 |
| D_VDD | 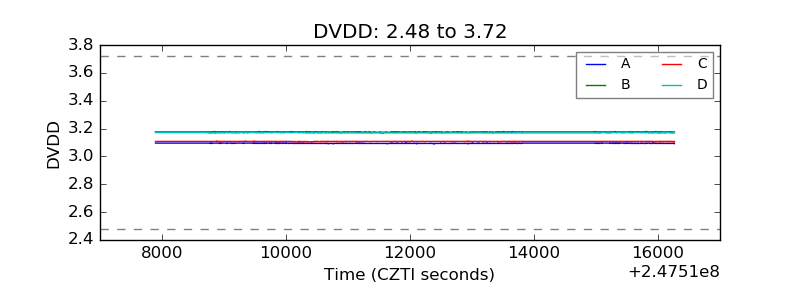 |
| Temperature 1 | 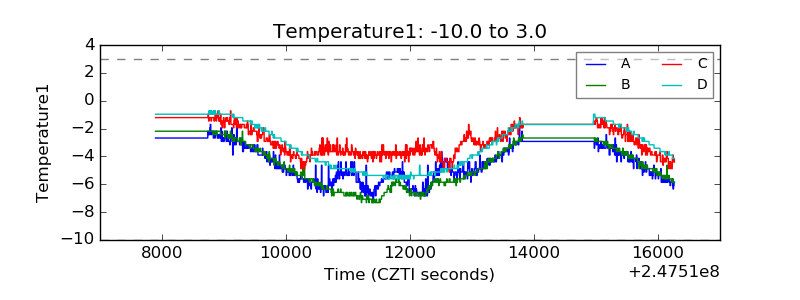 |
| Veto HV Monitor | 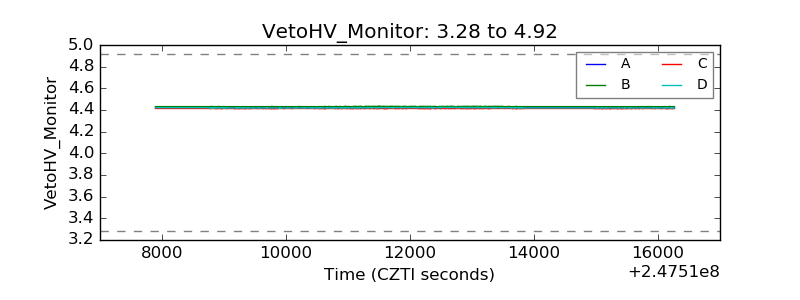 |
| Veto LLD | 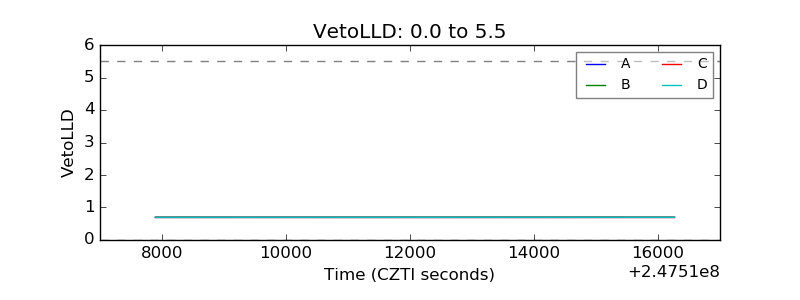 |
| Alpha Counter | 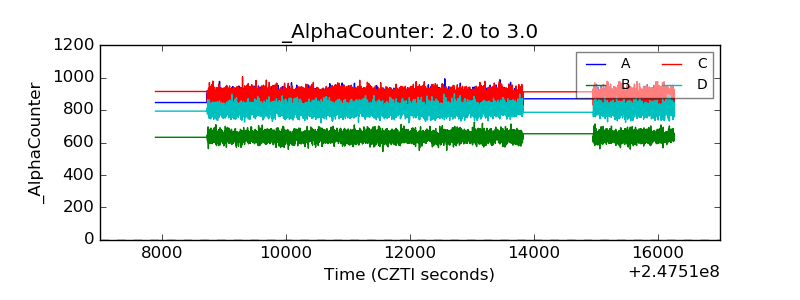 |
| _CPM_Rate | 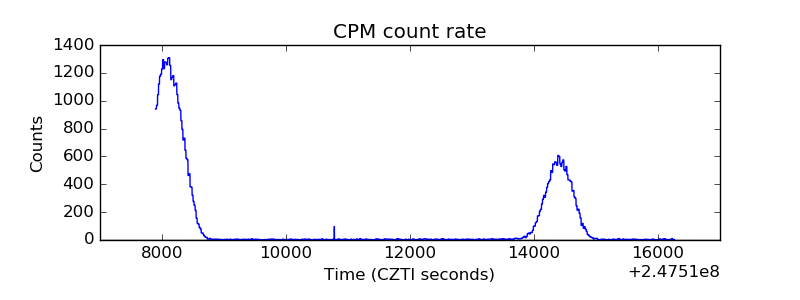 |
| CZT Counter | 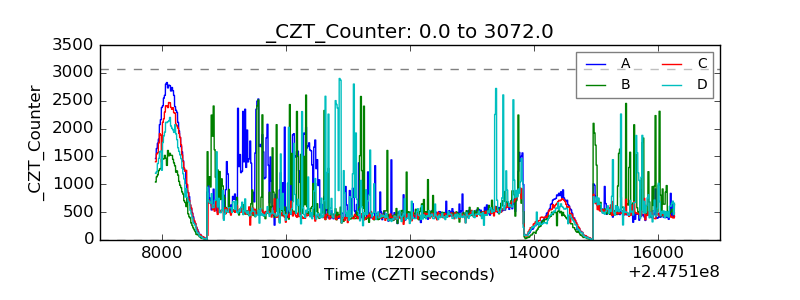 |
| +2.5 Volts monitor |  |
| +5 Volts monitor | 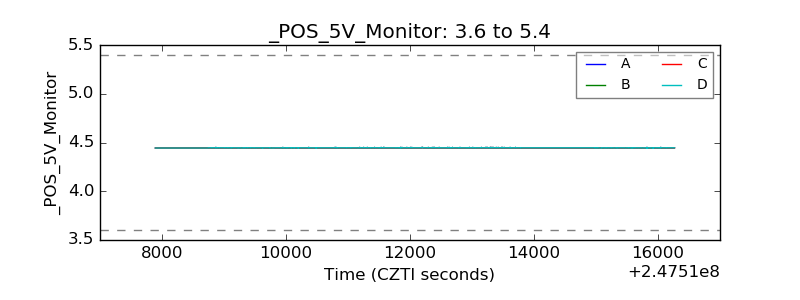 |
| _ROLL_ROT | 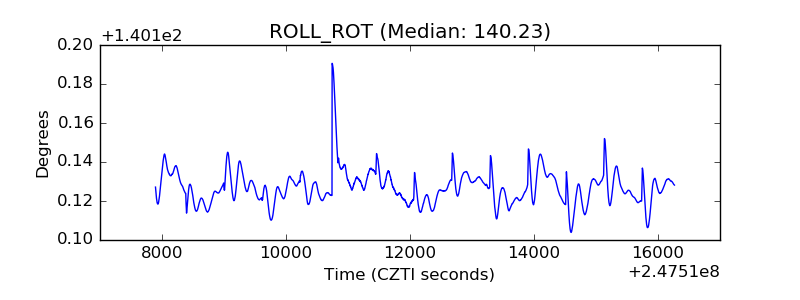 |
| _Roll_DEC | 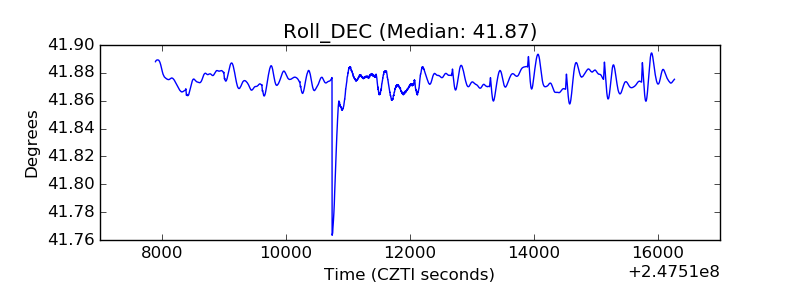 |
| _Roll_RA | 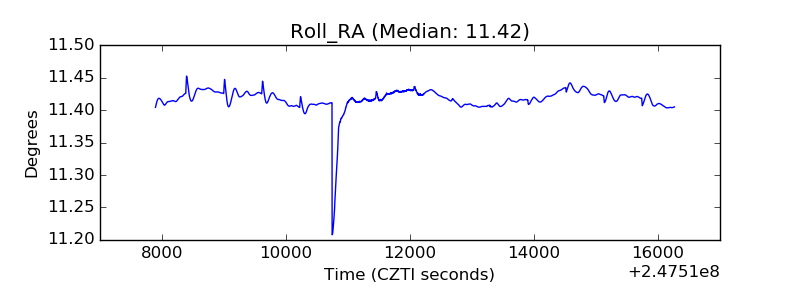 |
| Veto Counter | 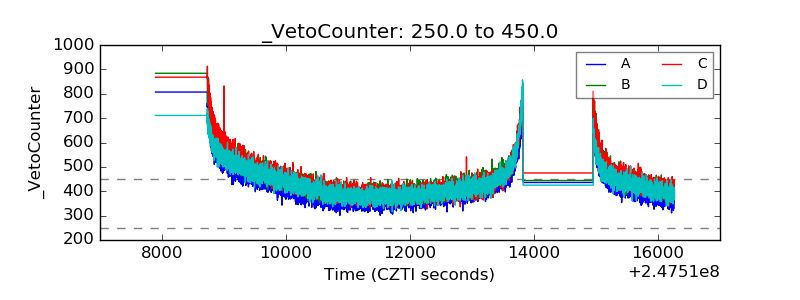 |