| Param | Original file | Final file |
|---|---|---|
| Filename | modeM0/AS1A04_022T02_9000001662_11379cztM0_level2.evt | modeM0/AS1A04_022T02_9000001662_11379cztM0_level2_quad_clean.evt |
| Size (bytes) | 568,823,040 | 94,193,280 |
| Size | 542.5 MB | 89.8 MB |
| Events in quadrant A | 3,315,549 | 599,523 |
| Events in quadrant B | 4,915,342 | 567,204 |
| Events in quadrant C | 3,126,012 | 645,115 |
| Events in quadrant D | 5,405,028 | 562,516 |
| Mode SS | |||
|---|---|---|---|
| Quadrant | BADHDUFLAG | Total packets | Discarded packets |
| A | 0 | 140 | 0 |
| B | 0 | 140 | 0 |
| C | 0 | 140 | 0 |
| D | 0 | 140 | 0 |
| Mode M0 | |||
|---|---|---|---|
| Quadrant | BADHDUFLAG | Total packets | Discarded packets |
| A | 0 | 14596 | 3 |
| B | 0 | 19248 | 2 |
| C | 0 | 14063 | 2 |
| D | 0 | 20802 | 2 |
| Mode M9 | |||
|---|---|---|---|
| Quadrant | BADHDUFLAG | Total packets | Discarded packets |
| A | 0 | 11 | 0 |
| B | 0 | 11 | 0 |
| C | 0 | 11 | 0 |
| D | 0 | 12 | 0 |
| Quadrant | Total seconds | Saturated seconds | Saturation percentage |
|---|---|---|---|
| A | 6853 | 32 | 0.466949% |
| B | 6853 | 578 | 8.434262% |
| C | 6853 | 12 | 0.175106% |
| D | 6853 | 534 | 7.792208% |
Noise dominated data is calculated using 1-second bins in cleaned event files. If a bin has >2000 counts, and if more than 50% of those come from <1% of pixels, then it is considered to be noise-dominated and hence unusable.
| Quadrant | # 1 sec bins | Bins with >0 counts | Bins with >2000 counts | High rate bins dominated by noise | Noise dominated (total time) | Noise dominated (detector-on time) | Marked lightcurve |
|---|---|---|---|---|---|---|---|
| A | 7709 | 6855 | 11 | 11 | 0.14% | 0.16% | 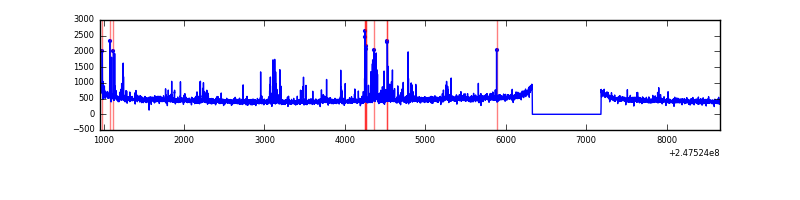 |
| B | 7709 | 6855 | 323 | 323 | 4.19% | 4.71% |  |
| C | 7709 | 6855 | 0 | 0 | 0.00% | 0.00% | 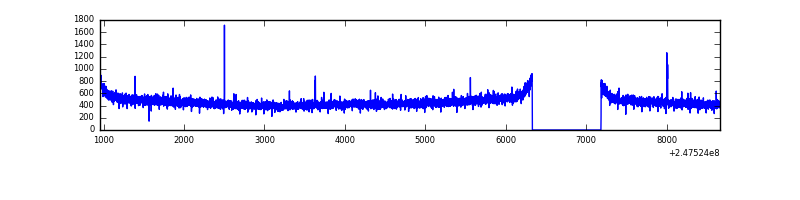 |
| D | 7709 | 6854 | 425 | 425 | 5.51% | 6.20% | 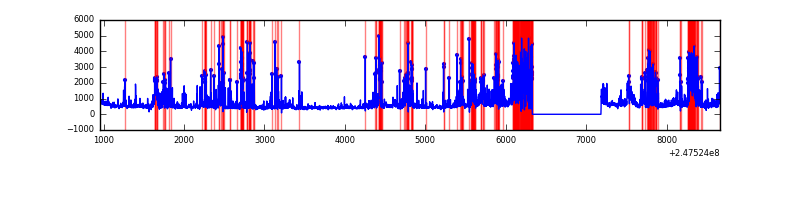 |
Top three noisy pixels from each quadrant. If the there are fewer than three noisy pixels in the level2.evt file, extra rows are filled as -1
| Pixel properties | Quadrant properties | ||||||
|---|---|---|---|---|---|---|---|
| Quadrant | DetID | PixID | Counts | Sigma | Mean | Median | Sigma |
| A | 8 | 5 | 209058 | 1283.11 | 798 | 779 | 162.3 |
| A | 15 | 174 | 16580 | 97.34 | 798 | 779 | 162.3 |
| A | 11 | 29 | 9244 | 52.15 | 798 | 779 | 162.3 |
| B | 4 | 239 | 1495359 | 10200.11 | 769 | 750 | 146.5 |
| B | 10 | 244 | 179466 | 1219.67 | 769 | 750 | 146.5 |
| B | 3 | 64 | 79051 | 534.37 | 769 | 750 | 146.5 |
| C | 12 | 4 | 8777 | 42.78 | 798 | 801 | 186.4 |
| C | 13 | 61 | 5769 | 26.65 | 798 | 801 | 186.4 |
| C | 10 | 5 | 4093 | 17.66 | 798 | 801 | 186.4 |
| D | 14 | 34 | 1451646 | 8137.15 | 749 | 730 | 178.3 |
| D | 10 | 253 | 283043 | 1583.29 | 749 | 730 | 178.3 |
| D | 1 | 52 | 282637 | 1581.01 | 749 | 730 | 178.3 |
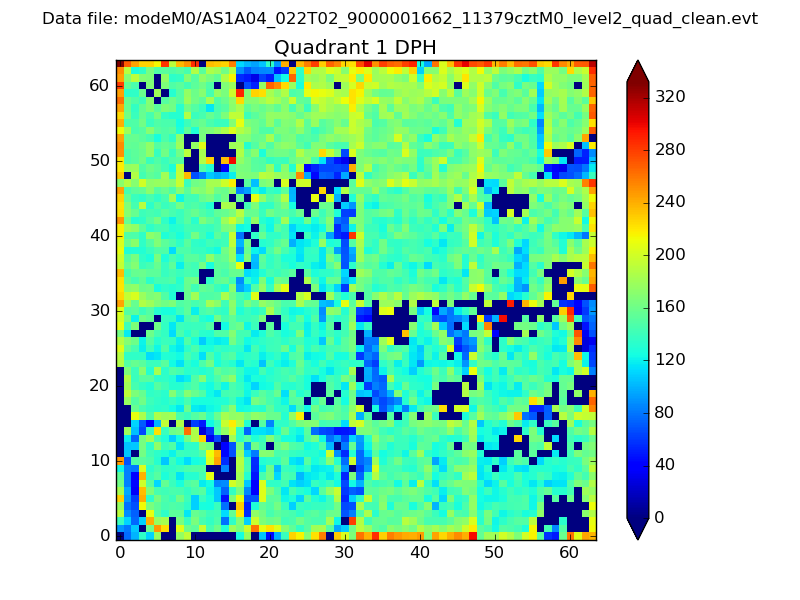
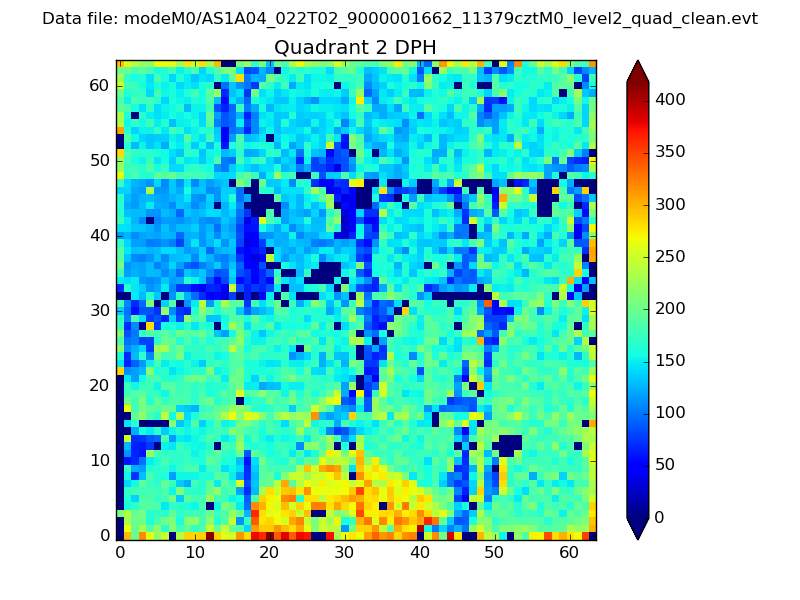
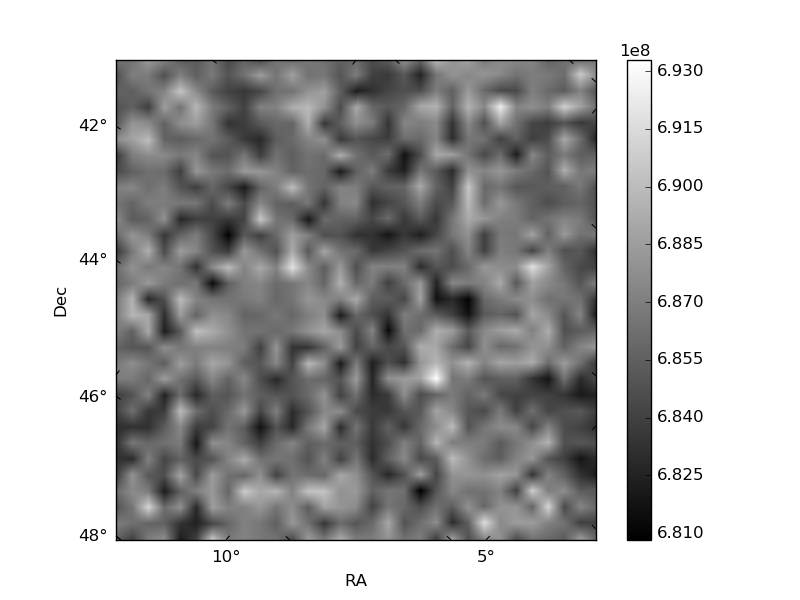
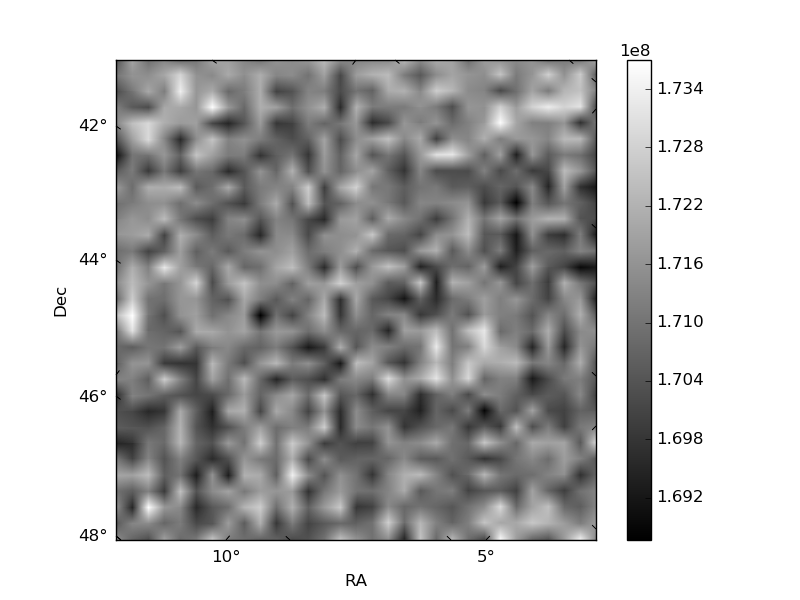
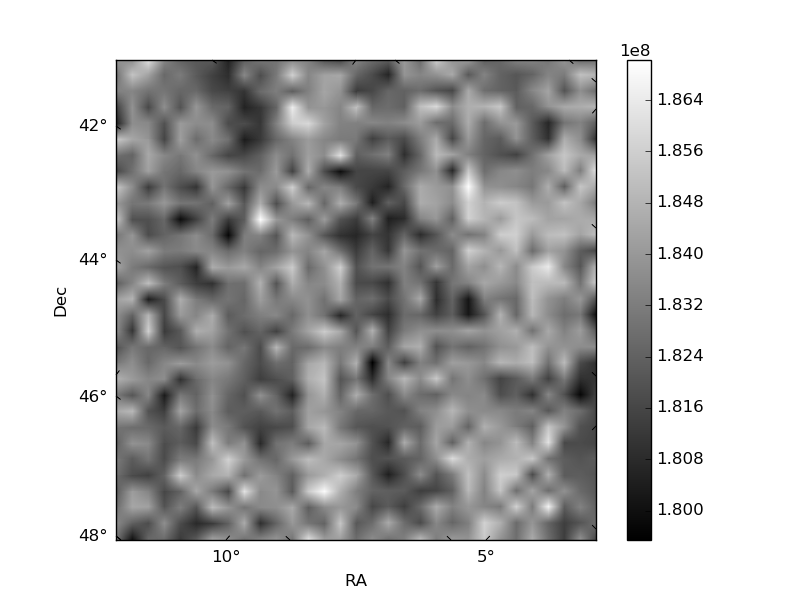
Histogram calculated using DETX and DETY for each event in the final _common_clean file
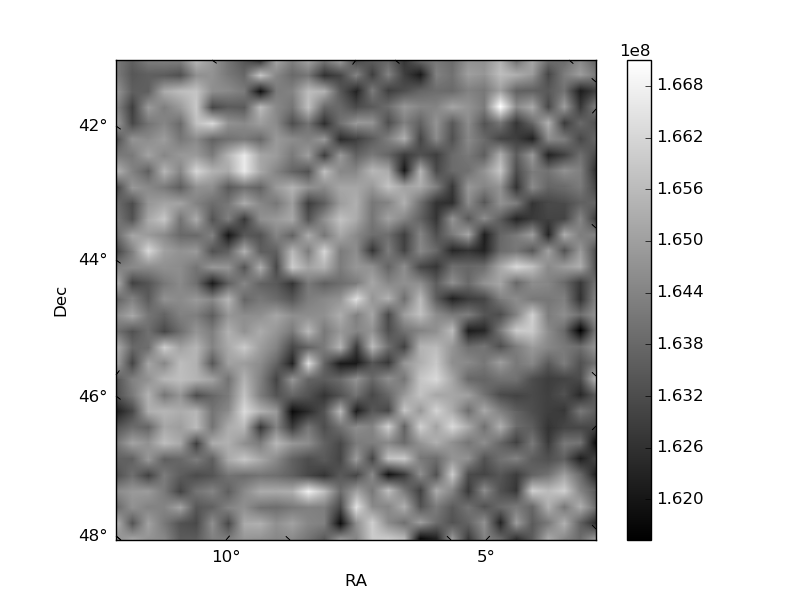
| Quadrant A | 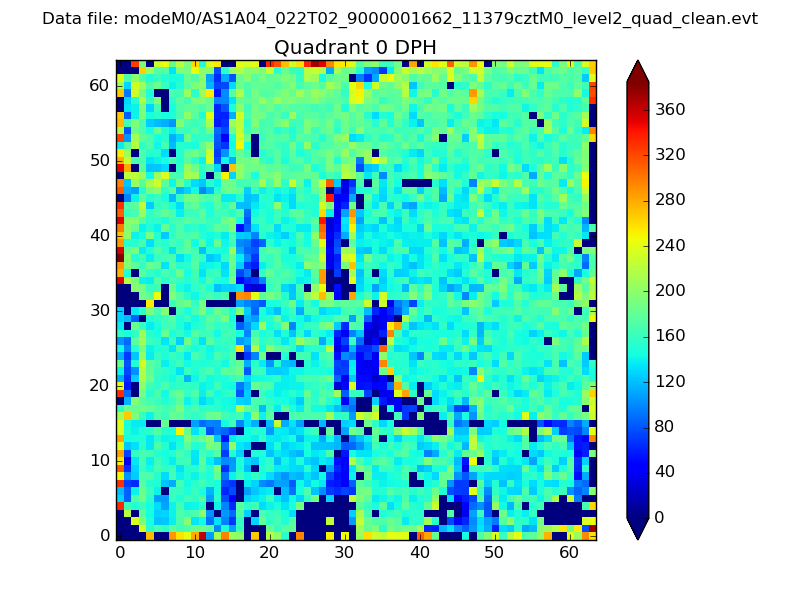 |
 |
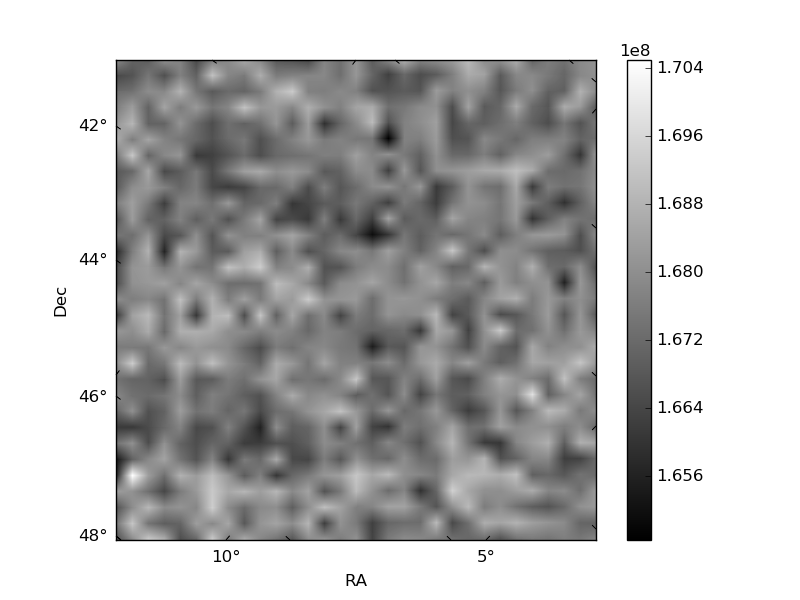
Quadrant B |
|---|---|---|---|
| Quadrant D | 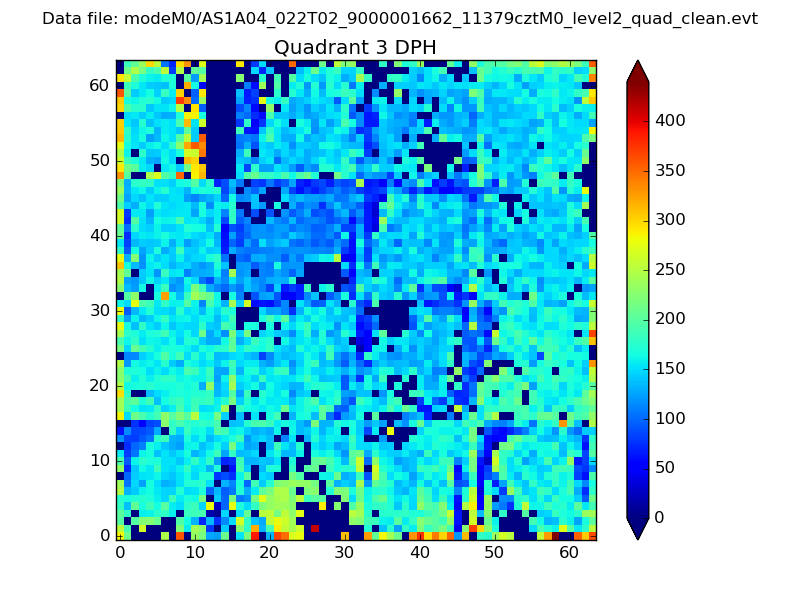 |
 |
Quadrant C |
| Plot type | Count rate plots | Images |
|---|---|---|
| Comparison with Poisson distribution Blue bars denote a histogram of data divided into 1 sec bins. Red curve is a Poisson curve with rate = median count rate of data. |
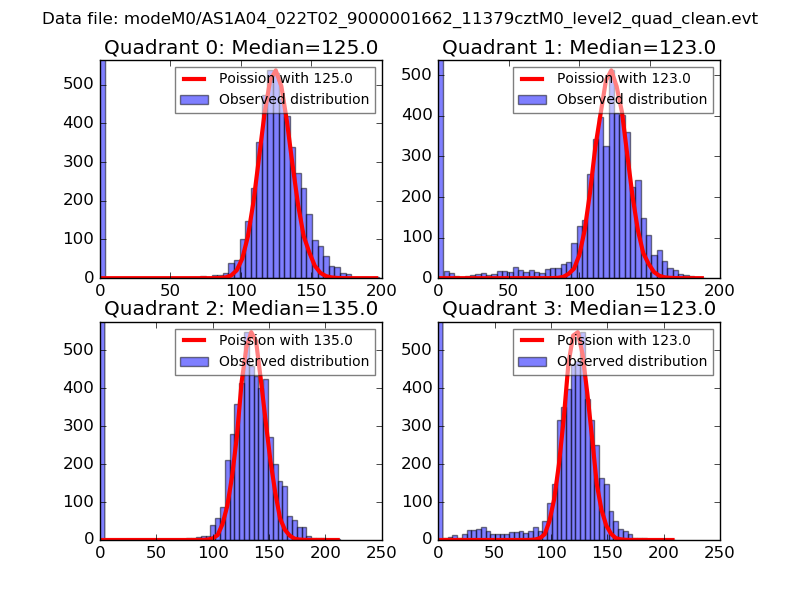 |
 |
| Quadrant-wise count rates Data is divided into 100 sec bins |
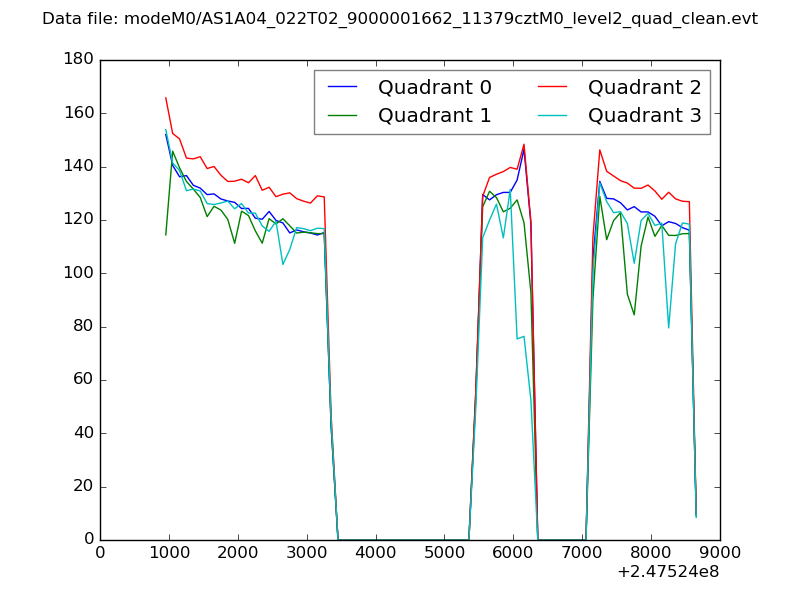 |
|
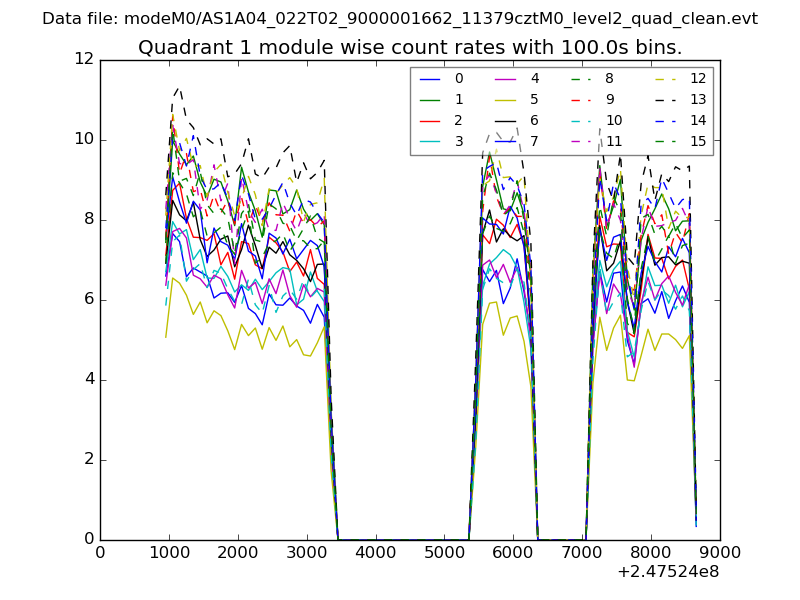
| Module-wise count rates for Quadrant A Data is divided into 100 sec bins |
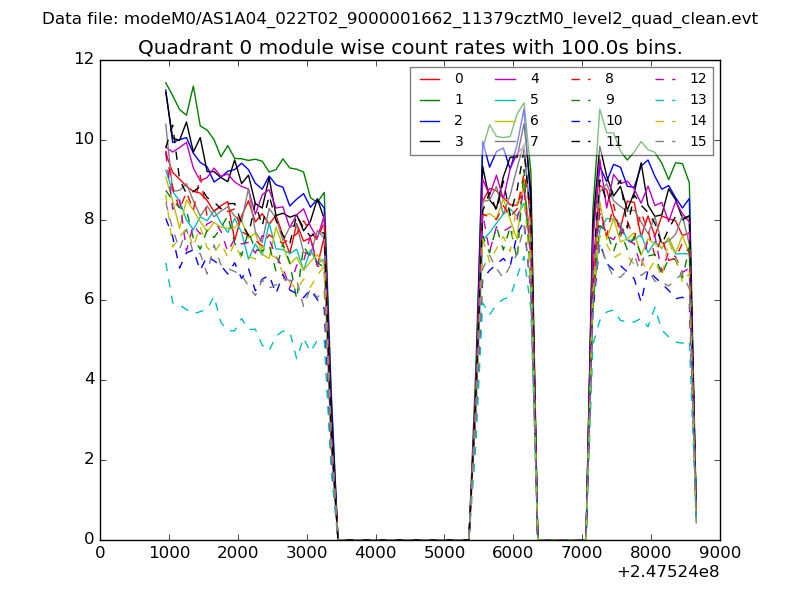 |
 |
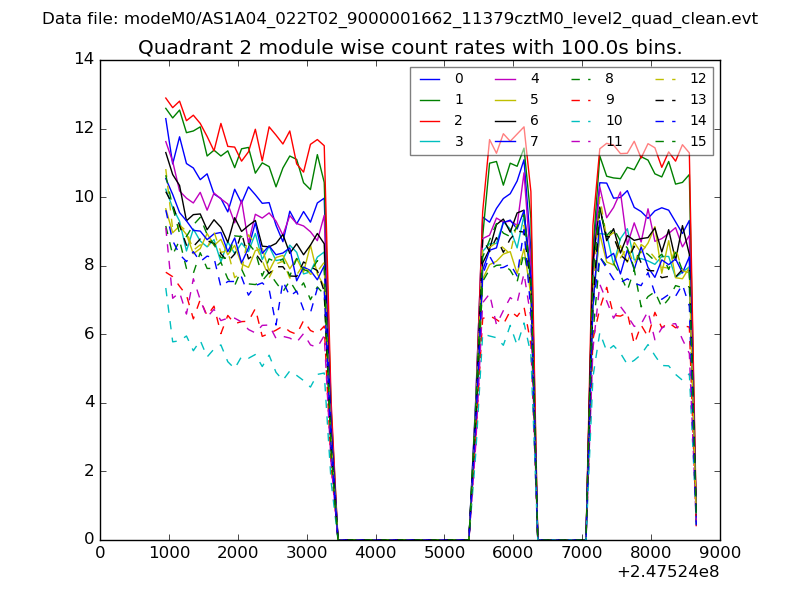
| Module-wise count rates for Quadrant B Data is divided into 100 sec bins |
 |
 |
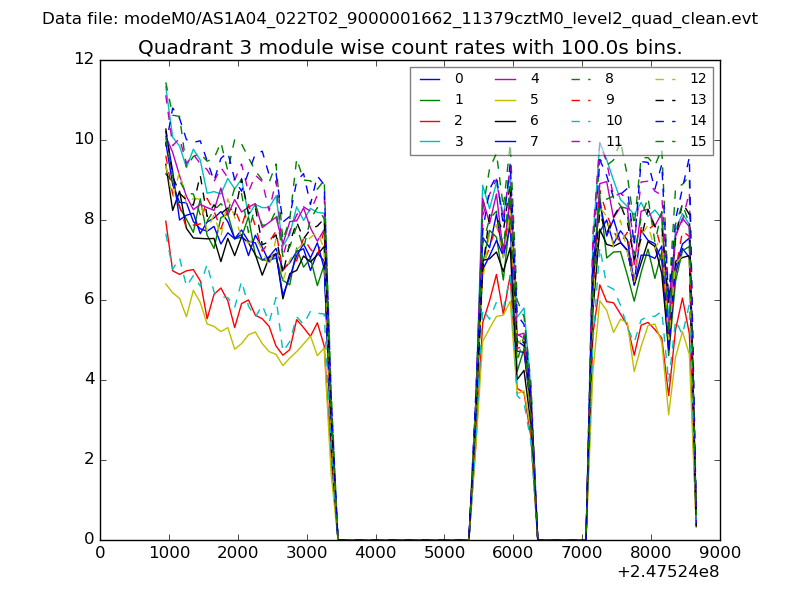
| Module-wise count rates for Quadrant C Data is divided into 100 sec bins |
 |
 |
| Module-wise count rates for Quadrant D Data is divided into 100 sec bins |
 |
 |
| Parameter | Plot |
|---|---|
| CZT HV Monitor | 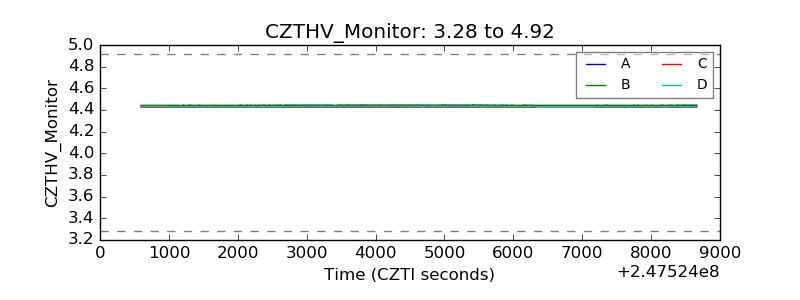 |
| D_VDD | 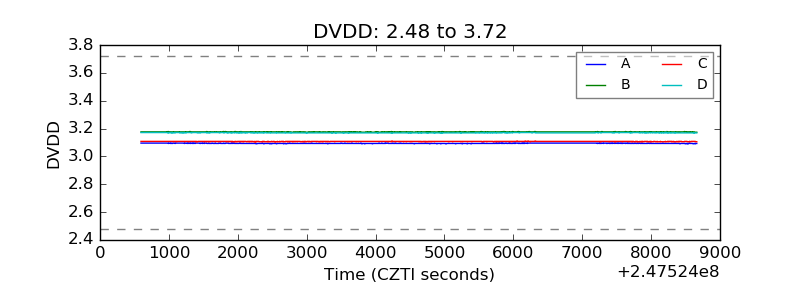 |
| Temperature 1 | 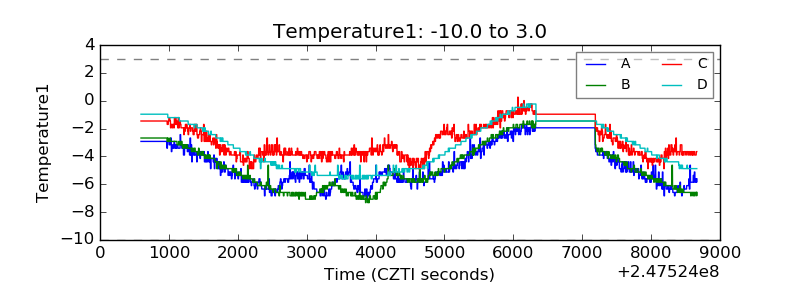 |
| Veto HV Monitor | 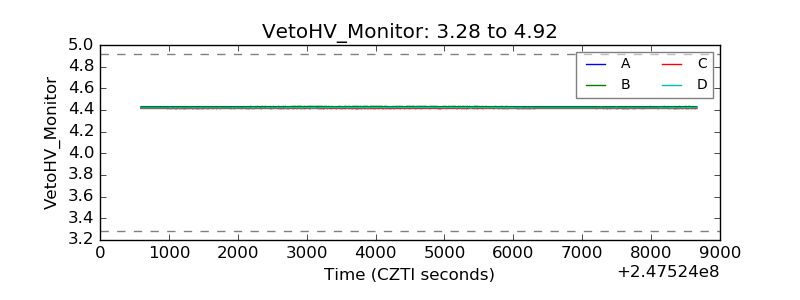 |
| Veto LLD | 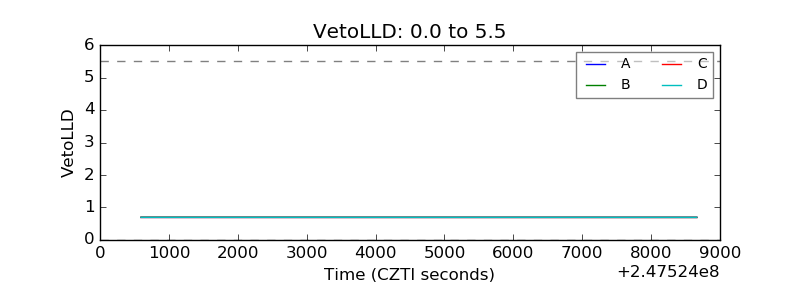 |
| Alpha Counter | 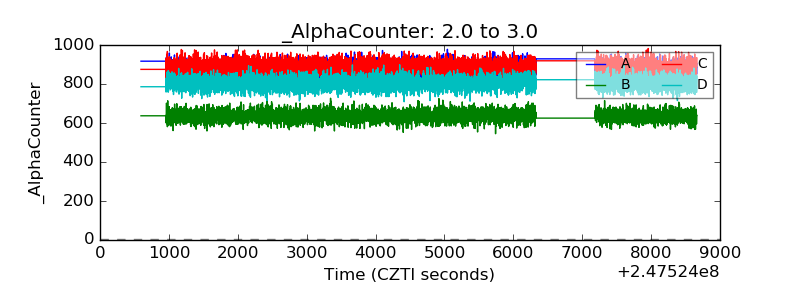 |
| _CPM_Rate | 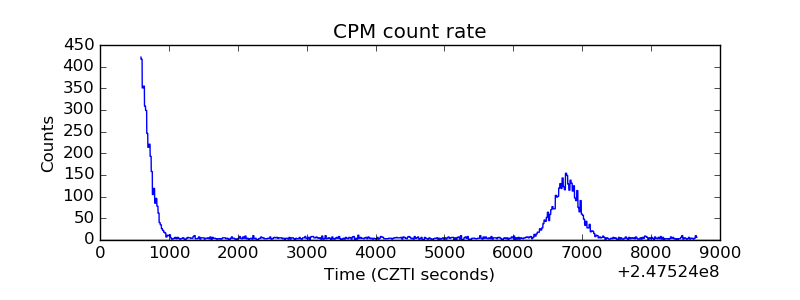 |
| CZT Counter | 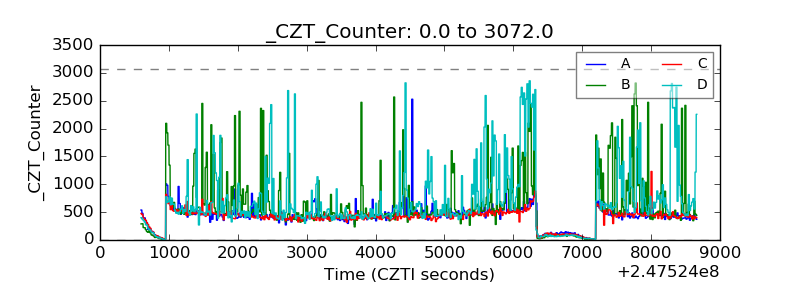 |
| +2.5 Volts monitor |  |
| +5 Volts monitor |  |
| _ROLL_ROT | 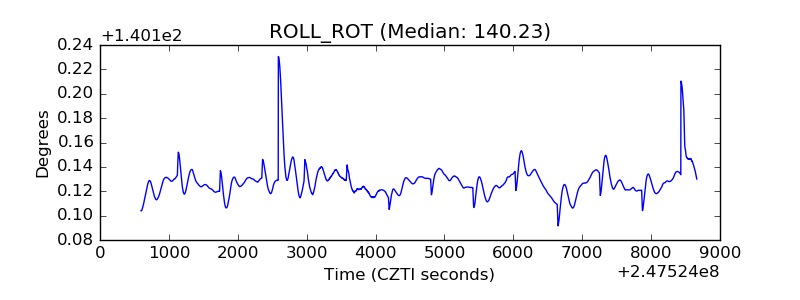 |
| _Roll_DEC | 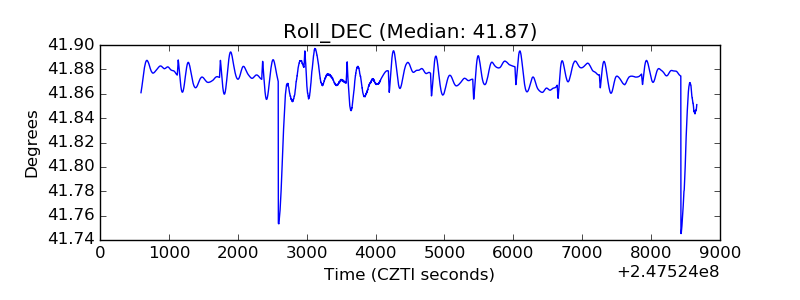 |
| _Roll_RA | 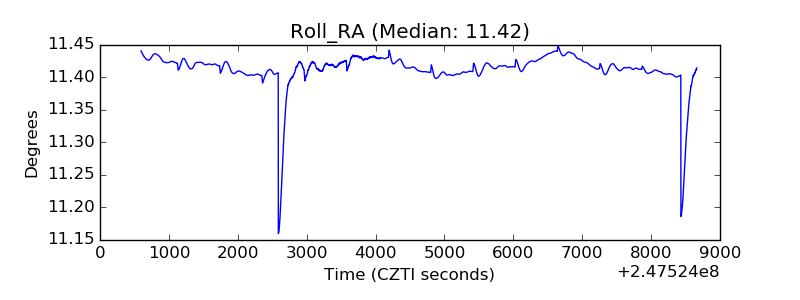 |
| Veto Counter | 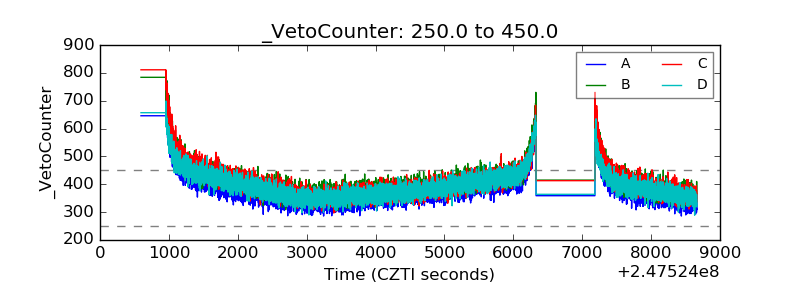 |