| Param | Original file | Final file |
|---|---|---|
| Filename | modeM0/AS1A04_022T02_9000001662_11381cztM0_level2.evt | modeM0/AS1A04_022T02_9000001662_11381cztM0_level2_quad_clean.evt |
| Size (bytes) | 696,116,160 | 105,649,920 |
| Size | 663.9 MB | 100.8 MB |
| Events in quadrant A | 4,660,050 | 656,768 |
| Events in quadrant B | 4,899,942 | 662,293 |
| Events in quadrant C | 3,599,905 | 729,159 |
| Events in quadrant D | 7,393,180 | 607,352 |
| Mode SS | |||
|---|---|---|---|
| Quadrant | BADHDUFLAG | Total packets | Discarded packets |
| A | 0 | 158 | 0 |
| B | 0 | 158 | 0 |
| C | 0 | 158 | 0 |
| D | 0 | 158 | 0 |
| Mode M0 | |||
|---|---|---|---|
| Quadrant | BADHDUFLAG | Total packets | Discarded packets |
| A | 0 | 19161 | 3 |
| B | 0 | 19872 | 2 |
| C | 0 | 16232 | 2 |
| D | 0 | 27458 | 2 |
| Mode M9 | |||
|---|---|---|---|
| Quadrant | BADHDUFLAG | Total packets | Discarded packets |
| A | 0 | 5 | 0 |
| B | 0 | 5 | 0 |
| C | 0 | 5 | 0 |
| D | 0 | 5 | 0 |
| Quadrant | Total seconds | Saturated seconds | Saturation percentage |
|---|---|---|---|
| A | 7823 | 259 | 3.310750% |
| B | 7823 | 445 | 5.688355% |
| C | 7823 | 38 | 0.485747% |
| D | 7823 | 1017 | 13.000128% |
Noise dominated data is calculated using 1-second bins in cleaned event files. If a bin has >2000 counts, and if more than 50% of those come from <1% of pixels, then it is considered to be noise-dominated and hence unusable.
| Quadrant | # 1 sec bins | Bins with >0 counts | Bins with >2000 counts | High rate bins dominated by noise | Noise dominated (total time) | Noise dominated (detector-on time) | Marked lightcurve |
|---|---|---|---|---|---|---|---|
| A | 8213 | 7826 | 112 | 112 | 1.36% | 1.43% | 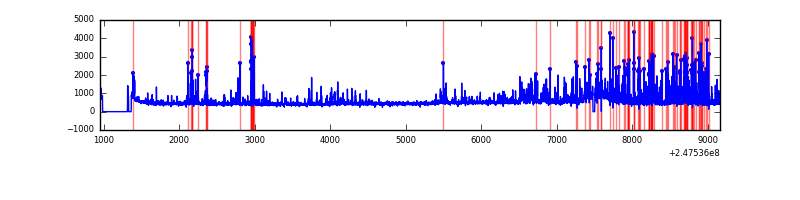 |
| B | 8213 | 7826 | 183 | 183 | 2.23% | 2.34% | 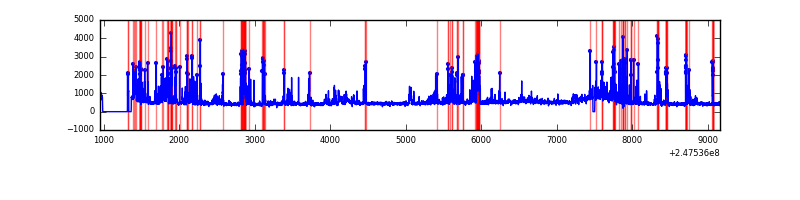 |
| C | 8213 | 7826 | 0 | 0 | 0.00% | 0.00% | 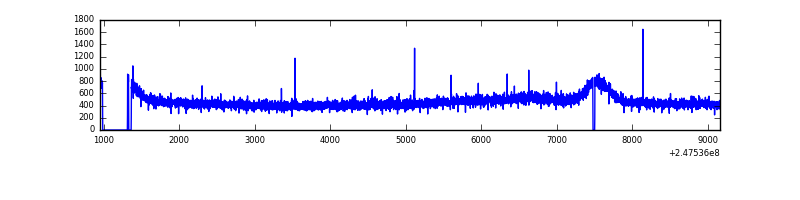 |
| D | 8213 | 7825 | 786 | 786 | 9.57% | 10.04% | 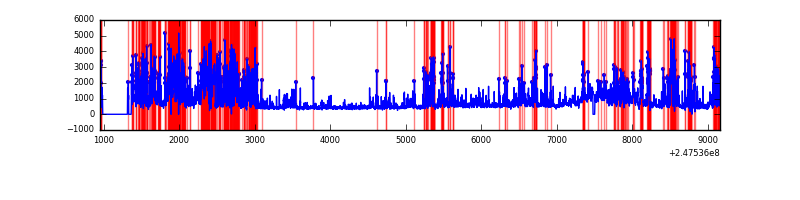 |
Top three noisy pixels from each quadrant. If the there are fewer than three noisy pixels in the level2.evt file, extra rows are filled as -1
| Pixel properties | Quadrant properties | ||||||
|---|---|---|---|---|---|---|---|
| Quadrant | DetID | PixID | Counts | Sigma | Mean | Median | Sigma |
| A | 8 | 5 | 1120007 | 6073.92 | 902 | 880 | 184.3 |
| A | 8 | 15 | 17109 | 88.08 | 902 | 880 | 184.3 |
| A | 8 | 6 | 12847 | 64.95 | 902 | 880 | 184.3 |
| B | 4 | 239 | 1145827 | 6624.82 | 902 | 878 | 172.8 |
| B | 3 | 64 | 90680 | 519.61 | 902 | 878 | 172.8 |
| B | 3 | 189 | 50896 | 289.41 | 902 | 878 | 172.8 |
| C | 13 | 61 | 6557 | 26.1 | 919 | 924 | 215.8 |
| C | 7 | 238 | 4487 | 16.51 | 919 | 924 | 215.8 |
| C | 14 | 234 | 4187 | 15.12 | 919 | 924 | 215.8 |
| D | 14 | 34 | 1301424 | 6341.65 | 850 | 824 | 205.1 |
| D | 1 | 52 | 1206167 | 5877.18 | 850 | 824 | 205.1 |
| D | 10 | 253 | 1018059 | 4959.98 | 850 | 824 | 205.1 |
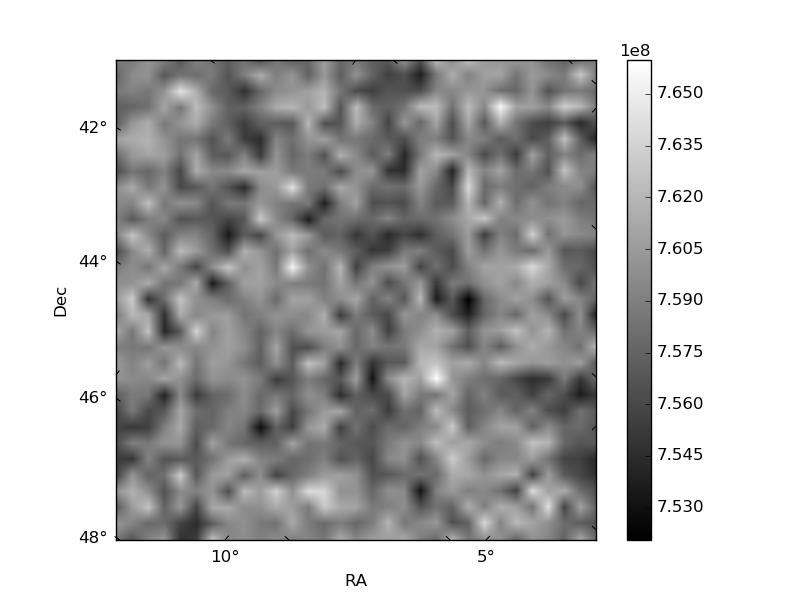
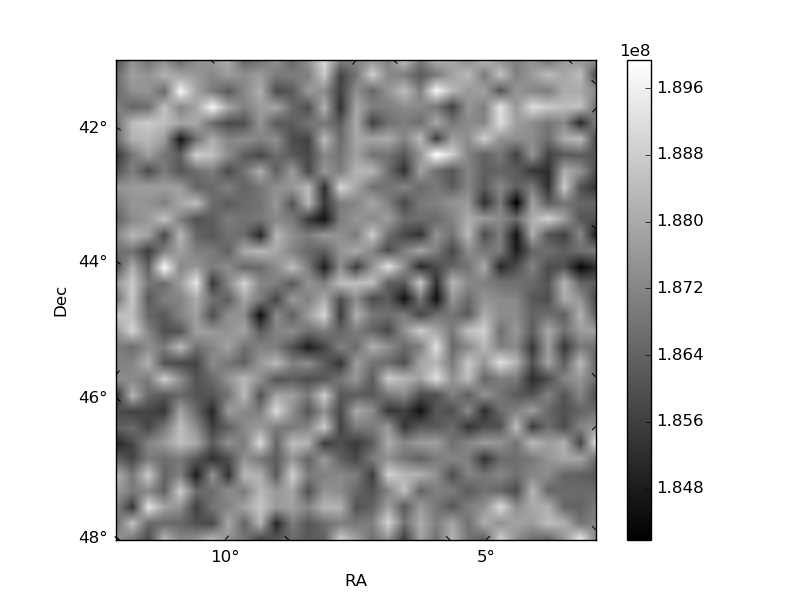
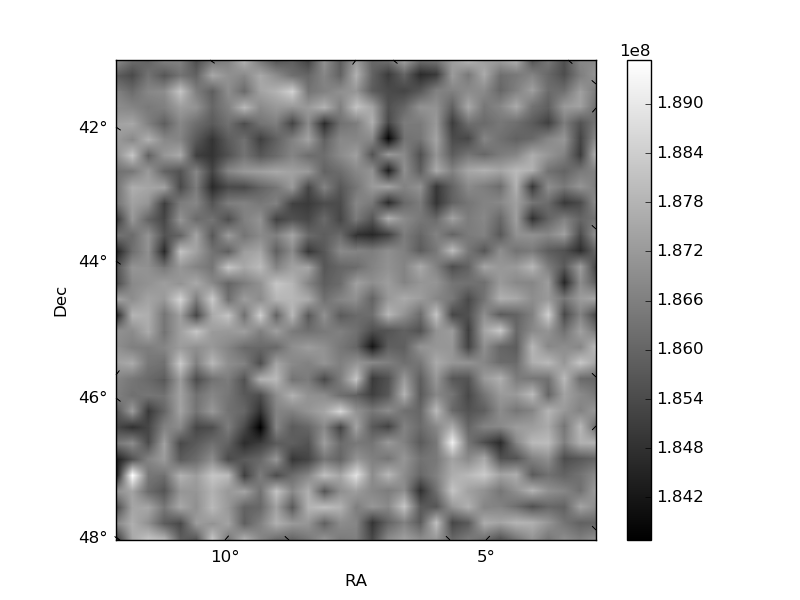
Histogram calculated using DETX and DETY for each event in the final _common_clean file
| Quadrant A | 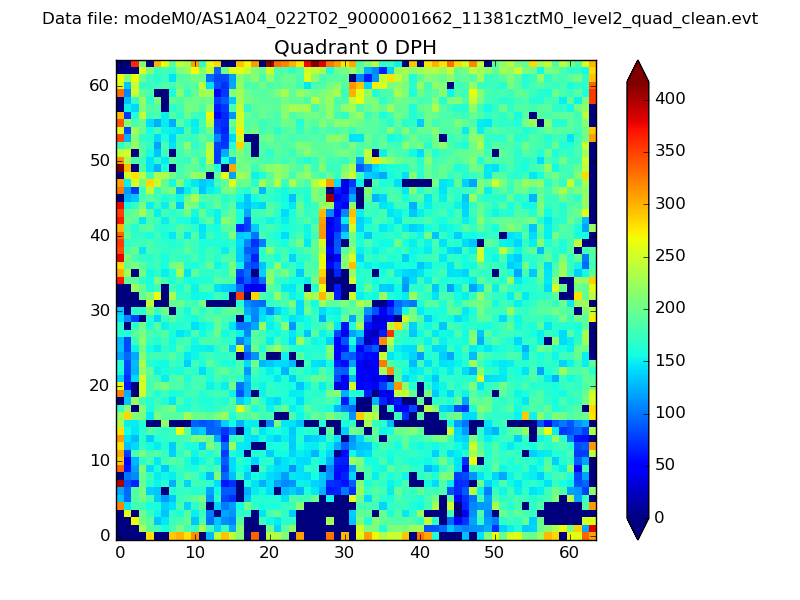 |
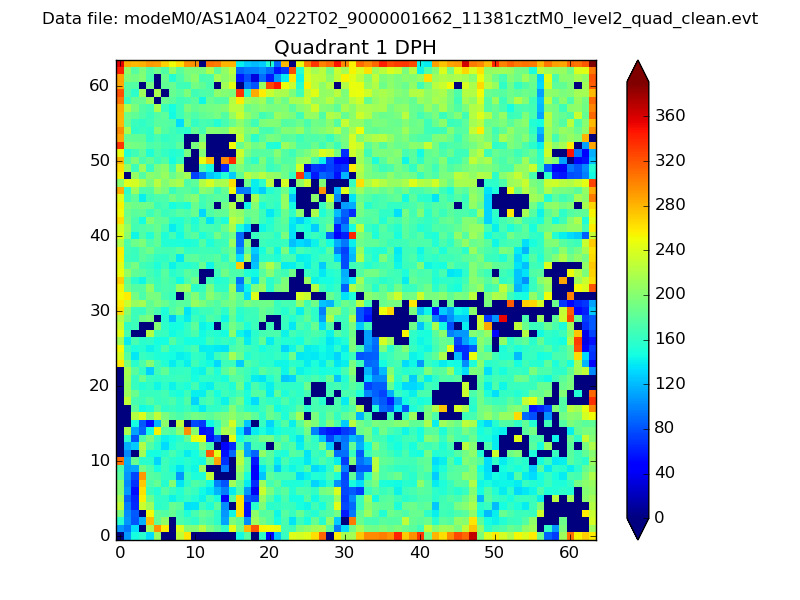 |
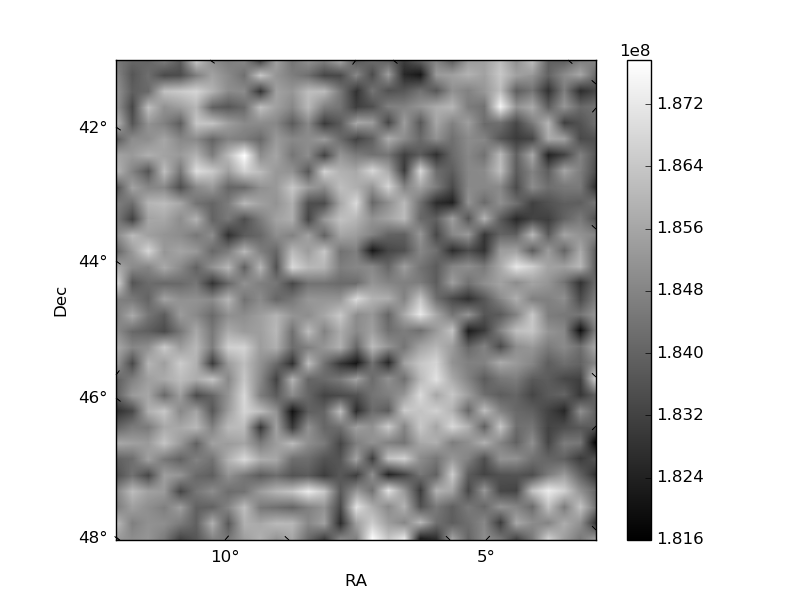
Quadrant B |
|---|---|---|---|
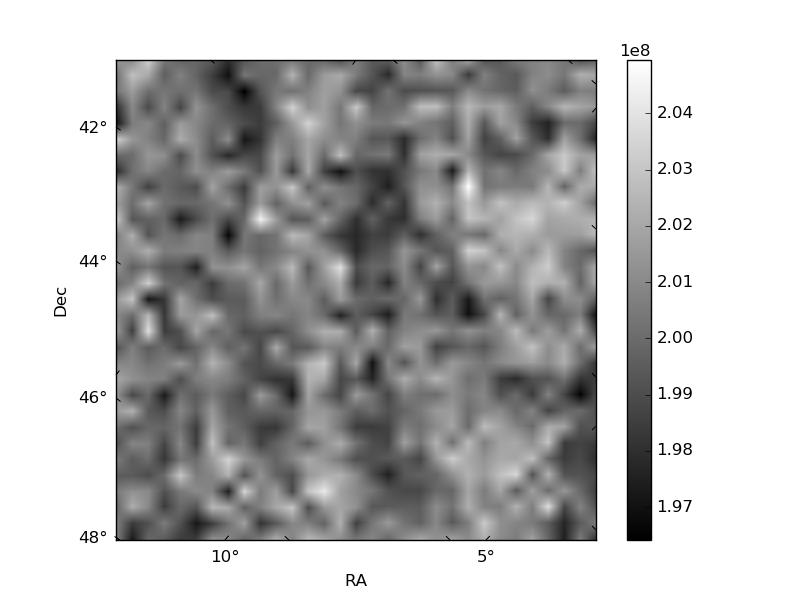
| Quadrant D | 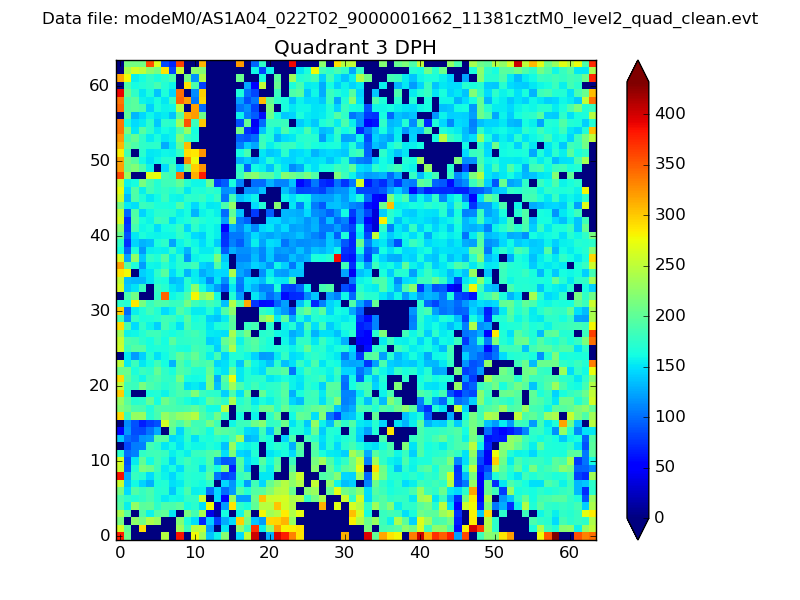 |
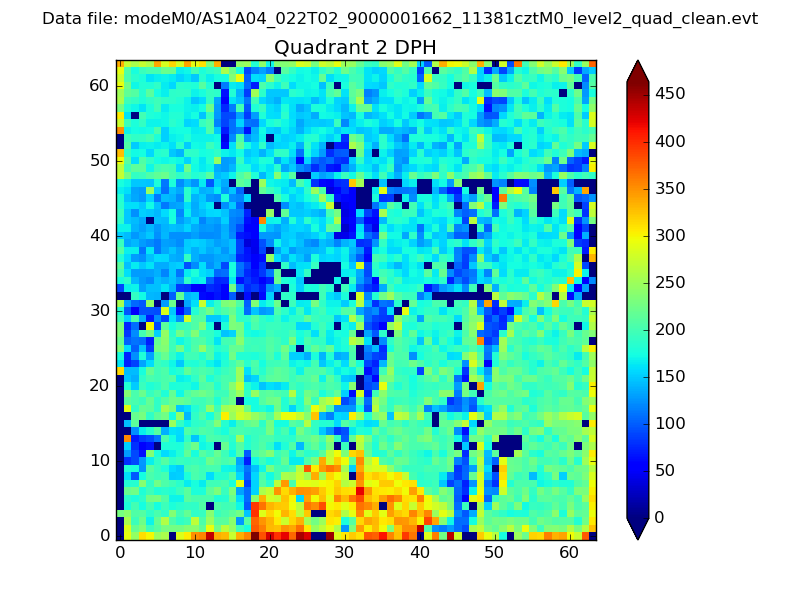 |
Quadrant C |
| Plot type | Count rate plots | Images |
|---|---|---|
| Comparison with Poisson distribution Blue bars denote a histogram of data divided into 1 sec bins. Red curve is a Poisson curve with rate = median count rate of data. |
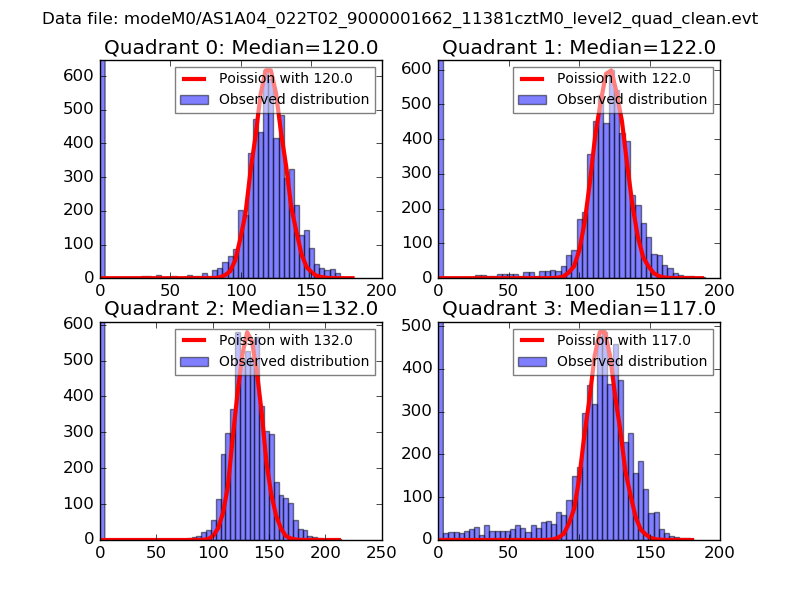 |
 |
| Quadrant-wise count rates Data is divided into 100 sec bins |
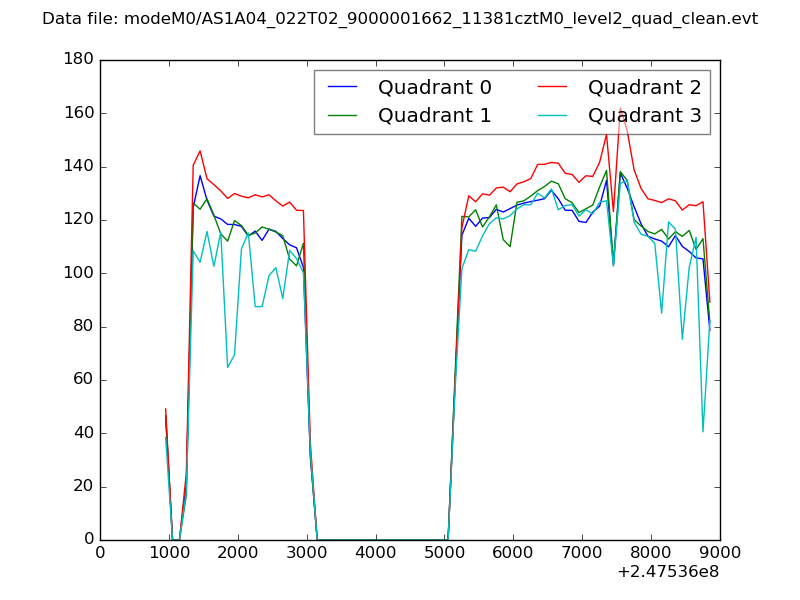 |
|
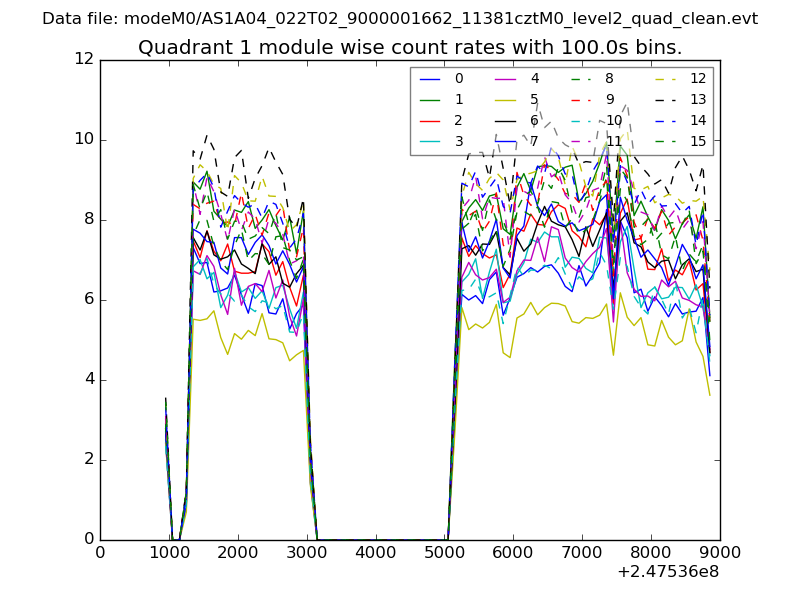
| Module-wise count rates for Quadrant A Data is divided into 100 sec bins |
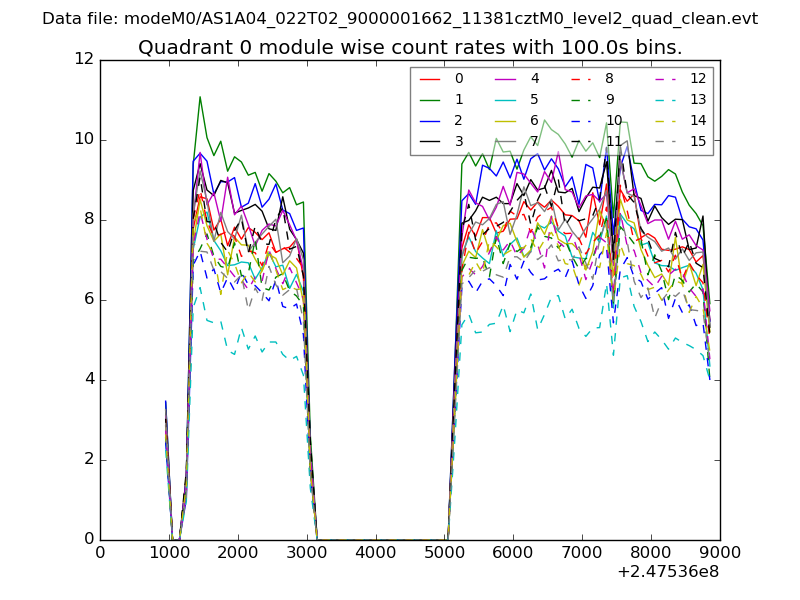 |
 |
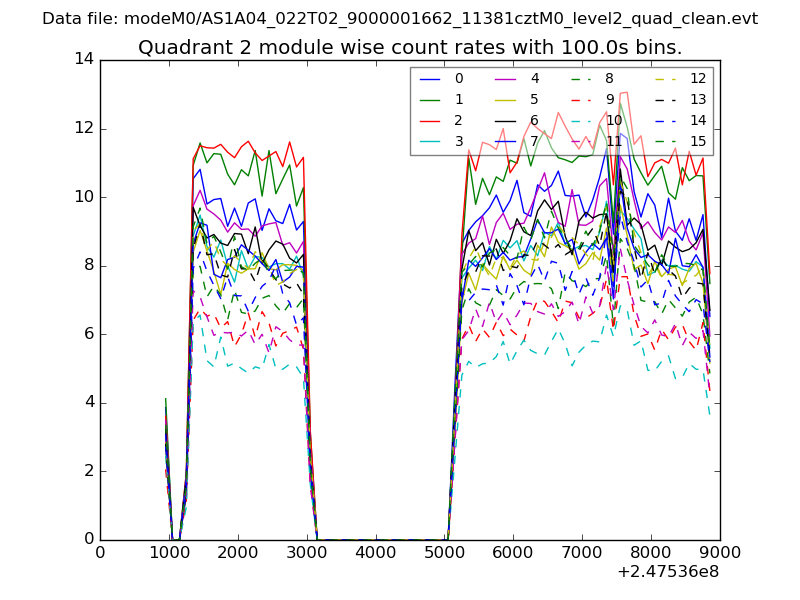
| Module-wise count rates for Quadrant B Data is divided into 100 sec bins |
 |
 |
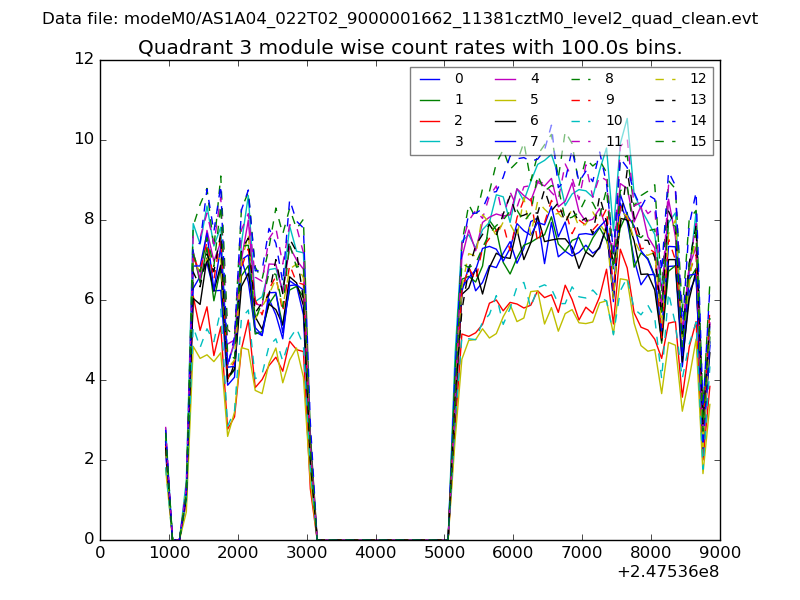
| Module-wise count rates for Quadrant C Data is divided into 100 sec bins |
 |
 |
| Module-wise count rates for Quadrant D Data is divided into 100 sec bins |
 |
 |
| Parameter | Plot |
|---|---|
| CZT HV Monitor |  |
| D_VDD | 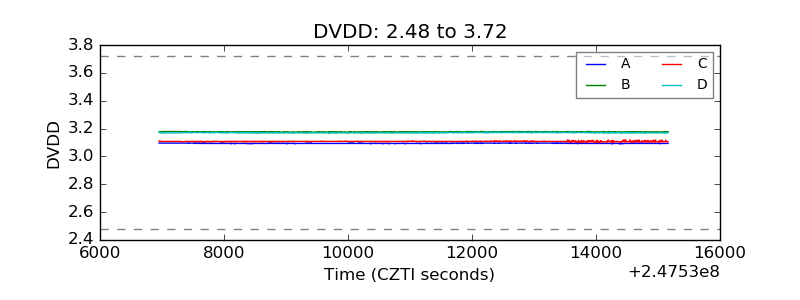 |
| Temperature 1 | 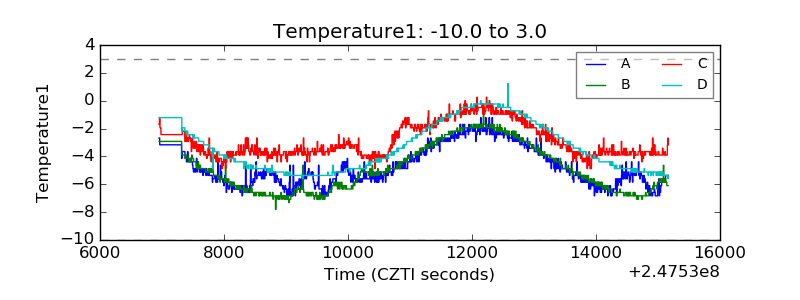 |
| Veto HV Monitor | 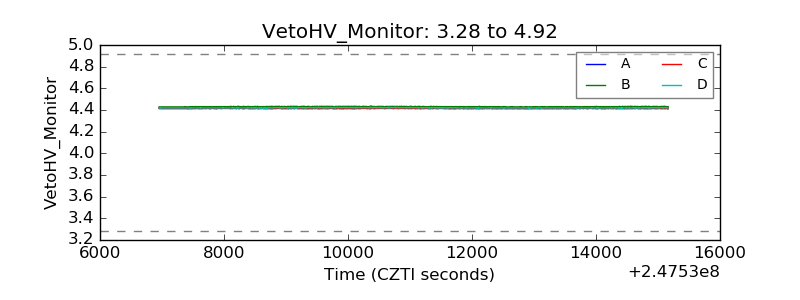 |
| Veto LLD | 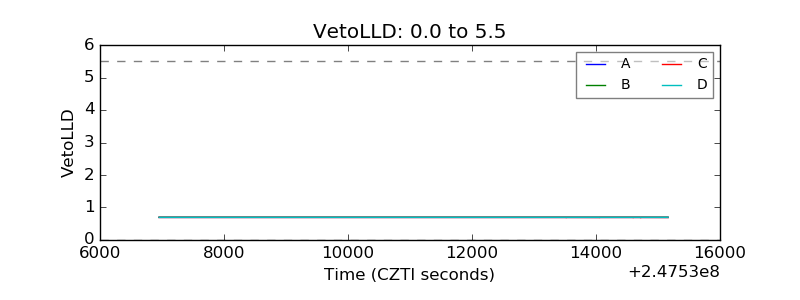 |
| Alpha Counter | 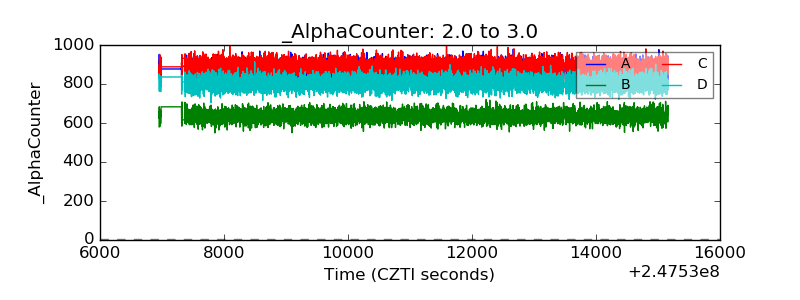 |
| _CPM_Rate | 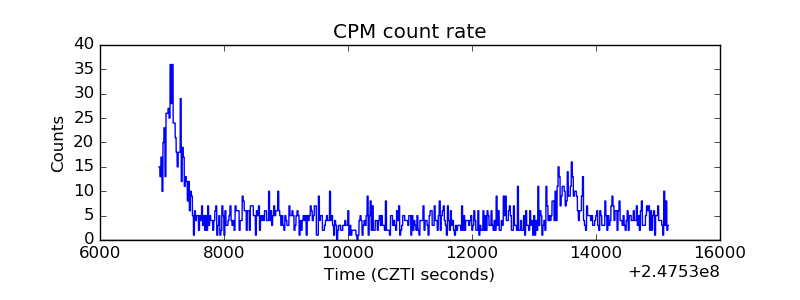 |
| CZT Counter | 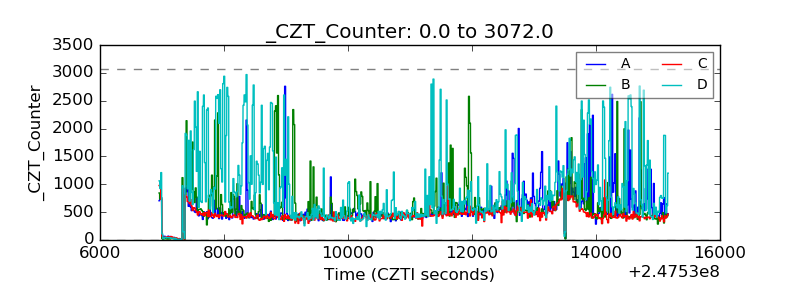 |
| +2.5 Volts monitor |  |
| +5 Volts monitor |  |
| _ROLL_ROT | 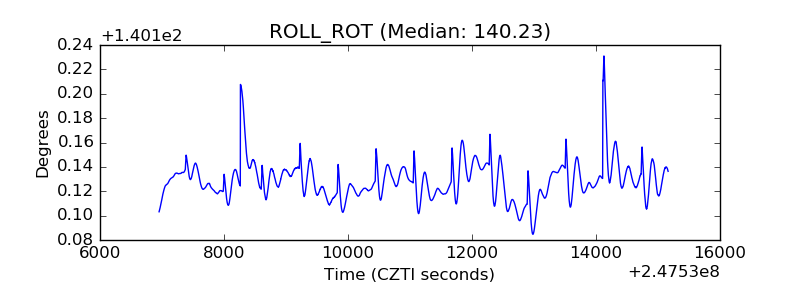 |
| _Roll_DEC | 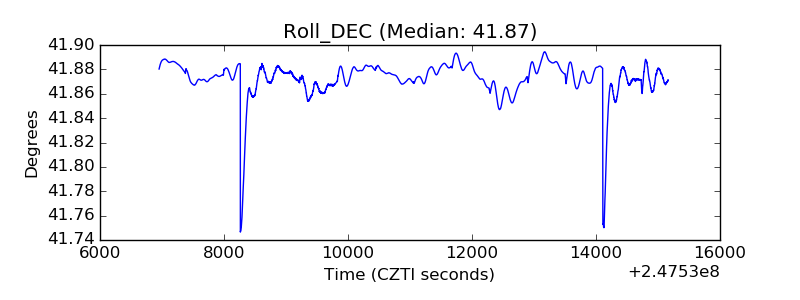 |
| _Roll_RA | 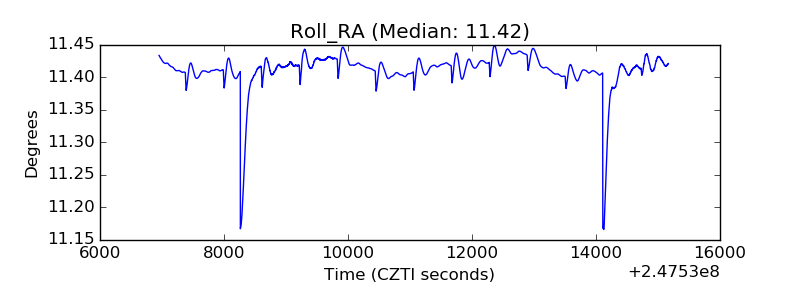 |
| Veto Counter | 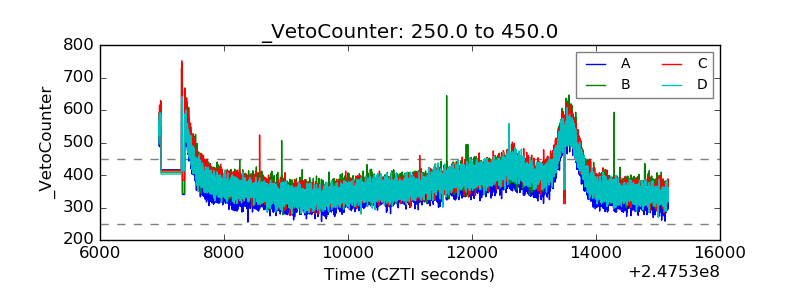 |