| Param | Original file | Final file |
|---|---|---|
| Filename | modeM0/AS1A04_022T02_9000001662_11382cztM0_level2.evt | modeM0/AS1A04_022T02_9000001662_11382cztM0_level2_quad_clean.evt |
| Size (bytes) | 475,185,600 | 54,838,080 |
| Size | 453.2 MB | 52.3 MB |
| Events in quadrant A | 4,581,717 | 307,698 |
| Events in quadrant B | 2,859,923 | 337,363 |
| Events in quadrant C | 2,154,783 | 363,749 |
| Events in quadrant D | 4,457,309 | 302,584 |
| Mode SS | |||
|---|---|---|---|
| Quadrant | BADHDUFLAG | Total packets | Discarded packets |
| A | 0 | 100 | 0 |
| B | 0 | 100 | 0 |
| C | 0 | 100 | 0 |
| D | 0 | 100 | 0 |
| Mode M0 | |||
|---|---|---|---|
| Quadrant | BADHDUFLAG | Total packets | Discarded packets |
| A | 0 | 16943 | 0 |
| B | 0 | 11911 | 0 |
| C | 0 | 9967 | 0 |
| D | 0 | 16641 | 0 |
| Quadrant | Total seconds | Saturated seconds | Saturation percentage |
|---|---|---|---|
| A | 4966 | 782 | 15.747080% |
| B | 4966 | 179 | 3.604511% |
| C | 4966 | 0 | 0.000000% |
| D | 4966 | 486 | 9.786549% |
Noise dominated data is calculated using 1-second bins in cleaned event files. If a bin has >2000 counts, and if more than 50% of those come from <1% of pixels, then it is considered to be noise-dominated and hence unusable.
| Quadrant | # 1 sec bins | Bins with >0 counts | Bins with >2000 counts | High rate bins dominated by noise | Noise dominated (total time) | Noise dominated (detector-on time) | Marked lightcurve |
|---|---|---|---|---|---|---|---|
| A | 4966 | 4965 | 520 | 520 | 10.47% | 10.47% | 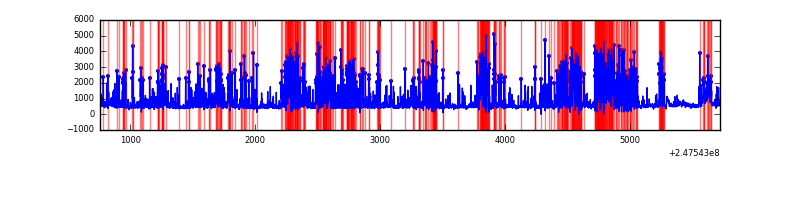 |
| B | 4966 | 4966 | 130 | 130 | 2.62% | 2.62% | 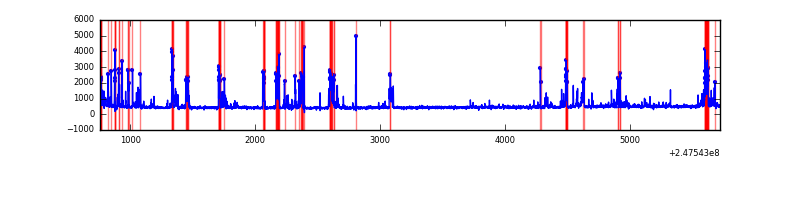 |
| C | 4966 | 4966 | 0 | 0 | 0.00% | 0.00% | 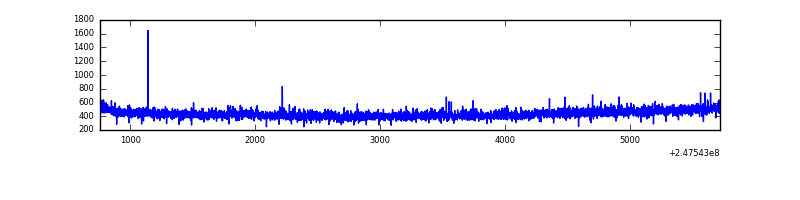 |
| D | 4966 | 4966 | 397 | 397 | 7.99% | 7.99% | 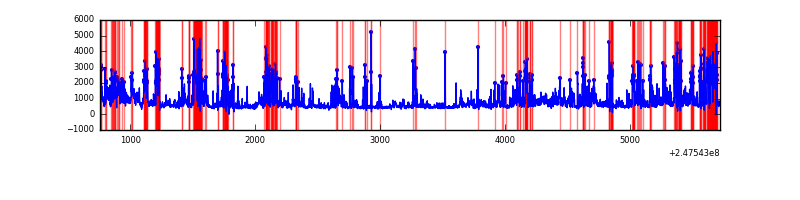 |
Top three noisy pixels from each quadrant. If the there are fewer than three noisy pixels in the level2.evt file, extra rows are filled as -1
| Pixel properties | Quadrant properties | ||||||
|---|---|---|---|---|---|---|---|
| Quadrant | DetID | PixID | Counts | Sigma | Mean | Median | Sigma |
| A | 8 | 5 | 2536817 | 24090.67 | 509 | 498 | 105.3 |
| A | 13 | 210 | 40450 | 379.48 | 509 | 498 | 105.3 |
| A | 8 | 6 | 14085 | 129.05 | 509 | 498 | 105.3 |
| B | 4 | 239 | 678211 | 6407.32 | 544 | 531 | 105.8 |
| B | 0 | 214 | 18132 | 166.41 | 544 | 531 | 105.8 |
| B | 3 | 64 | 13175 | 119.55 | 544 | 531 | 105.8 |
| C | 8 | 128 | 8054 | 58.41 | 547 | 551 | 128.4 |
| C | 8 | 112 | 4827 | 33.29 | 547 | 551 | 128.4 |
| C | 13 | 61 | 3964 | 26.57 | 547 | 551 | 128.4 |
| D | 14 | 34 | 1003047 | 8084.71 | 508 | 494 | 124.0 |
| D | 1 | 52 | 760236 | 6126.65 | 508 | 494 | 124.0 |
| D | 10 | 253 | 345052 | 2778.56 | 508 | 494 | 124.0 |
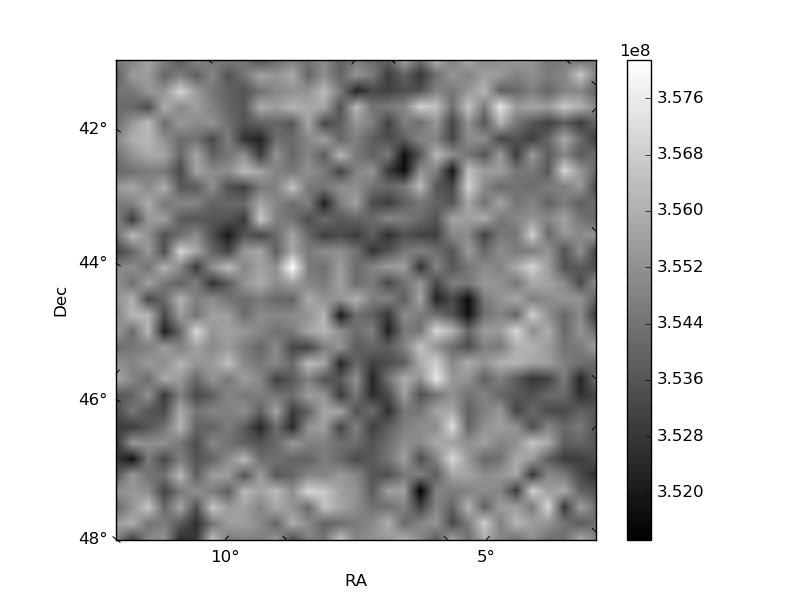
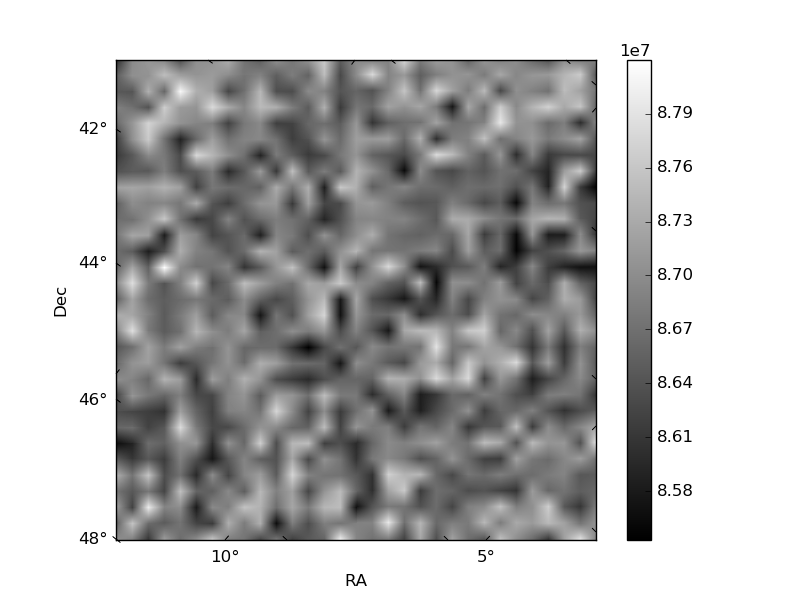
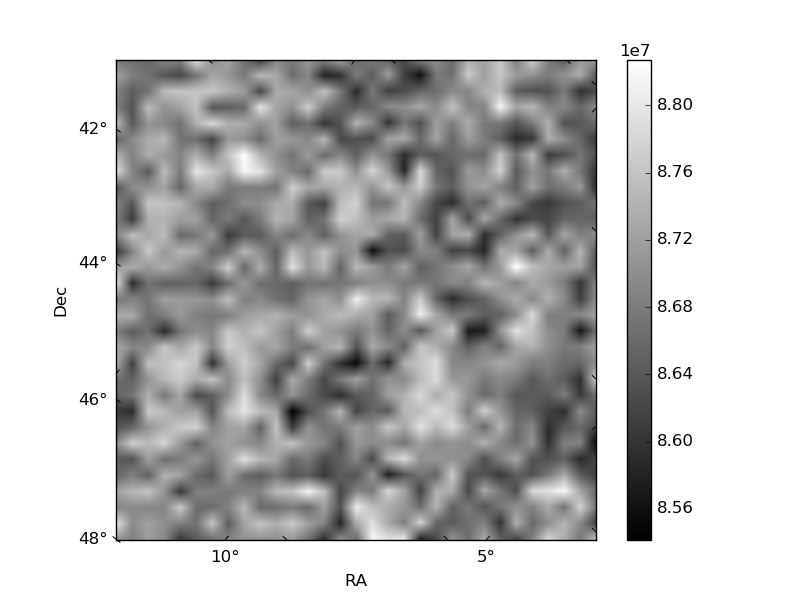
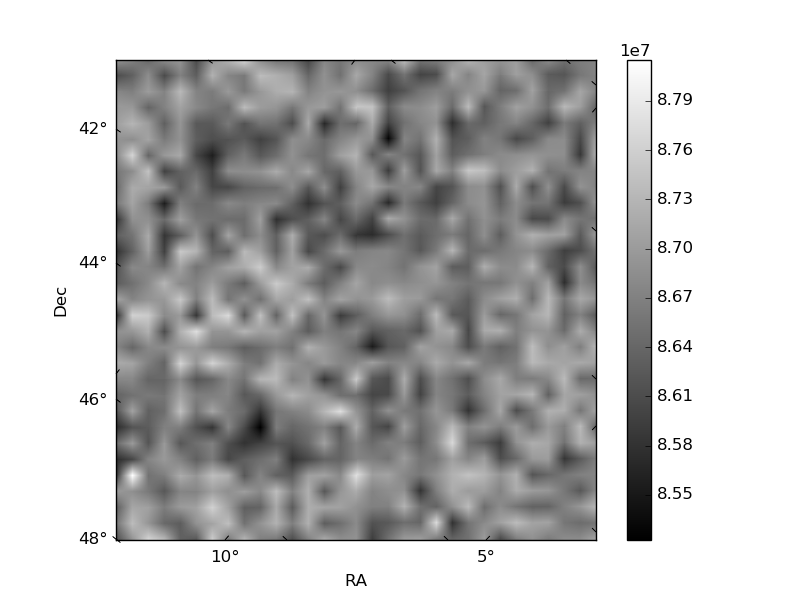
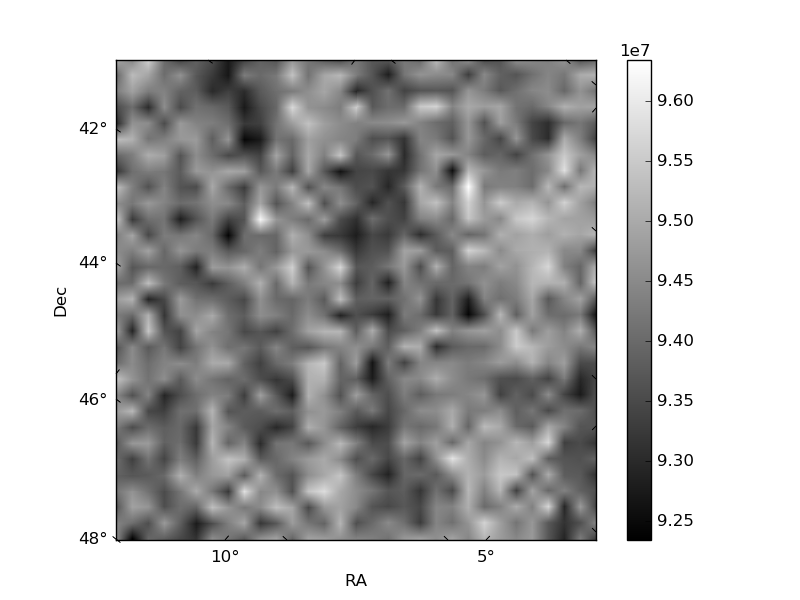
Histogram calculated using DETX and DETY for each event in the final _common_clean file
| Quadrant A | 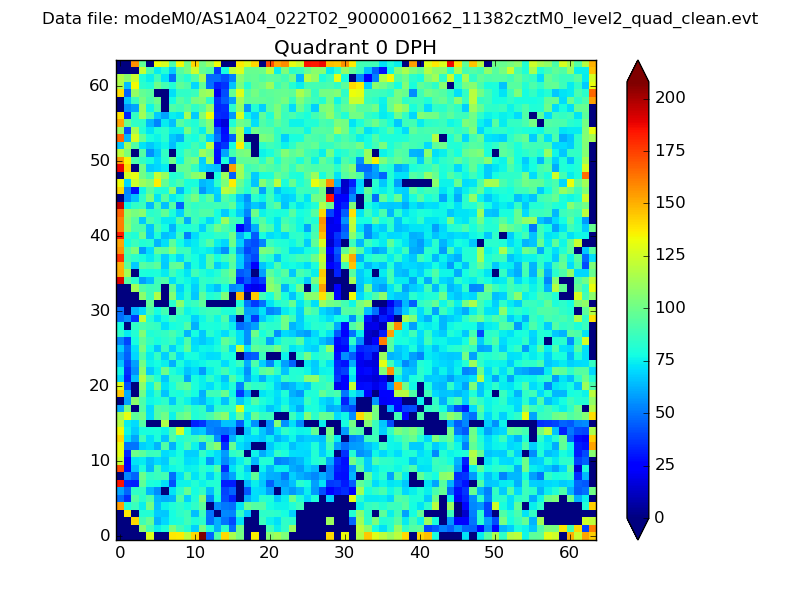 |
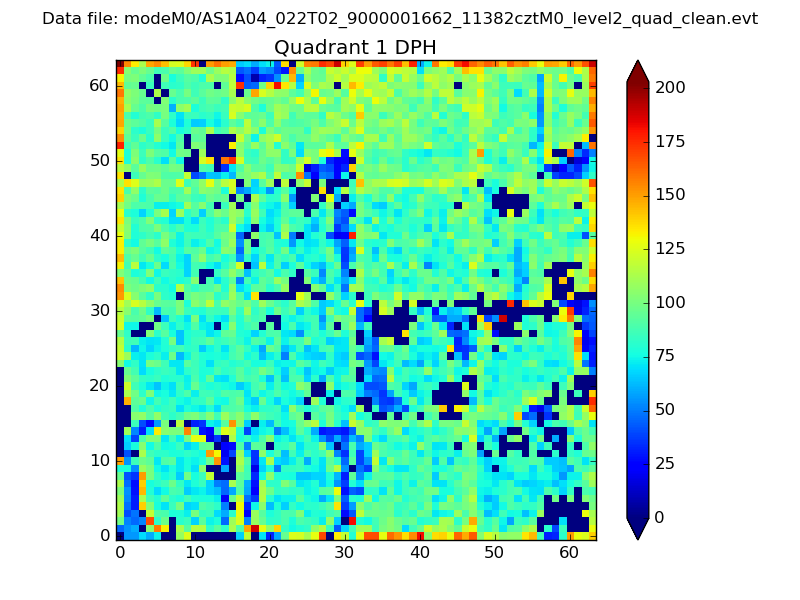 |
Quadrant B |
|---|---|---|---|
| Quadrant D | 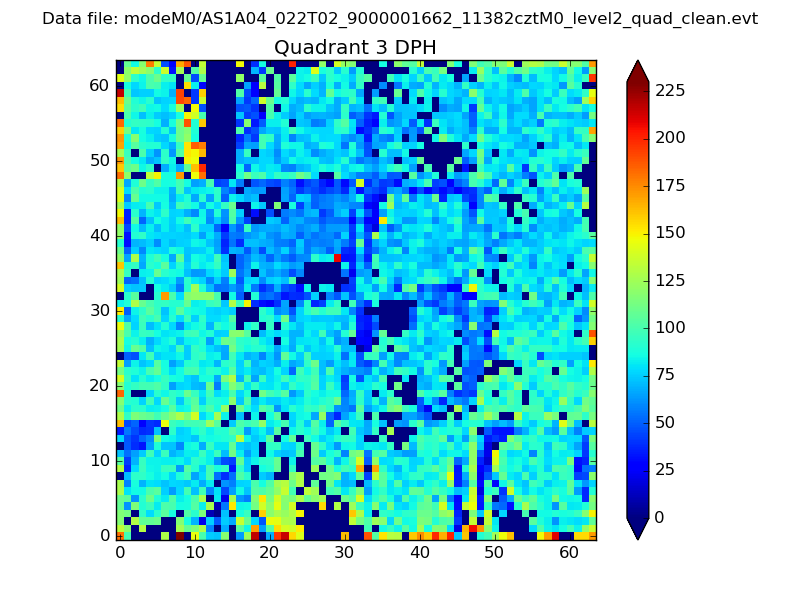 |
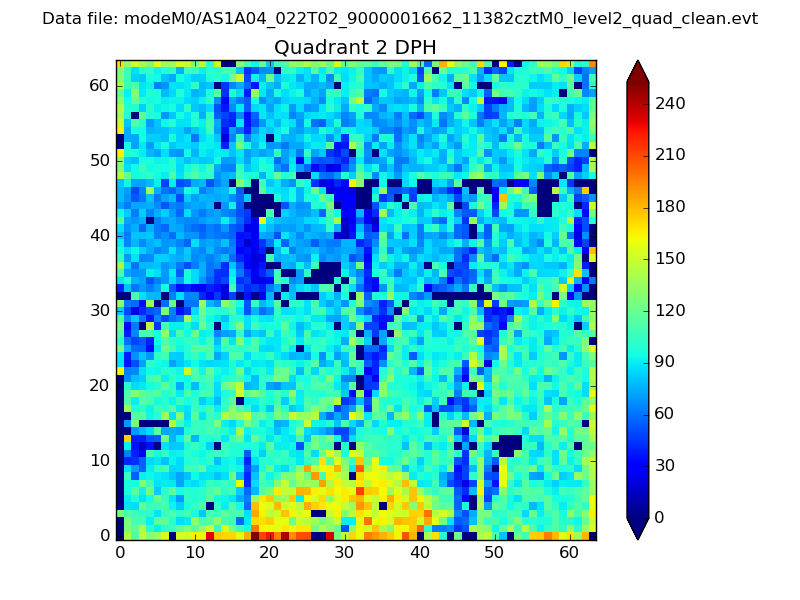 |
Quadrant C |
| Plot type | Count rate plots | Images |
|---|---|---|
| Comparison with Poisson distribution Blue bars denote a histogram of data divided into 1 sec bins. Red curve is a Poisson curve with rate = median count rate of data. |
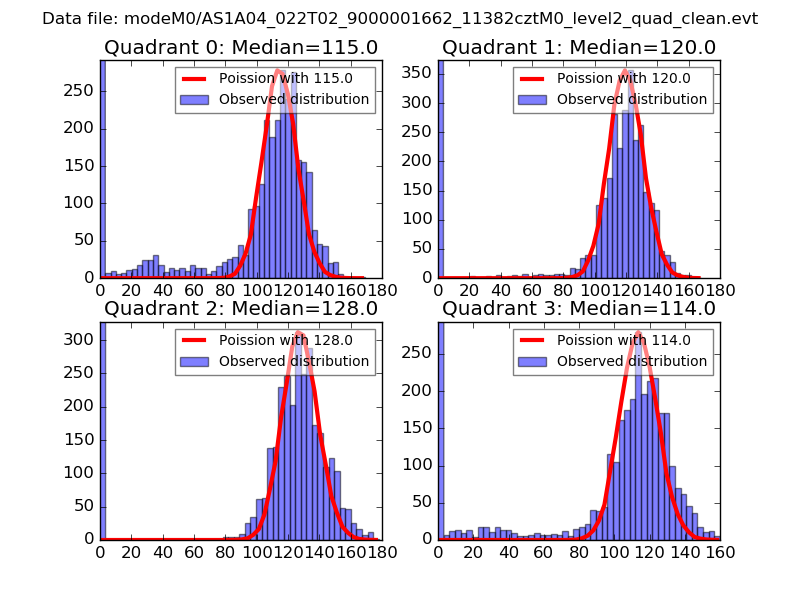 |
 |
| Quadrant-wise count rates Data is divided into 100 sec bins |
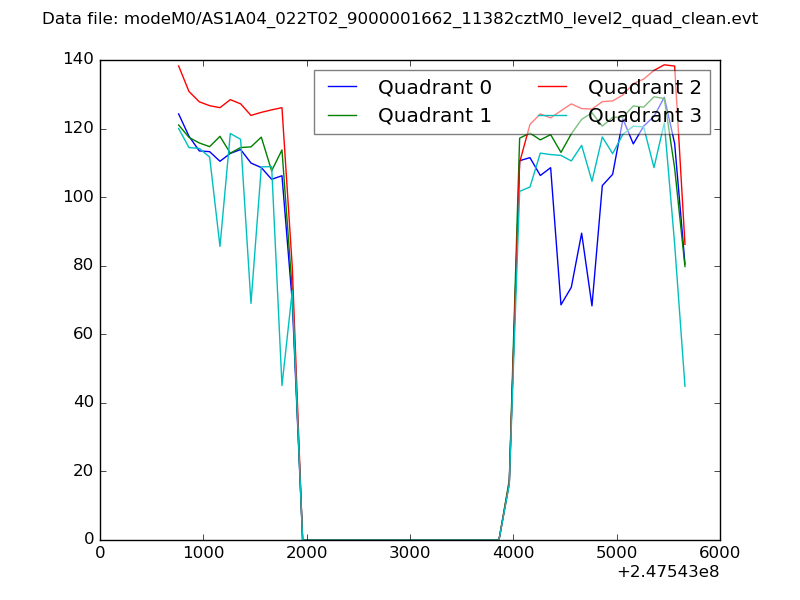 |
|
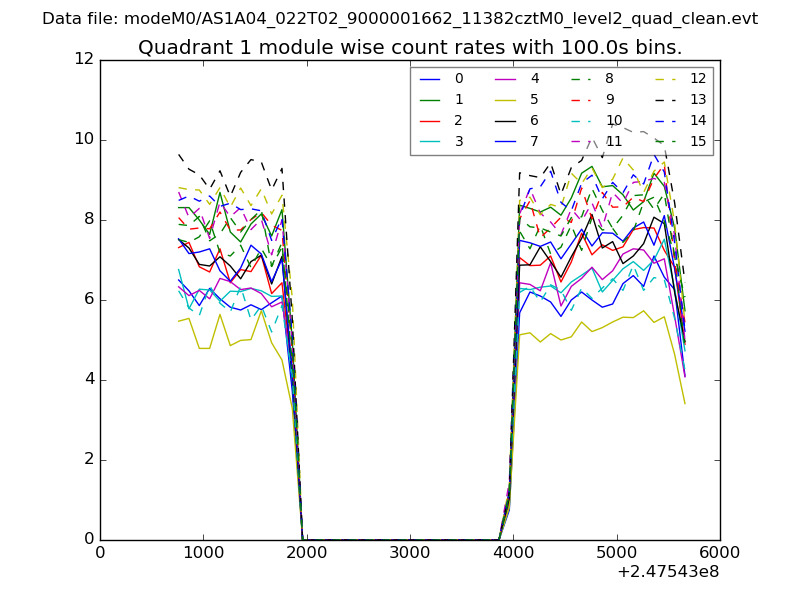
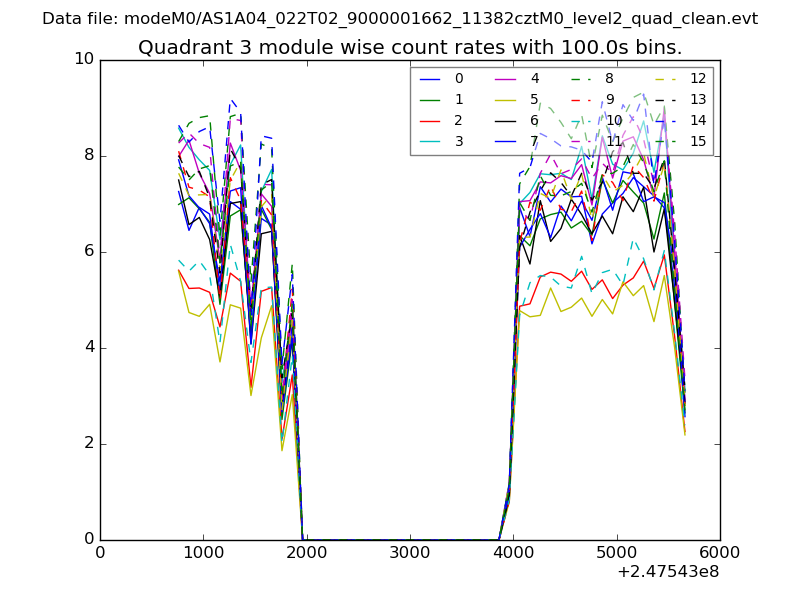
| Module-wise count rates for Quadrant A Data is divided into 100 sec bins |
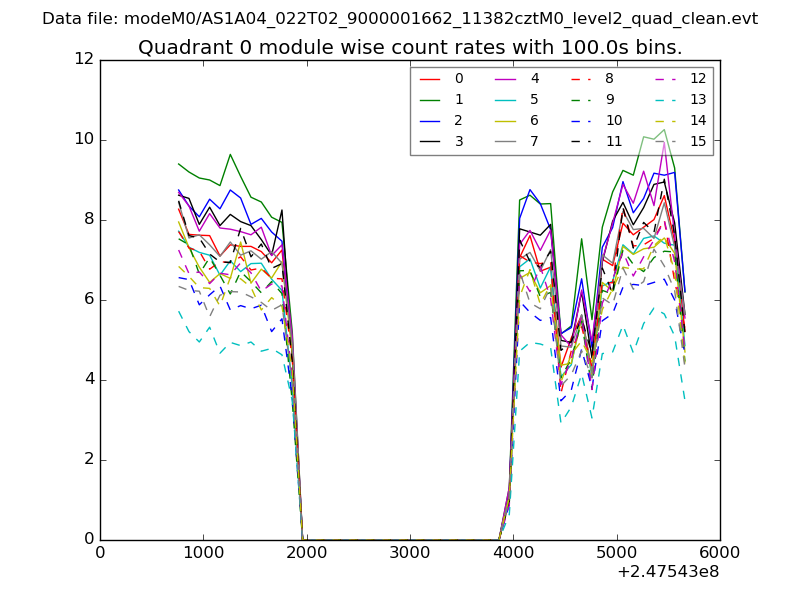 |
 |
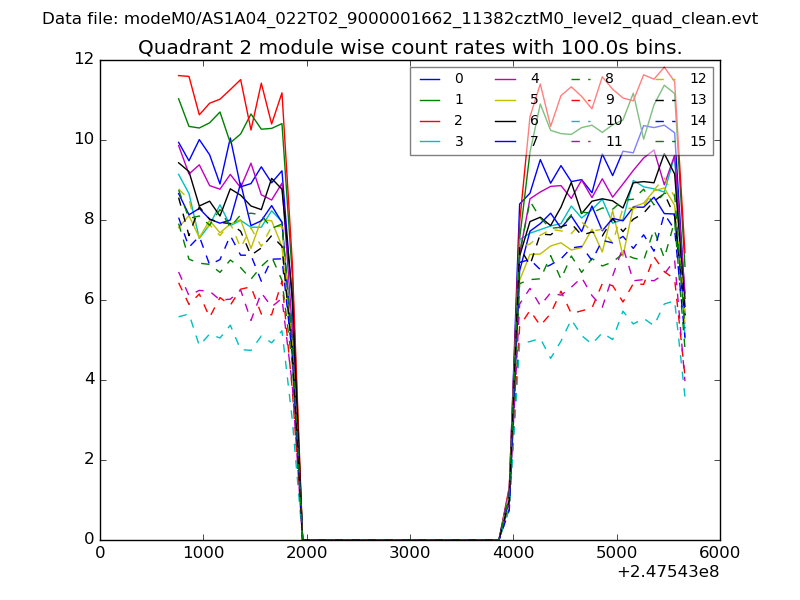
| Module-wise count rates for Quadrant B Data is divided into 100 sec bins |
 |
 |
| Module-wise count rates for Quadrant C Data is divided into 100 sec bins |
 |
 |
| Module-wise count rates for Quadrant D Data is divided into 100 sec bins |
 |
 |
| Parameter | Plot |
|---|---|
| CZT HV Monitor | 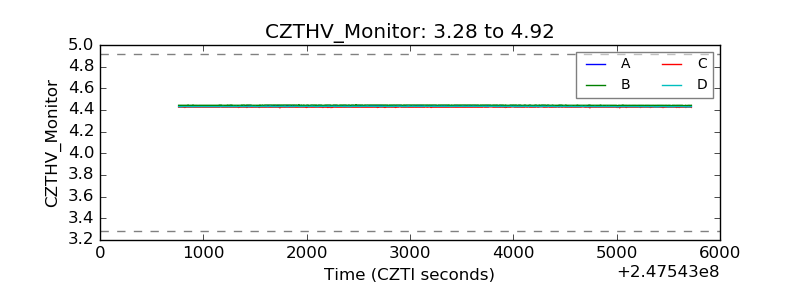 |
| D_VDD | 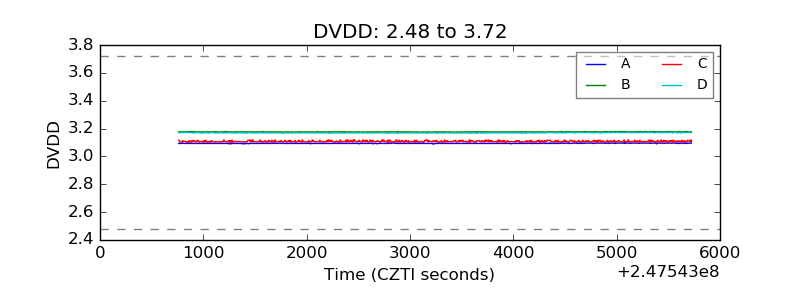 |
| Temperature 1 | 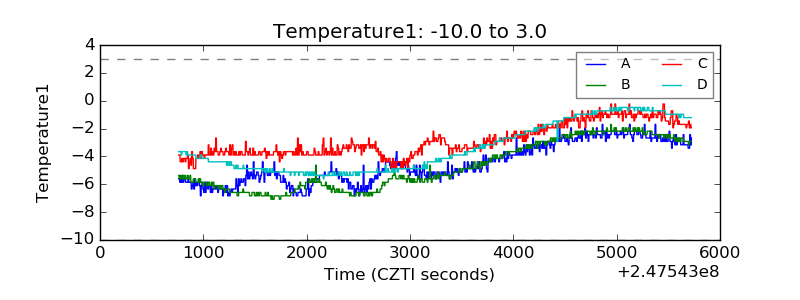 |
| Veto HV Monitor | 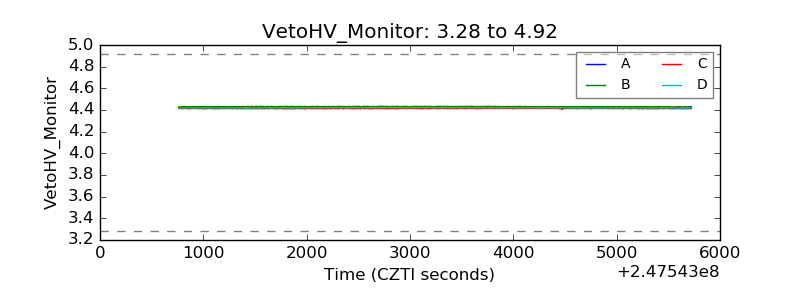 |
| Veto LLD |  |
| Alpha Counter | 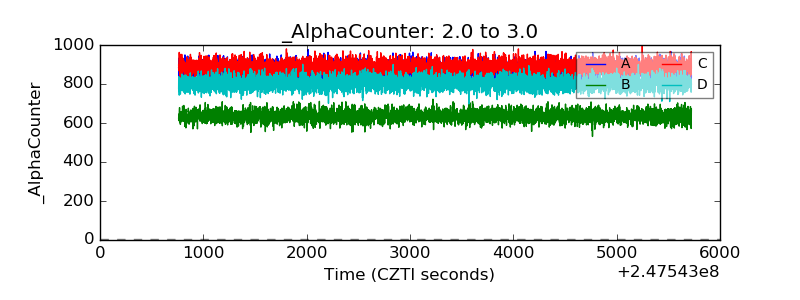 |
| _CPM_Rate | 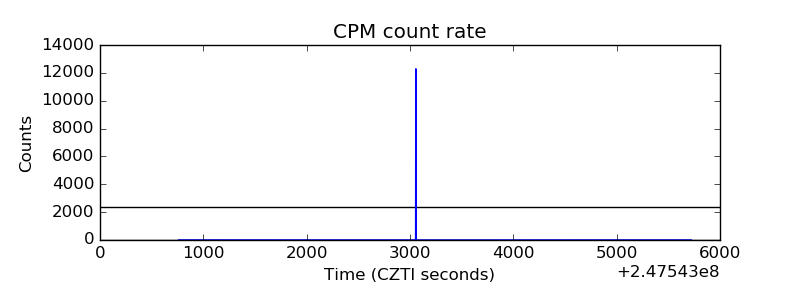 |
| CZT Counter | 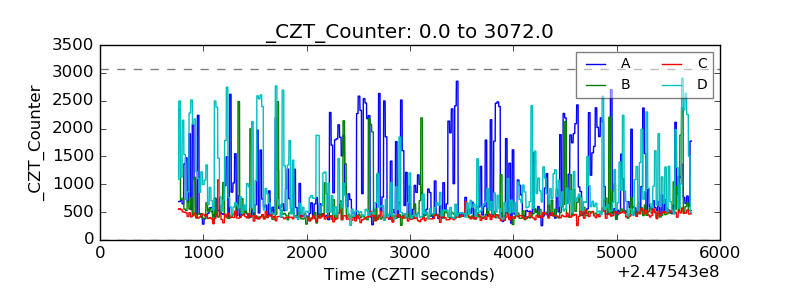 |
| +2.5 Volts monitor |  |
| +5 Volts monitor |  |
| _ROLL_ROT | 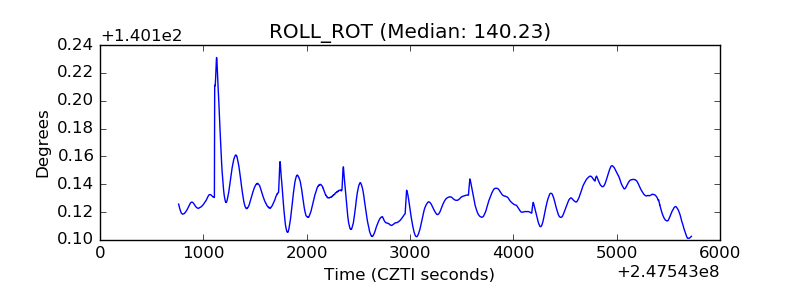 |
| _Roll_DEC | 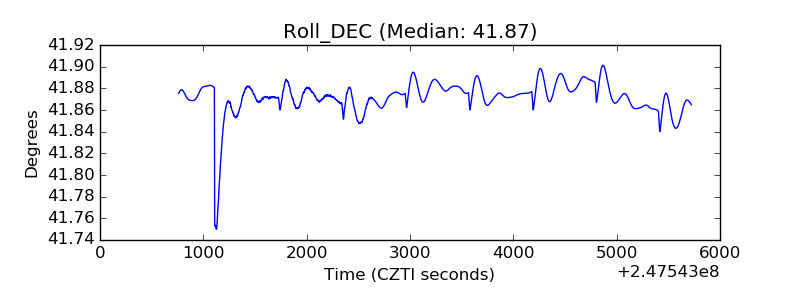 |
| _Roll_RA | 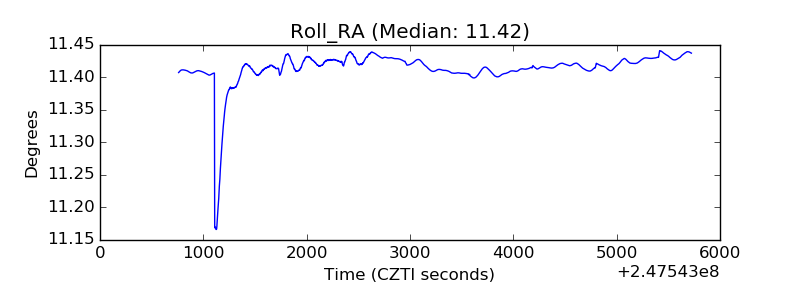 |
| Veto Counter | 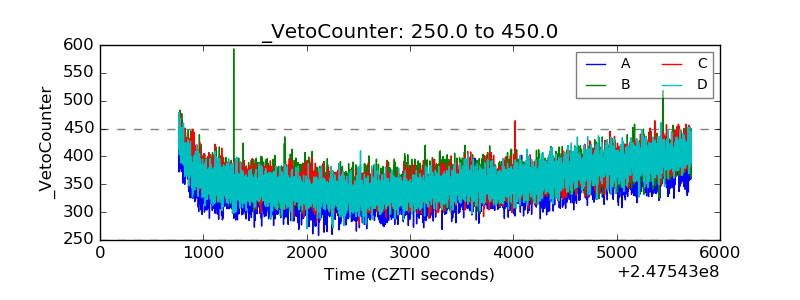 |