| Param | Original file | Final file |
|---|---|---|
| Filename | modeM0/AS1A04_022T03_9000001664cztM0_level2.fits | modeM0/AS1A04_022T03_9000001664cztM0_level2_quad_clean.evt |
| Size (bytes) | 462,314,880 | 423,455,040 |
| Size | 440.9 MB | 403.8 MB |
| Events in quadrant A | 2,807,318 | 2,461,202 |
| Events in quadrant B | 2,631,228 | 2,252,398 |
| Events in quadrant C | 2,849,240 | 2,601,103 |
| Events in quadrant D | 2,356,610 | 2,155,447 |
| Mode M9 | |||
|---|---|---|---|
| Quadrant | BADHDUFLAG | Total packets | Discarded packets |
| A | 0 | 95 | 0 |
| B | 0 | 95 | 0 |
| C | 0 | 95 | 0 |
| D | 0 | 95 | 0 |
| Mode M0 | |||
|---|---|---|---|
| Quadrant | BADHDUFLAG | Total packets | Discarded packets |
| A | 0 | 120237 | 0 |
| B | 0 | 136330 | 0 |
| C | 0 | 100574 | 0 |
| D | 0 | 151605 | 0 |
| Mode SS | |||
|---|---|---|---|
| Quadrant | BADHDUFLAG | Total packets | Discarded packets |
| A | 0 | 998 | 0 |
| B | 0 | 998 | 0 |
| C | 0 | 998 | 0 |
| D | 0 | 998 | 0 |
| Quadrant | Total seconds | Saturated seconds | Saturation percentage |
|---|---|---|---|
| A | 48864 | 1840 | 3.765553% |
| B | 48864 | 4064 | 8.316961% |
| C | 48864 | 469 | 0.959807% |
| D | 48864 | 4093 | 8.376310% |
Noise dominated data is calculated using 1-second bins in cleaned event files. If a bin has >2000 counts, and if more than 50% of those come from <1% of pixels, then it is considered to be noise-dominated and hence unusable.
| Quadrant | # 1 sec bins | Bins with >0 counts | Bins with >2000 counts | High rate bins dominated by noise | Noise dominated (total time) | Noise dominated (detector-on time) | Marked lightcurve |
|---|---|---|---|---|---|---|---|
| A | 58274 | 48859 | 0 | 0 | 0.00% | 0.00% |  |
| B | 58274 | 48811 | 0 | 0 | 0.00% | 0.00% | 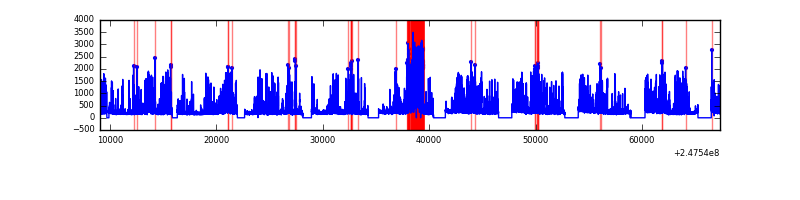 |
| C | 58274 | 48865 | 0 | 0 | 0.00% | 0.00% |  |
| D | 58274 | 48769 | 0 | 0 | 0.00% | 0.00% |  |
Top three noisy pixels from each quadrant. If the there are fewer than three noisy pixels in the level2.evt file, extra rows are filled as -1
| Pixel properties | Quadrant properties | ||||||
|---|---|---|---|---|---|---|---|
| Quadrant | DetID | PixID | Counts | Sigma | Mean | Median | Sigma |
| A | 0 | 29 | 2686 | 11.01 | 731 | 685 | 181.7 |
| A | 7 | 110 | 2244 | 8.58 | 731 | 685 | 181.7 |
| A | 9 | 19 | 2098 | 7.78 | 731 | 685 | 181.7 |
| B | 2 | 9 | 2254 | 11.46 | 694 | 661 | 139.0 |
| B | 3 | 17 | 1747 | 7.82 | 694 | 661 | 139.0 |
| B | 5 | 128 | 1730 | 7.69 | 694 | 661 | 139.0 |
| C | 1 | 81 | 2129 | 7.33 | 749 | 699 | 195.2 |
| C | 12 | 250 | 2126 | 7.31 | 749 | 699 | 195.2 |
| C | 1 | 80 | 2124 | 7.3 | 749 | 699 | 195.2 |
| D | 6 | 231 | 1692 | 6.03 | 670 | 609 | 179.5 |
| D | 6 | 38 | 1661 | 5.86 | 670 | 609 | 179.5 |
| D | 10 | 189 | 1659 | 5.85 | 670 | 609 | 179.5 |
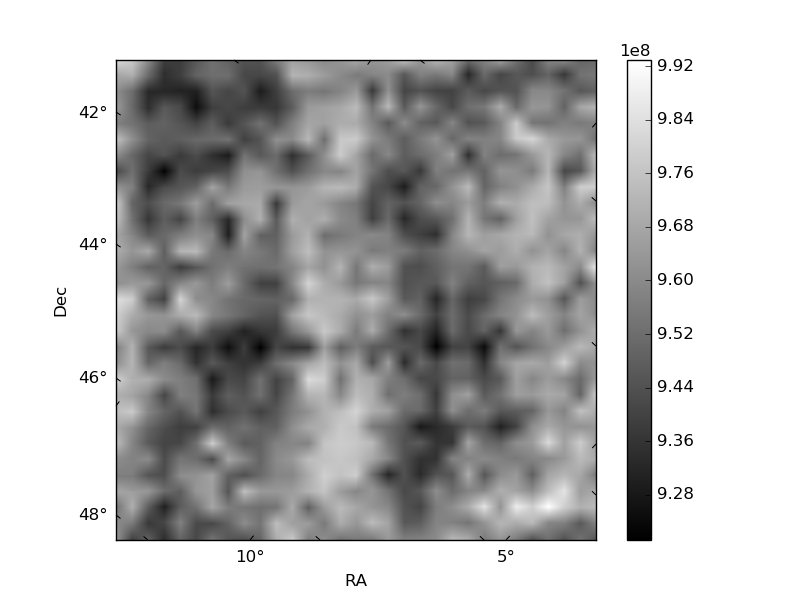
Histogram calculated using DETX and DETY for each event in the final _common_clean file
| Quadrant A | 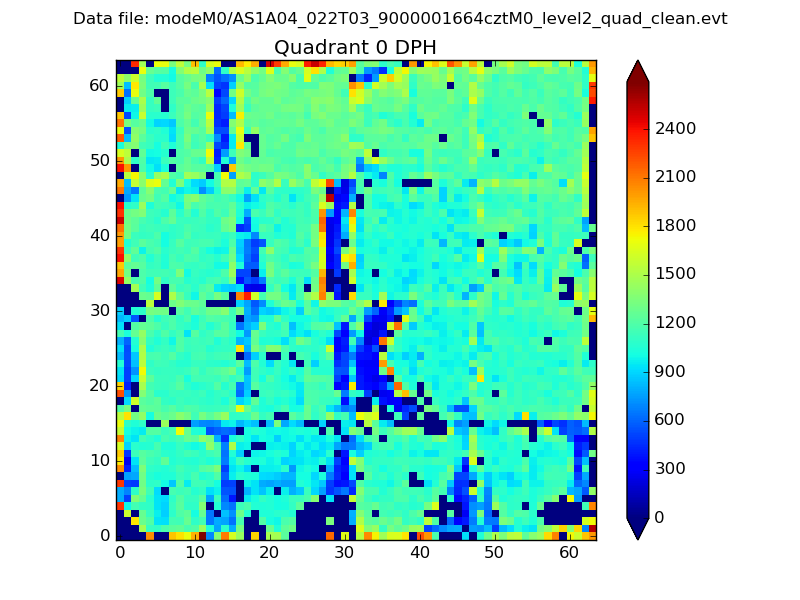 |
 |
Quadrant B |
|---|---|---|---|
| Quadrant D |  |
 |
Quadrant C |
| Plot type | Count rate plots | Images |
|---|---|---|
| Comparison with Poisson distribution Blue bars denote a histogram of data divided into 1 sec bins. Red curve is a Poisson curve with rate = median count rate of data. |
 |
 |
| Quadrant-wise count rates Data is divided into 100 sec bins |
 |
|
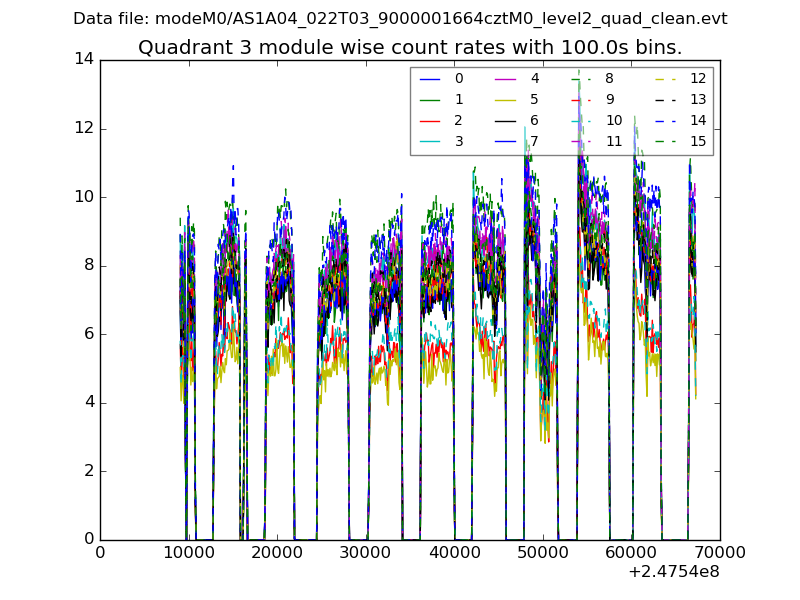
| Module-wise count rates for Quadrant A Data is divided into 100 sec bins |
 |
 |
| Module-wise count rates for Quadrant B Data is divided into 100 sec bins |
 |
 |
| Module-wise count rates for Quadrant C Data is divided into 100 sec bins |
 |
 |
| Module-wise count rates for Quadrant D Data is divided into 100 sec bins |
 |
 |
| Parameter | Plot |
|---|---|
| CZT HV Monitor | 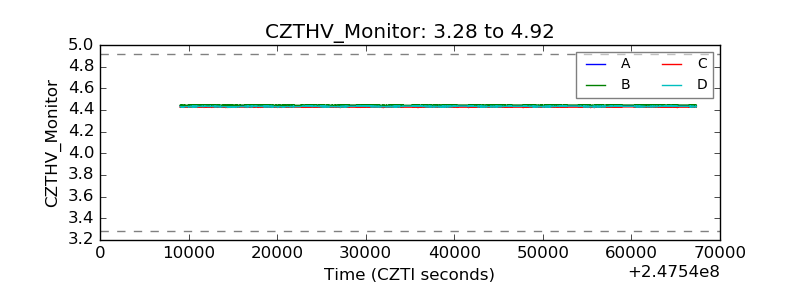 |
| D_VDD |  |
| Temperature 1 | 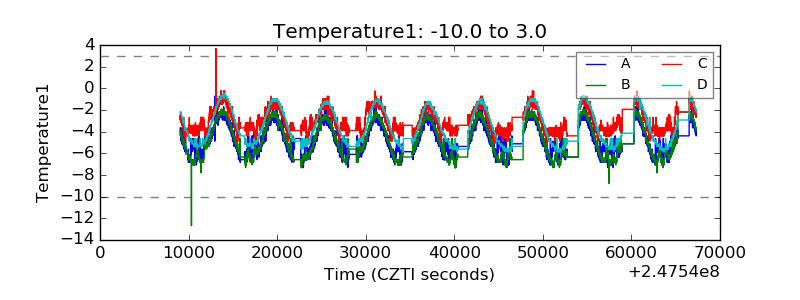 |
| Veto HV Monitor | 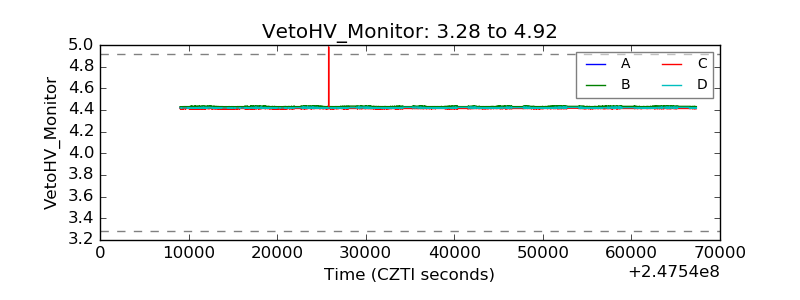 |
| Veto LLD | 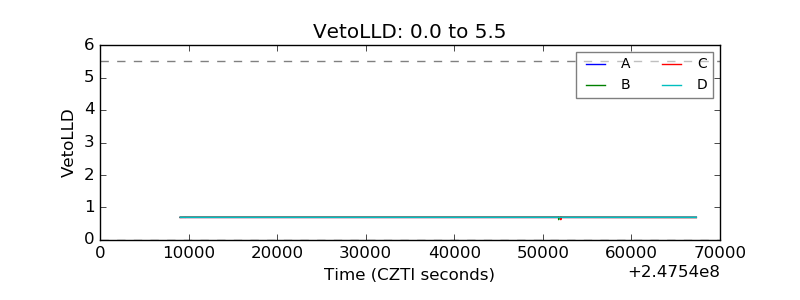 |
| Alpha Counter |  |
| _CPM_Rate | 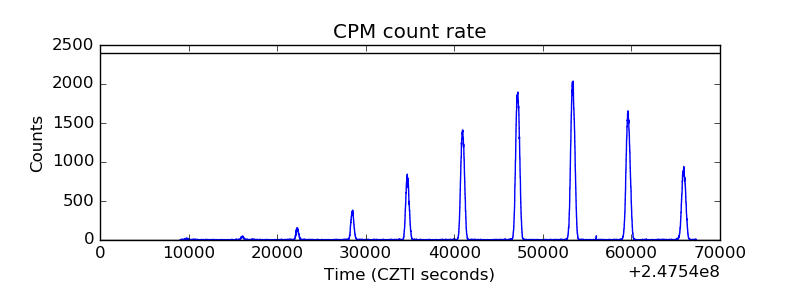 |
| CZT Counter |  |
| +2.5 Volts monitor | 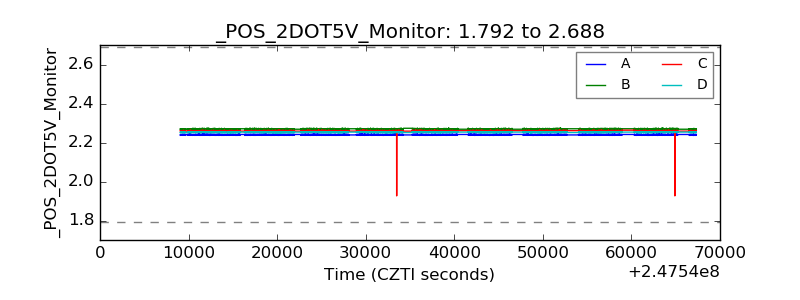 |
| +5 Volts monitor |  |
| _ROLL_ROT |  |
| _Roll_DEC | 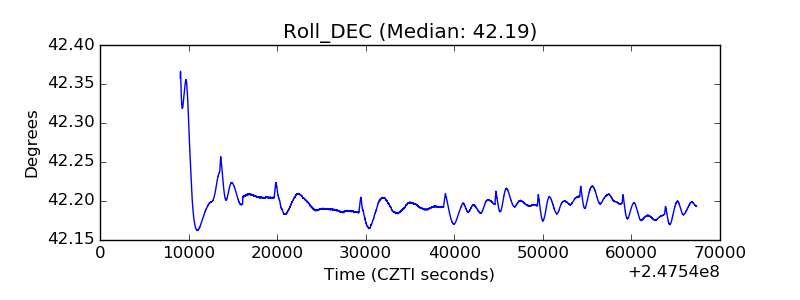 |
| _Roll_RA |  |
| Veto Counter |  |