| Param | Original file | Final file |
|---|---|---|
| Filename | modeM0/AS1A04_022T03_9000001664_11382cztM0_level2.evt | modeM0/AS1A04_022T03_9000001664_11382cztM0_level2_quad_clean.evt |
| Size (bytes) | 221,774,400 | 29,914,560 |
| Size | 211.5 MB | 28.5 MB |
| Events in quadrant A | 1,626,622 | 177,989 |
| Events in quadrant B | 1,509,546 | 180,804 |
| Events in quadrant C | 1,125,798 | 204,538 |
| Events in quadrant D | 2,293,387 | 172,826 |
| Mode M9 | |||
|---|---|---|---|
| Quadrant | BADHDUFLAG | Total packets | Discarded packets |
| A | 0 | 2 | 0 |
| B | 0 | 2 | 0 |
| C | 0 | 2 | 0 |
| D | 0 | 2 | 0 |
| Mode M0 | |||
|---|---|---|---|
| Quadrant | BADHDUFLAG | Total packets | Discarded packets |
| A | 0 | 6410 | 2 |
| B | 0 | 6073 | 1 |
| C | 0 | 4971 | 1 |
| D | 0 | 8449 | 1 |
| Mode SS | |||
|---|---|---|---|
| Quadrant | BADHDUFLAG | Total packets | Discarded packets |
| A | 0 | 50 | 0 |
| B | 0 | 50 | 0 |
| C | 0 | 50 | 0 |
| D | 0 | 50 | 0 |
| Quadrant | Total seconds | Saturated seconds | Saturation percentage |
|---|---|---|---|
| A | 2340 | 205 | 8.760684% |
| B | 2340 | 231 | 9.871795% |
| C | 2340 | 49 | 2.094017% |
| D | 2340 | 298 | 12.735043% |
Noise dominated data is calculated using 1-second bins in cleaned event files. If a bin has >2000 counts, and if more than 50% of those come from <1% of pixels, then it is considered to be noise-dominated and hence unusable.
| Quadrant | # 1 sec bins | Bins with >0 counts | Bins with >2000 counts | High rate bins dominated by noise | Noise dominated (total time) | Noise dominated (detector-on time) | Marked lightcurve |
|---|---|---|---|---|---|---|---|
| A | 2540 | 2341 | 75 | 75 | 2.95% | 3.20% | 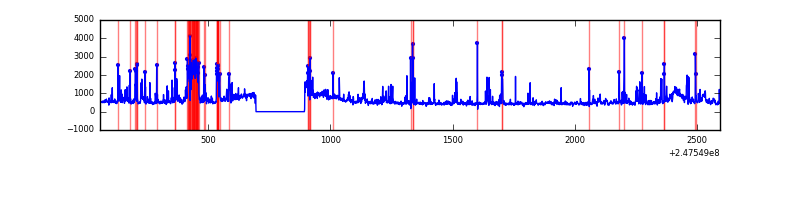 |
| B | 2540 | 2341 | 57 | 57 | 2.24% | 2.43% | 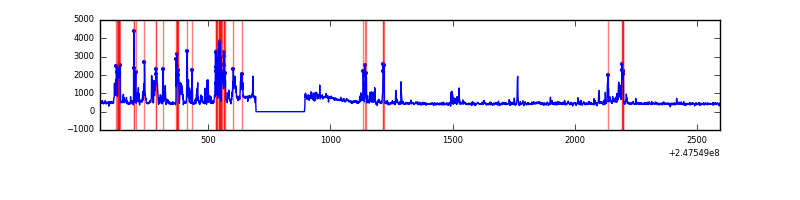 |
| C | 2540 | 2341 | 0 | 0 | 0.00% | 0.00% | 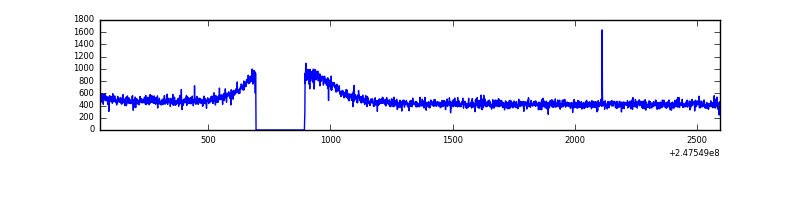 |
| D | 2540 | 2340 | 179 | 179 | 7.05% | 7.65% | 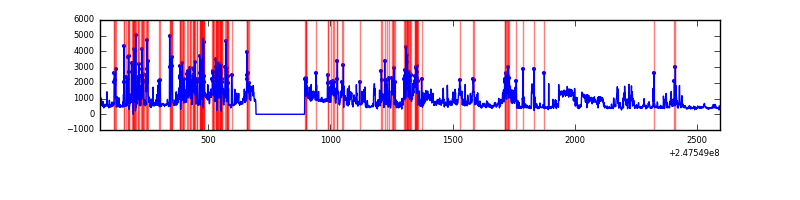 |
Top three noisy pixels from each quadrant. If the there are fewer than three noisy pixels in the level2.evt file, extra rows are filled as -1
| Pixel properties | Quadrant properties | ||||||
|---|---|---|---|---|---|---|---|
| Quadrant | DetID | PixID | Counts | Sigma | Mean | Median | Sigma |
| A | 8 | 5 | 513408 | 8743.77 | 274 | 267 | 58.7 |
| A | 13 | 210 | 19357 | 325.29 | 274 | 267 | 58.7 |
| A | 8 | 6 | 14058 | 234.99 | 274 | 267 | 58.7 |
| B | 4 | 239 | 381228 | 6841.47 | 278 | 269 | 55.7 |
| B | 3 | 64 | 15157 | 267.37 | 278 | 269 | 55.7 |
| B | 3 | 189 | 12133 | 213.06 | 278 | 269 | 55.7 |
| C | 13 | 61 | 2071 | 25.57 | 287 | 288 | 69.7 |
| C | 12 | 4 | 2057 | 25.37 | 287 | 288 | 69.7 |
| C | 8 | 128 | 1080 | 11.36 | 287 | 288 | 69.7 |
| D | 14 | 34 | 646786 | 9914.24 | 264 | 256 | 65.2 |
| D | 1 | 52 | 342390 | 5246.47 | 264 | 256 | 65.2 |
| D | 10 | 253 | 104975 | 1605.82 | 264 | 256 | 65.2 |
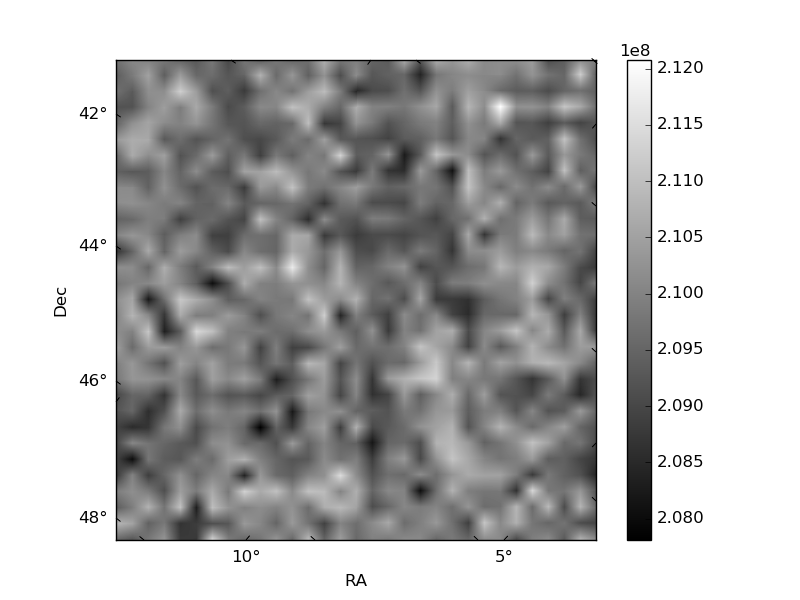
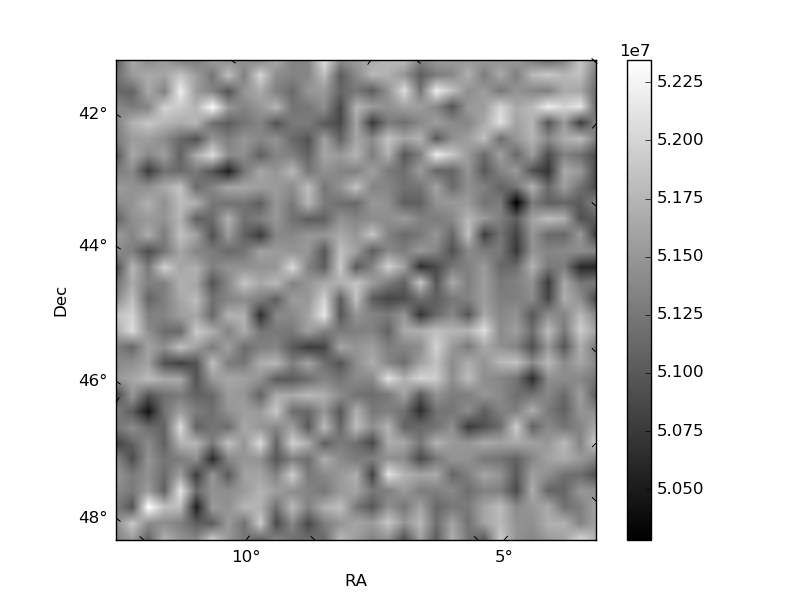
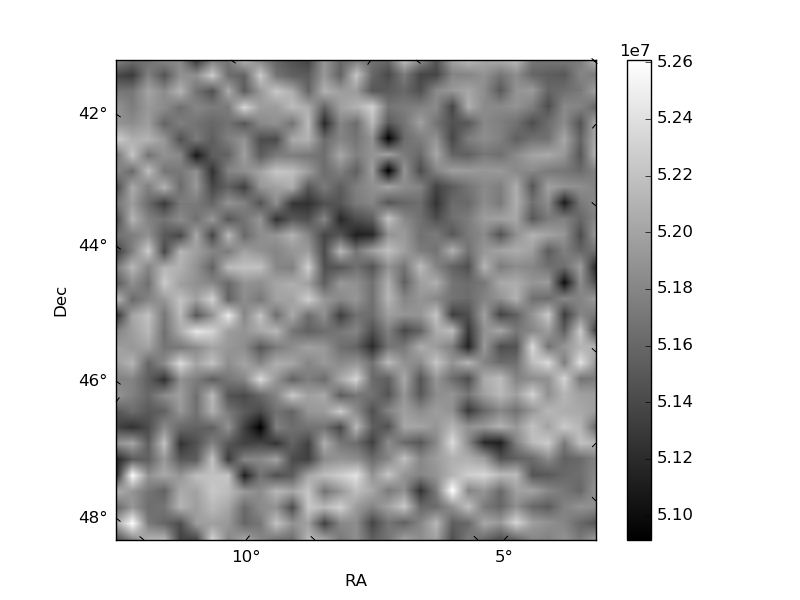
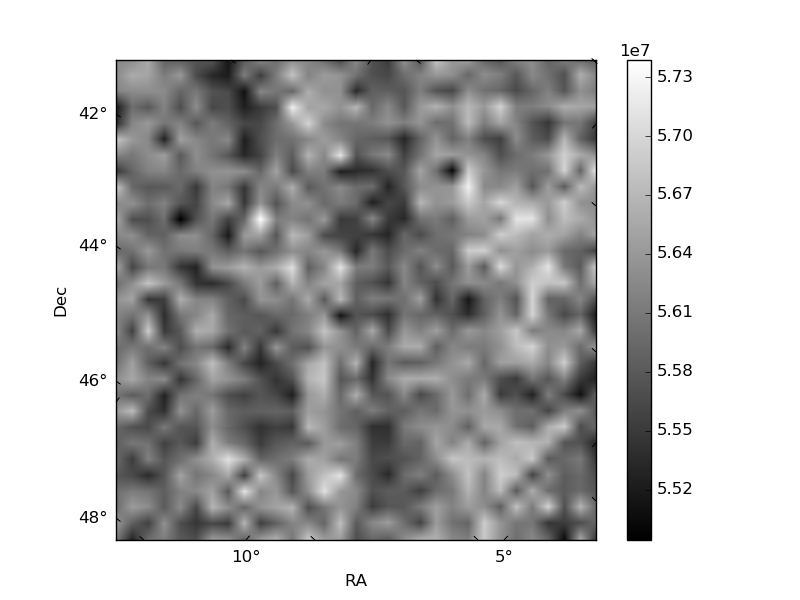
Histogram calculated using DETX and DETY for each event in the final _common_clean file
| Quadrant A | 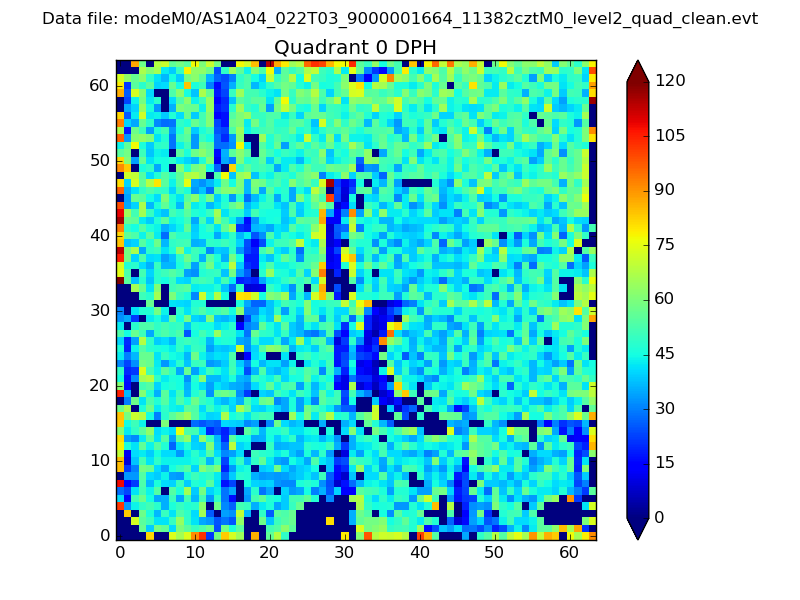 |
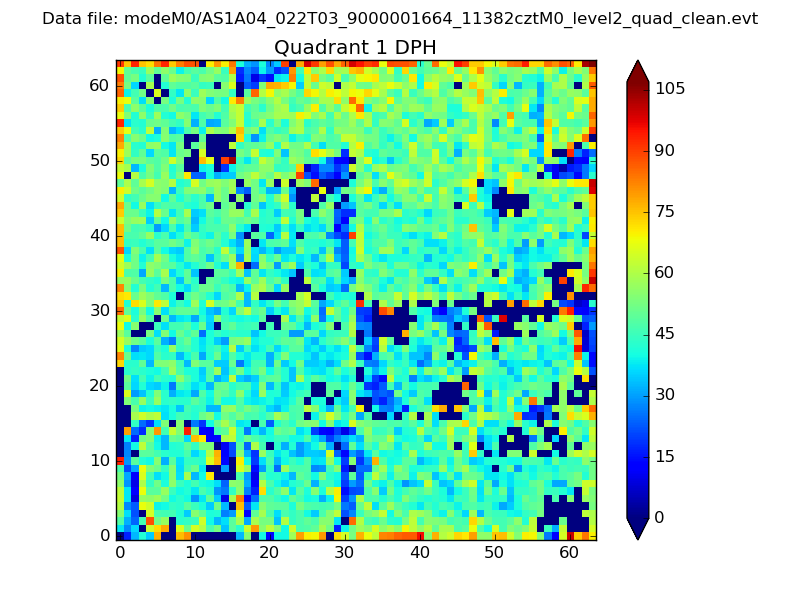 |
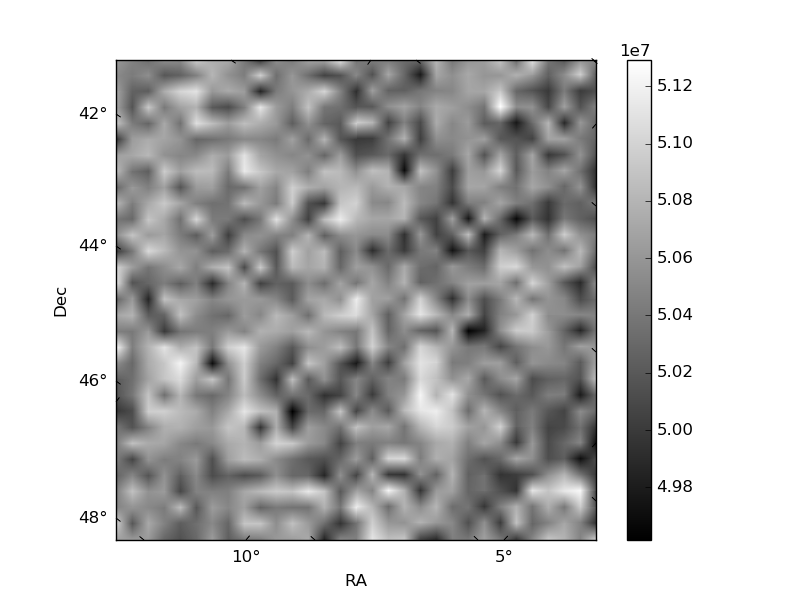
Quadrant B |
|---|---|---|---|
| Quadrant D | 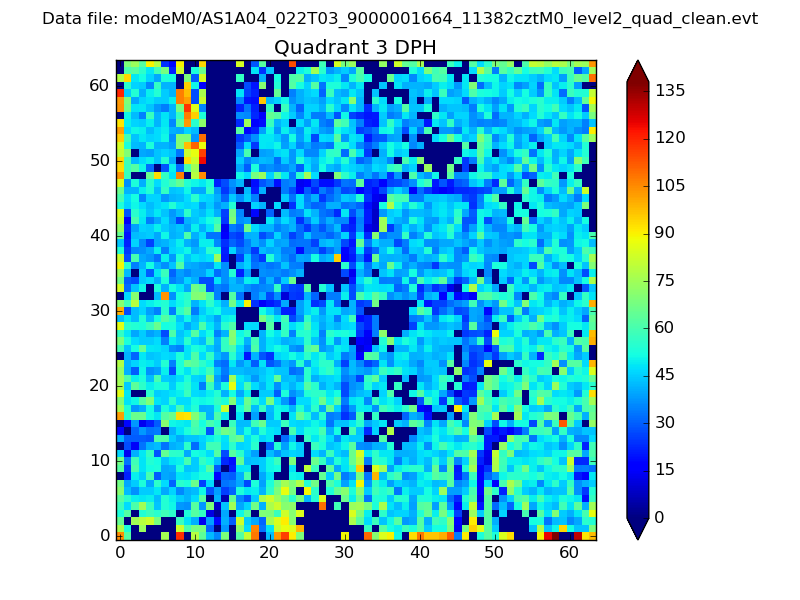 |
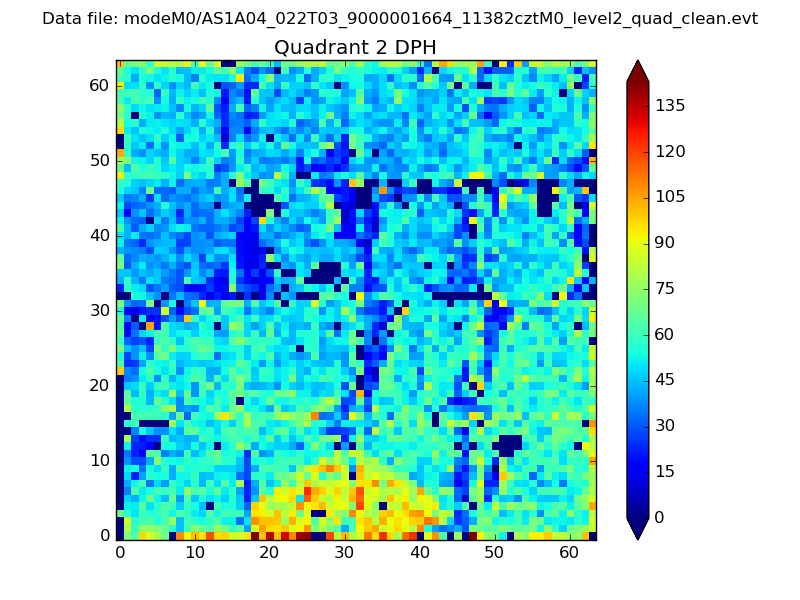 |
Quadrant C |
| Plot type | Count rate plots | Images |
|---|---|---|
| Comparison with Poisson distribution Blue bars denote a histogram of data divided into 1 sec bins. Red curve is a Poisson curve with rate = median count rate of data. |
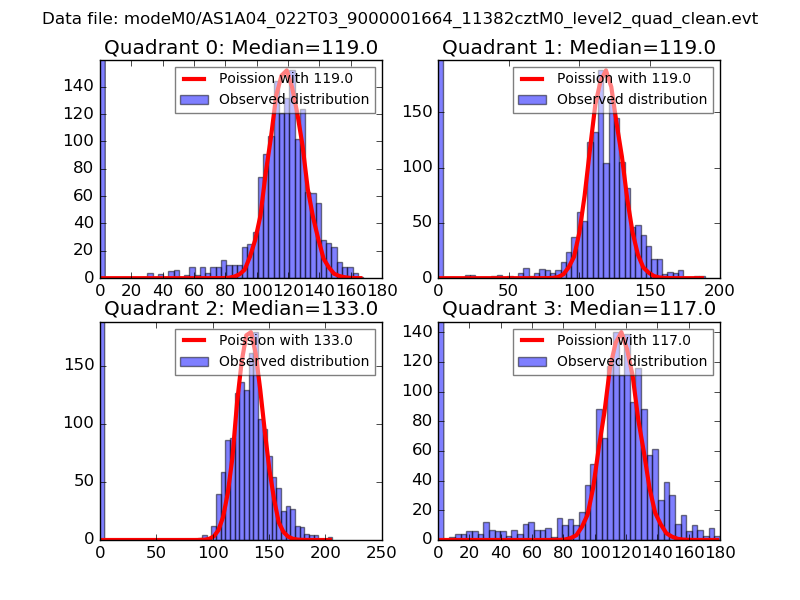 |
 |
| Quadrant-wise count rates Data is divided into 100 sec bins |
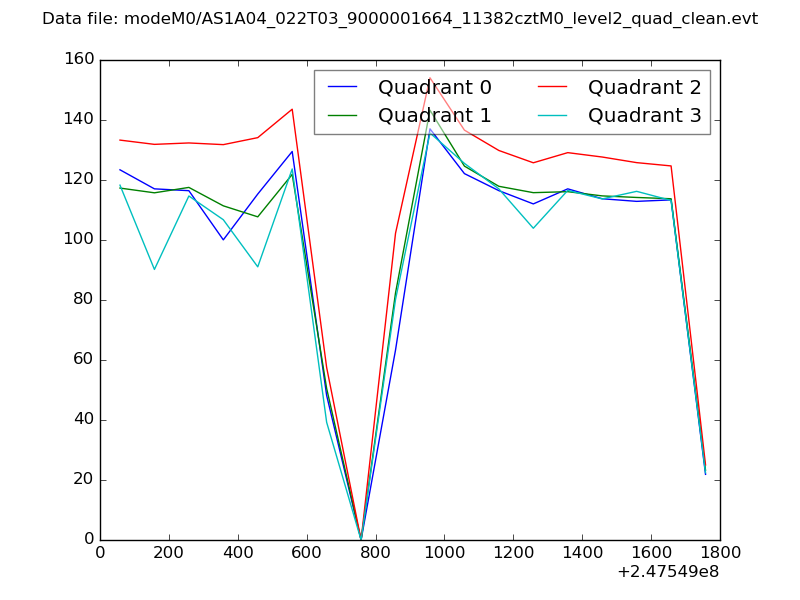 |
|
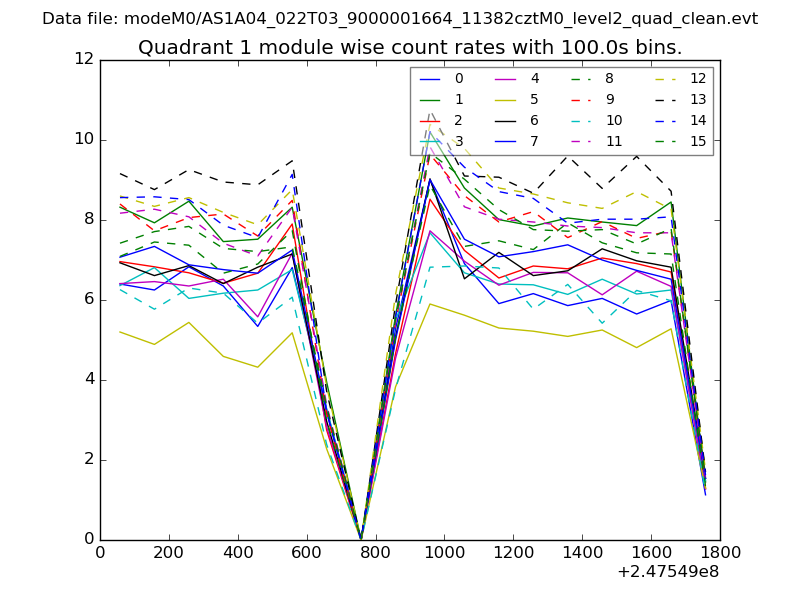
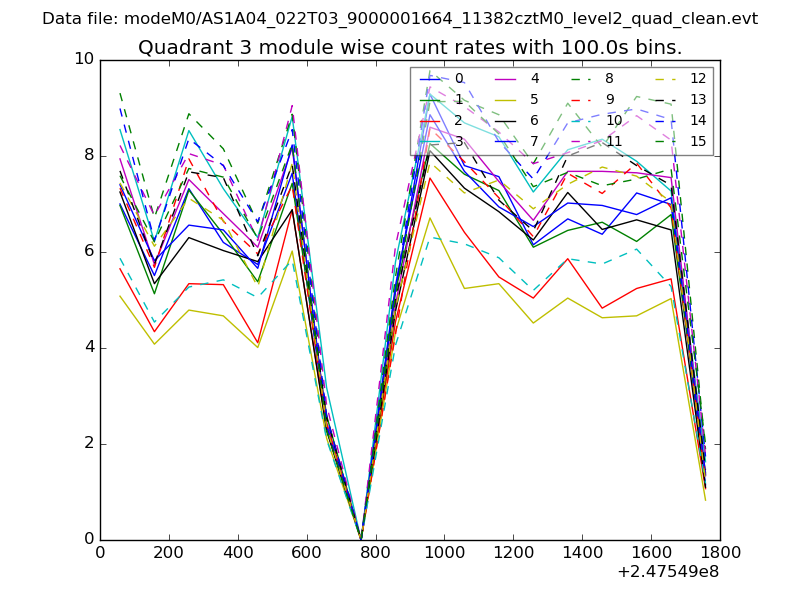
| Module-wise count rates for Quadrant A Data is divided into 100 sec bins |
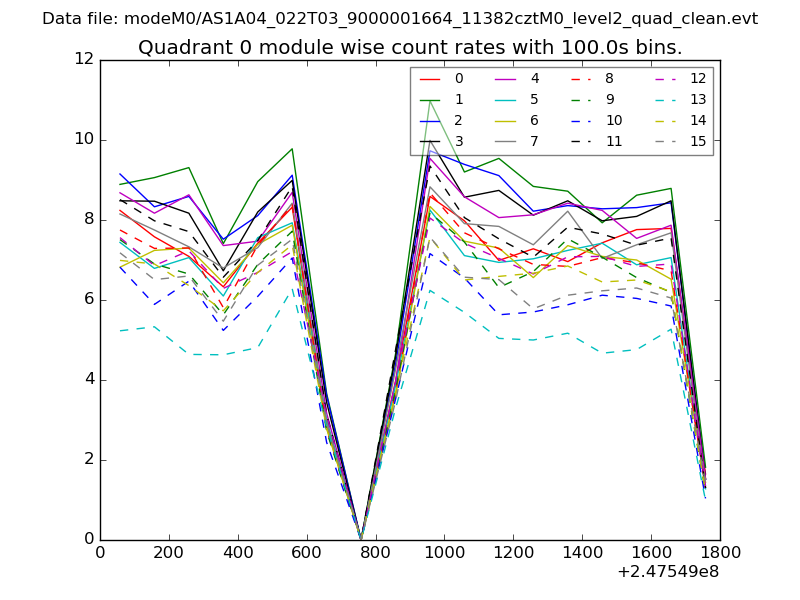 |
 |
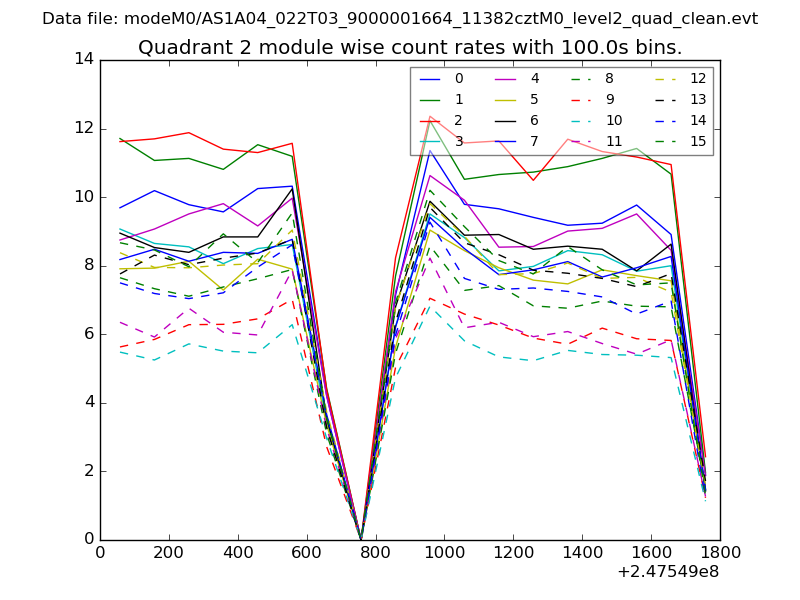
| Module-wise count rates for Quadrant B Data is divided into 100 sec bins |
 |
 |
| Module-wise count rates for Quadrant C Data is divided into 100 sec bins |
 |
 |
| Module-wise count rates for Quadrant D Data is divided into 100 sec bins |
 |
 |
| Parameter | Plot |
|---|---|
| CZT HV Monitor | 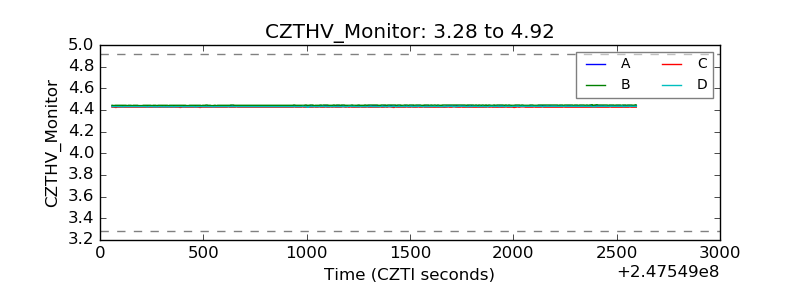 |
| D_VDD | 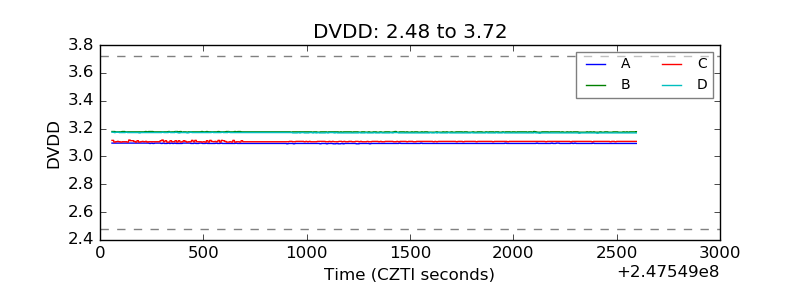 |
| Temperature 1 | 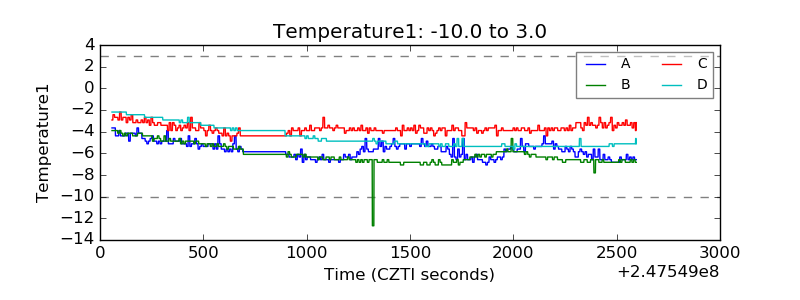 |
| Veto HV Monitor | 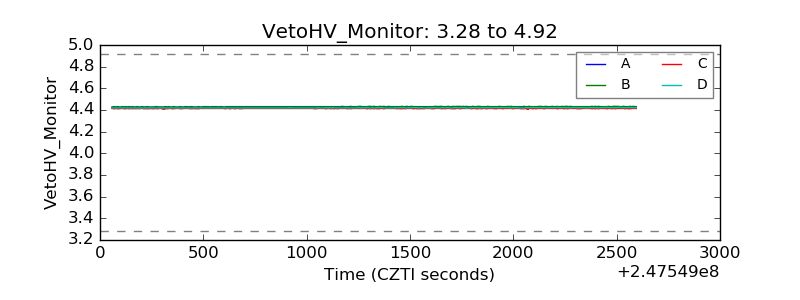 |
| Veto LLD | 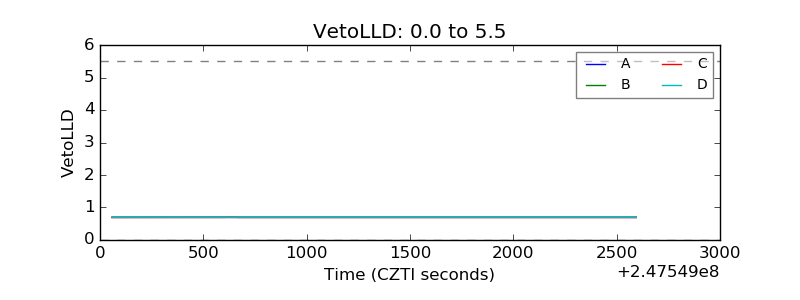 |
| Alpha Counter | 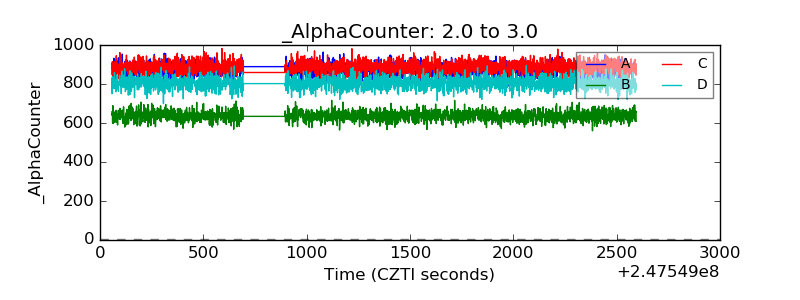 |
| _CPM_Rate | 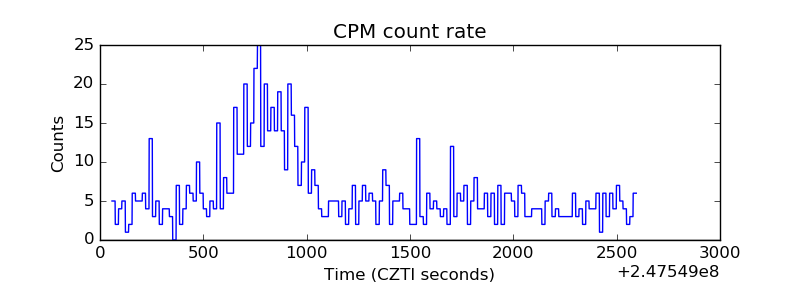 |
| CZT Counter | 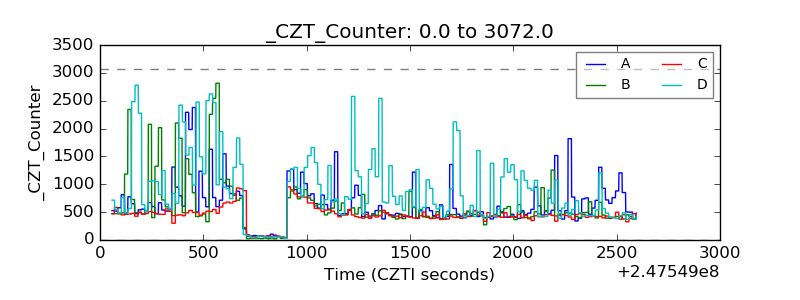 |
| +2.5 Volts monitor |  |
| +5 Volts monitor |  |
| _ROLL_ROT | 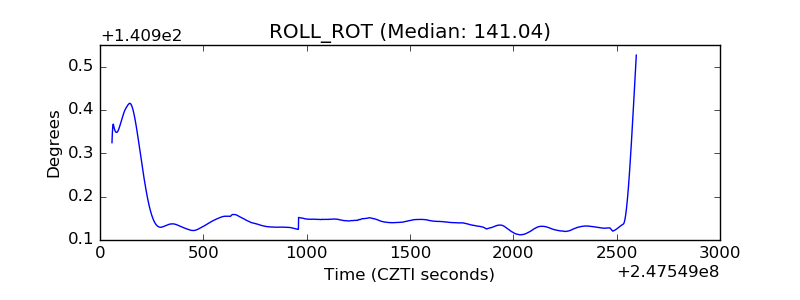 |
| _Roll_DEC | 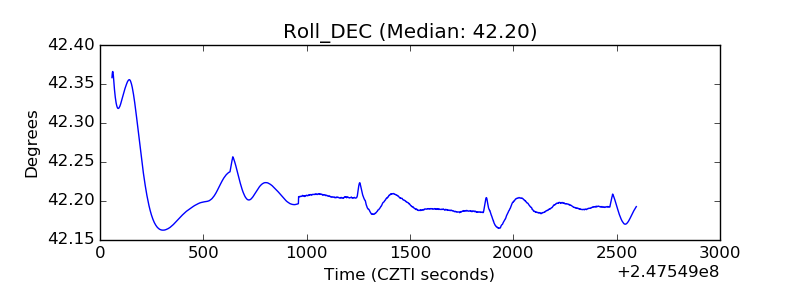 |
| _Roll_RA | 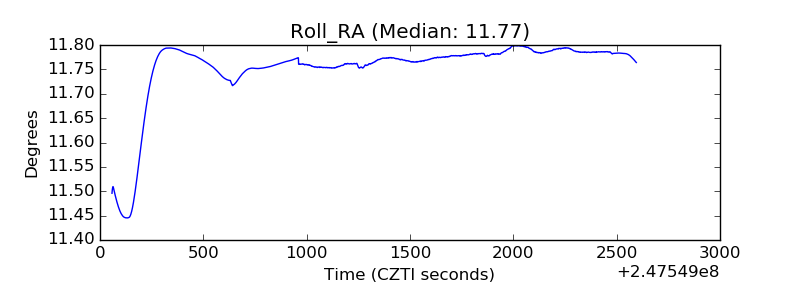 |
| Veto Counter | 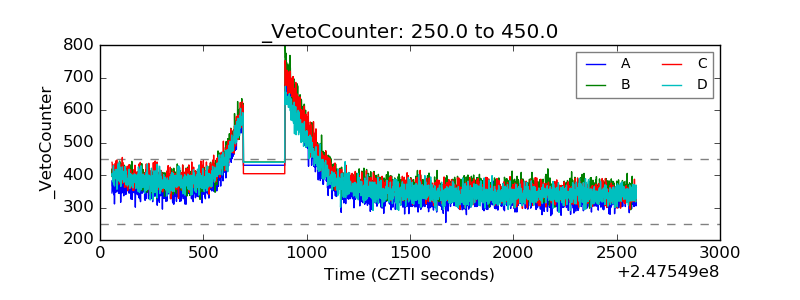 |