| Param | Original file | Final file |
|---|---|---|
| Filename | modeM0/AS1A04_022T03_9000001664_11388cztM0_level2.evt | modeM0/AS1A04_022T03_9000001664_11388cztM0_level2_quad_clean.evt |
| Size (bytes) | 615,971,520 | 88,770,240 |
| Size | 587.4 MB | 84.7 MB |
| Events in quadrant A | 3,227,764 | 579,884 |
| Events in quadrant B | 6,697,861 | 479,394 |
| Events in quadrant C | 3,144,626 | 609,705 |
| Events in quadrant D | 5,136,664 | 557,585 |
| Mode M9 | |||
|---|---|---|---|
| Quadrant | BADHDUFLAG | Total packets | Discarded packets |
| A | 0 | 19 | 0 |
| B | 0 | 19 | 0 |
| C | 0 | 19 | 0 |
| D | 0 | 20 | 0 |
| Mode M0 | |||
|---|---|---|---|
| Quadrant | BADHDUFLAG | Total packets | Discarded packets |
| A | 0 | 13949 | 3 |
| B | 0 | 24184 | 2 |
| C | 0 | 13644 | 2 |
| D | 0 | 19724 | 2 |
| Mode SS | |||
|---|---|---|---|
| Quadrant | BADHDUFLAG | Total packets | Discarded packets |
| A | 0 | 134 | 0 |
| B | 0 | 134 | 0 |
| C | 0 | 134 | 0 |
| D | 0 | 134 | 0 |
| Quadrant | Total seconds | Saturated seconds | Saturation percentage |
|---|---|---|---|
| A | 6612 | 90 | 1.361162% |
| B | 6612 | 1363 | 20.614035% |
| C | 6612 | 63 | 0.952813% |
| D | 6612 | 401 | 6.064731% |
Noise dominated data is calculated using 1-second bins in cleaned event files. If a bin has >2000 counts, and if more than 50% of those come from <1% of pixels, then it is considered to be noise-dominated and hence unusable.
| Quadrant | # 1 sec bins | Bins with >0 counts | Bins with >2000 counts | High rate bins dominated by noise | Noise dominated (total time) | Noise dominated (detector-on time) | Marked lightcurve |
|---|---|---|---|---|---|---|---|
| A | 7727 | 6612 | 1 | 1 | 0.01% | 0.02% | 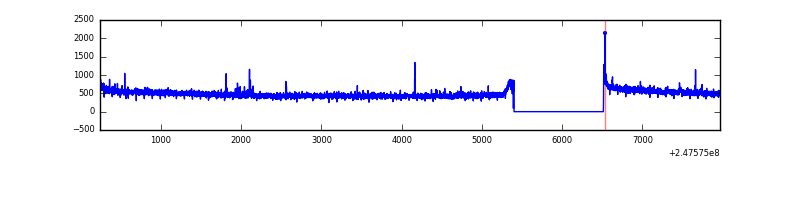 |
| B | 7727 | 6613 | 1083 | 1083 | 14.02% | 16.38% | 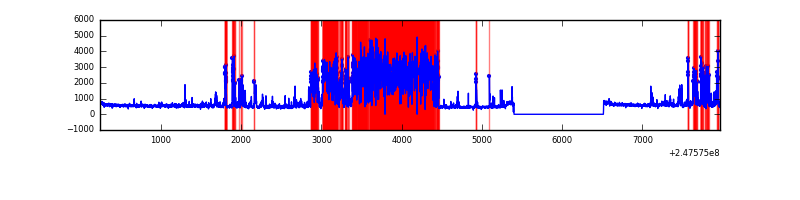 |
| C | 7727 | 6613 | 0 | 0 | 0.00% | 0.00% | 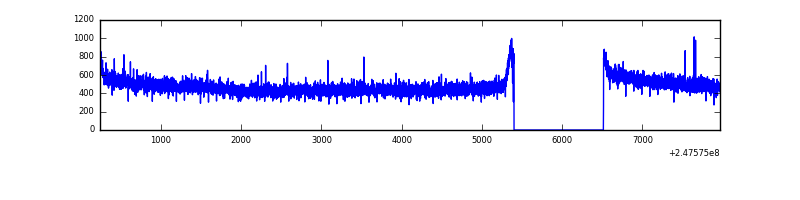 |
| D | 7727 | 6613 | 271 | 271 | 3.51% | 4.10% | 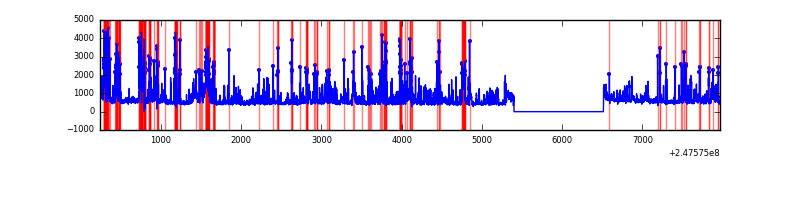 |
Top three noisy pixels from each quadrant. If the there are fewer than three noisy pixels in the level2.evt file, extra rows are filled as -1
| Pixel properties | Quadrant properties | ||||||
|---|---|---|---|---|---|---|---|
| Quadrant | DetID | PixID | Counts | Sigma | Mean | Median | Sigma |
| A | 8 | 5 | 30415 | 177.56 | 825 | 809 | 166.7 |
| A | 0 | 226 | 7689 | 41.26 | 825 | 809 | 166.7 |
| A | 13 | 210 | 7508 | 40.18 | 825 | 809 | 166.7 |
| B | 4 | 81 | 2472489 | 17563.24 | 737 | 720 | 140.7 |
| B | 4 | 239 | 1115298 | 7919.67 | 737 | 720 | 140.7 |
| B | 11 | 51 | 106258 | 749.9 | 737 | 720 | 140.7 |
| C | 13 | 61 | 5772 | 26.51 | 805 | 810 | 187.1 |
| C | 14 | 234 | 3392 | 13.8 | 805 | 810 | 187.1 |
| C | 12 | 4 | 2167 | 7.25 | 805 | 810 | 187.1 |
| D | 1 | 52 | 789579 | 4204.18 | 784 | 764 | 187.6 |
| D | 10 | 253 | 542481 | 2887.21 | 784 | 764 | 187.6 |
| D | 2 | 14 | 334493 | 1778.69 | 784 | 764 | 187.6 |
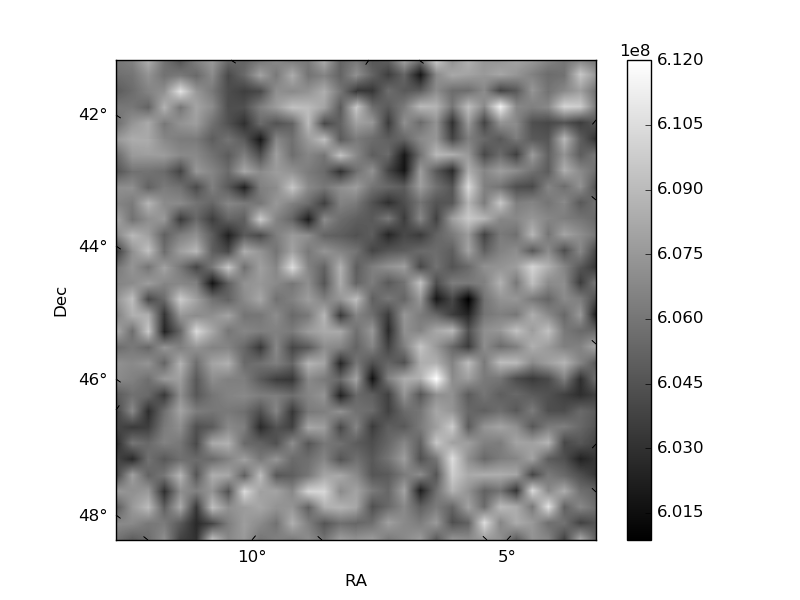
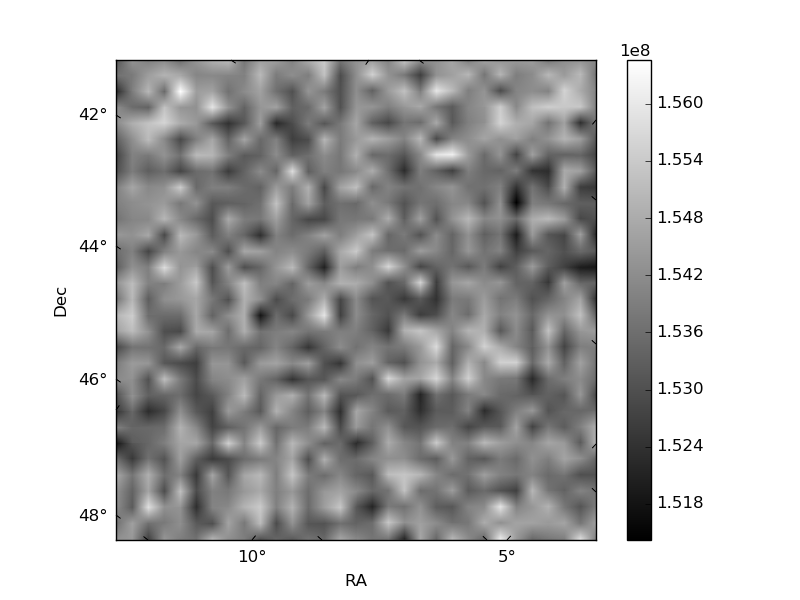
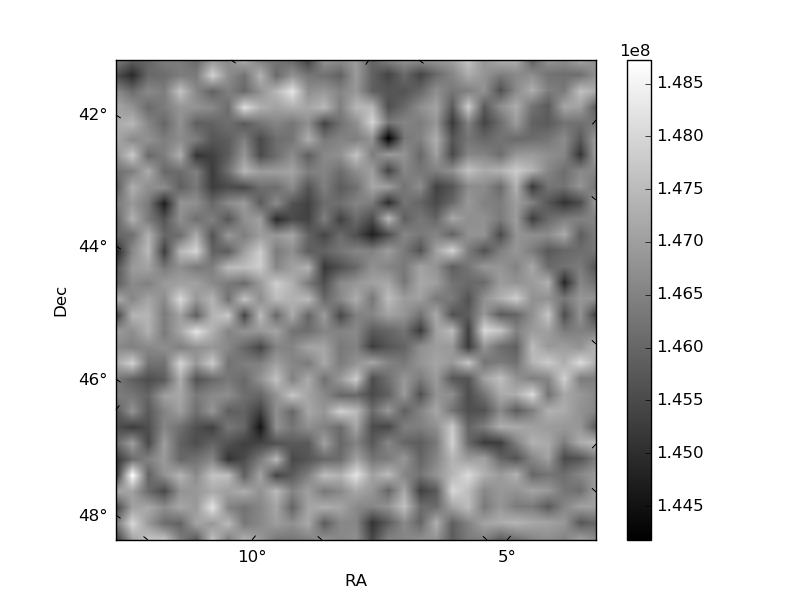
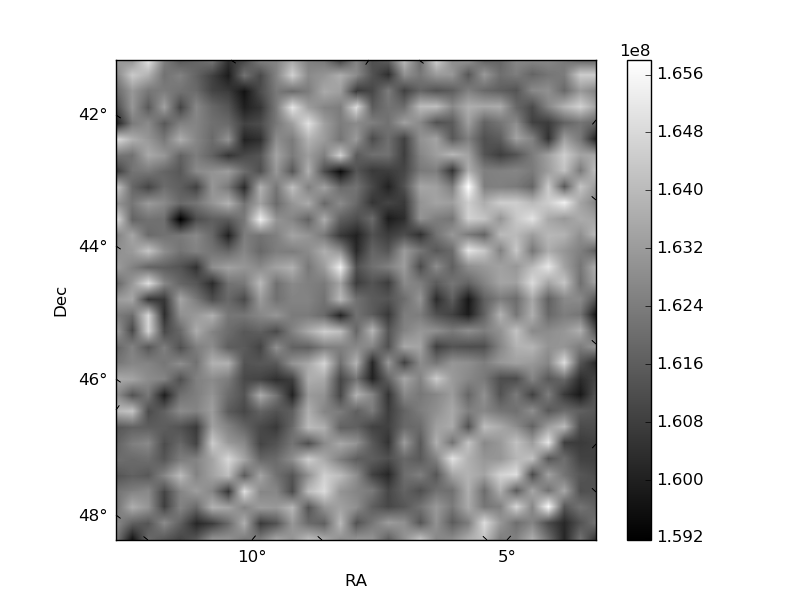
Histogram calculated using DETX and DETY for each event in the final _common_clean file
| Quadrant A | 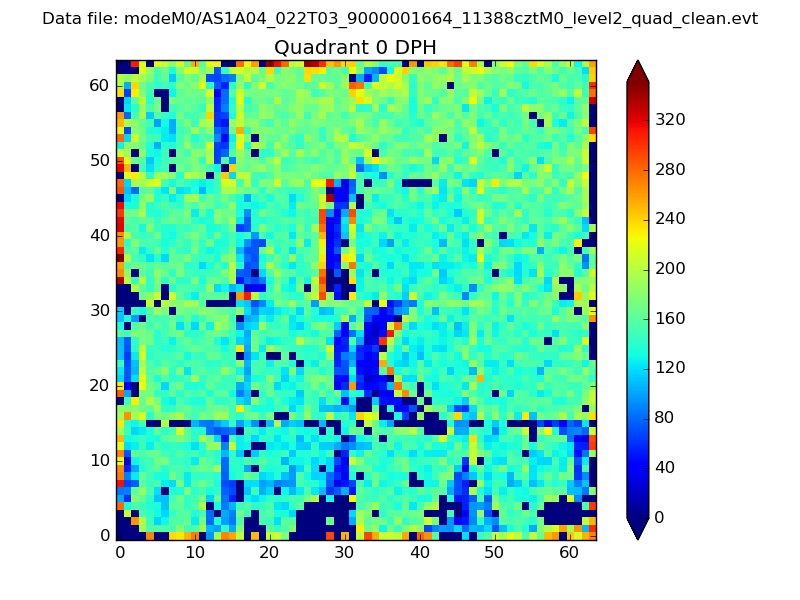 |
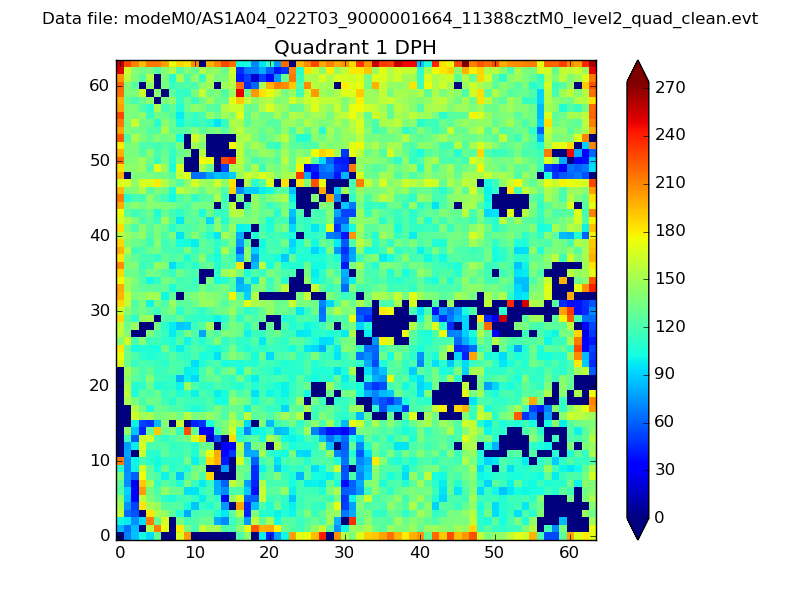 |
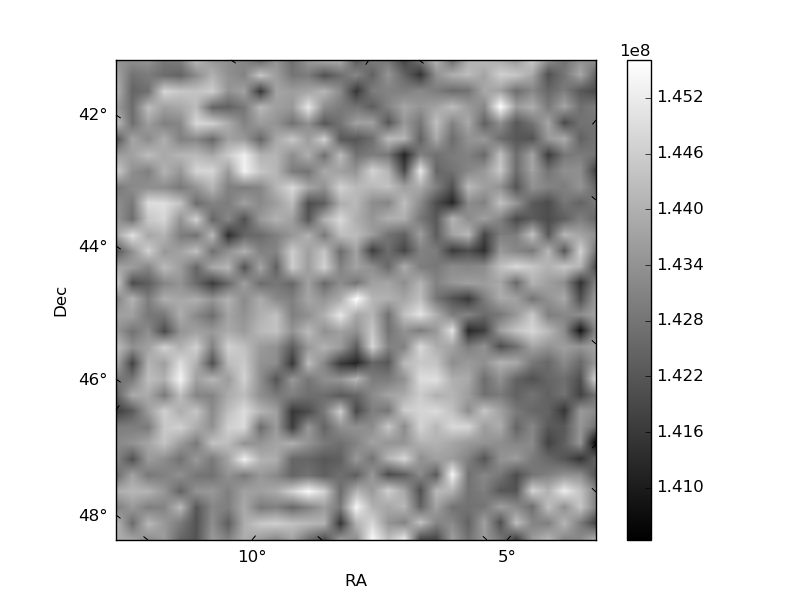
Quadrant B |
|---|---|---|---|
| Quadrant D | 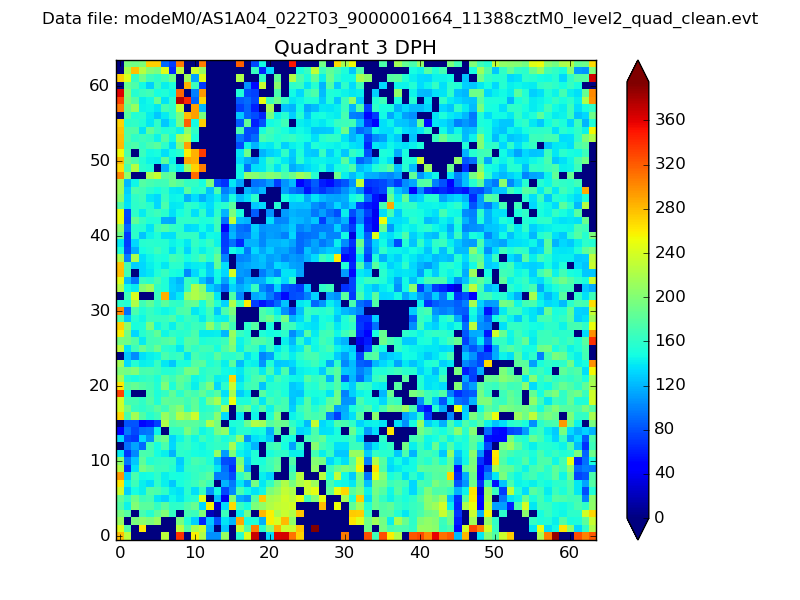 |
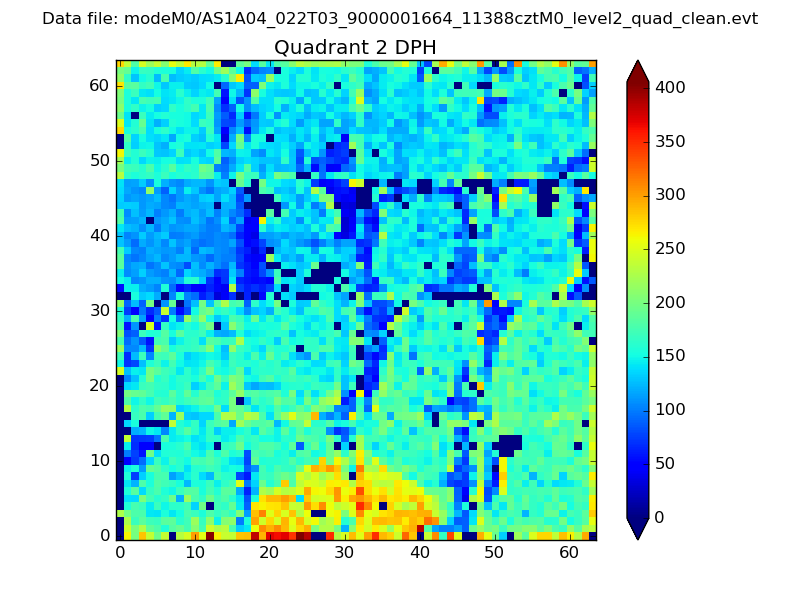 |
Quadrant C |
| Plot type | Count rate plots | Images |
|---|---|---|
| Comparison with Poisson distribution Blue bars denote a histogram of data divided into 1 sec bins. Red curve is a Poisson curve with rate = median count rate of data. |
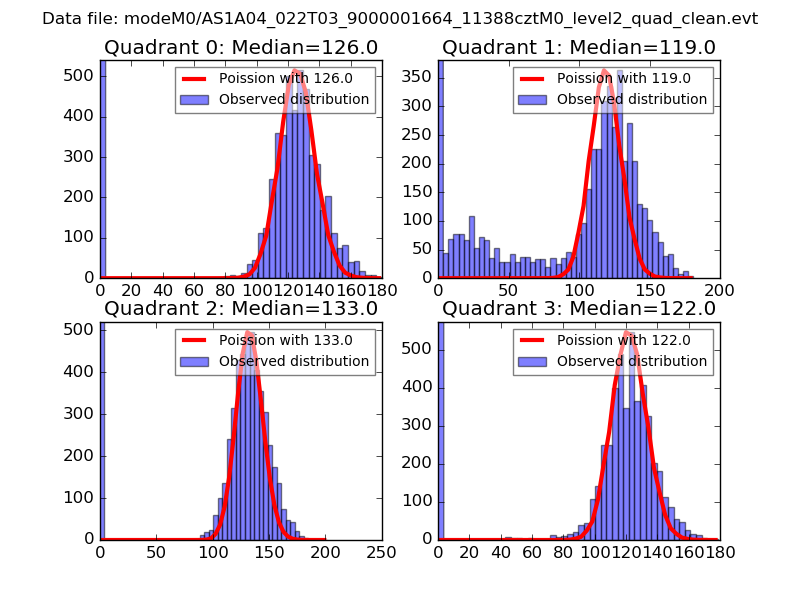 |
 |
| Quadrant-wise count rates Data is divided into 100 sec bins |
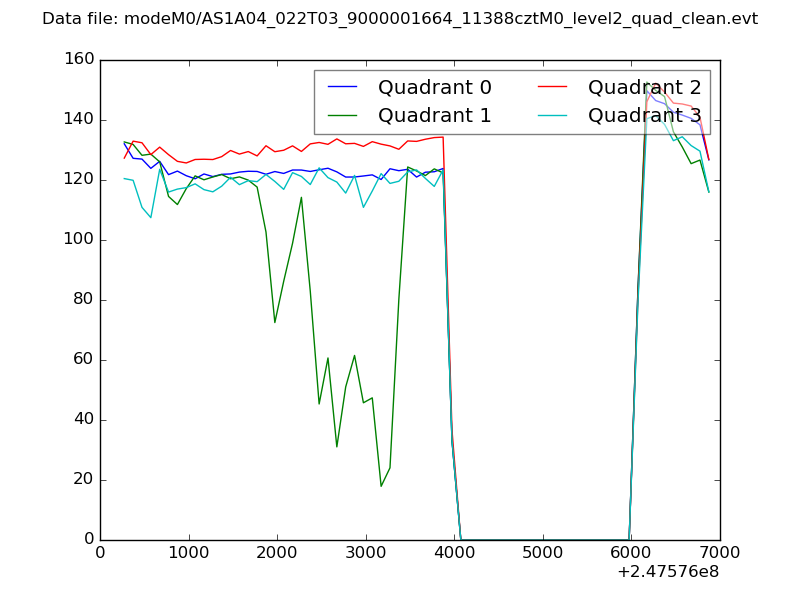 |
|
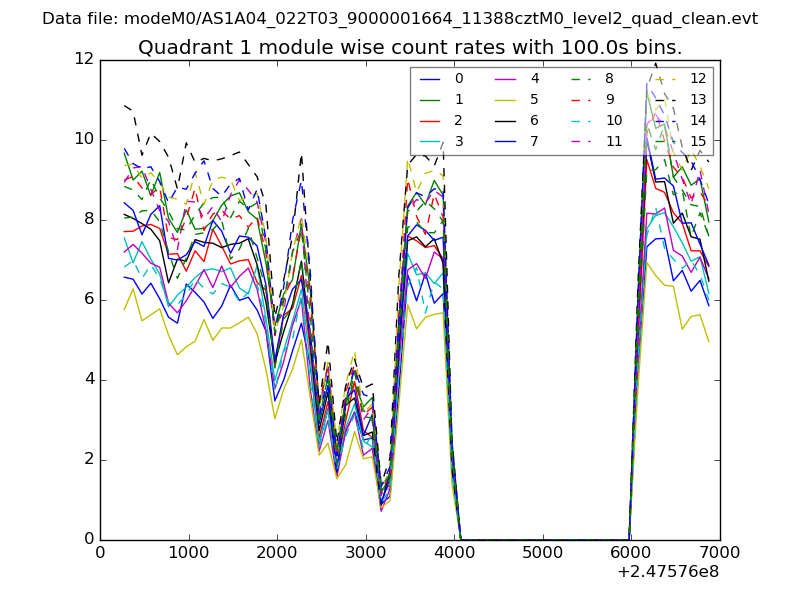
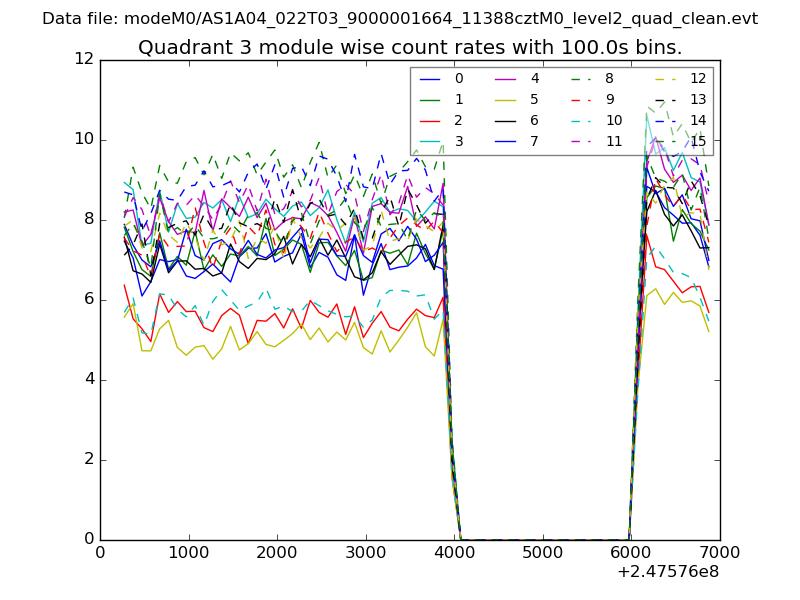
| Module-wise count rates for Quadrant A Data is divided into 100 sec bins |
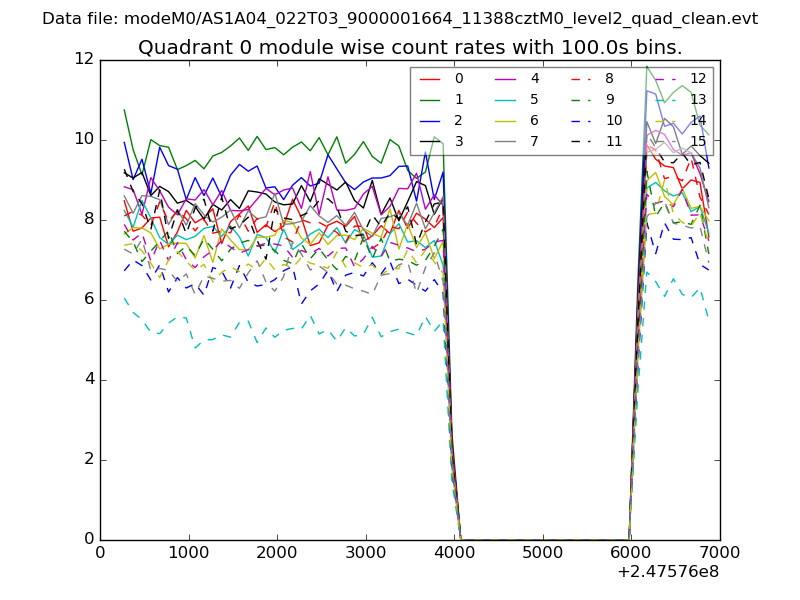 |
 |
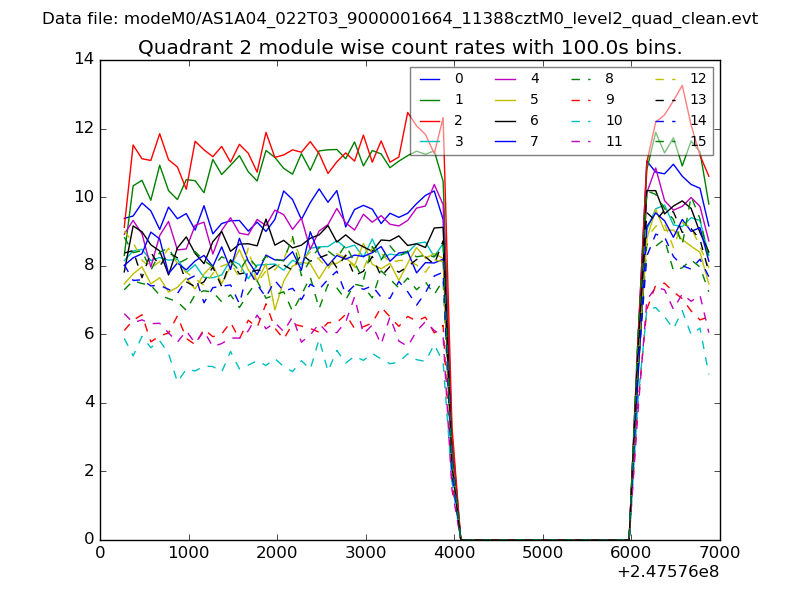
| Module-wise count rates for Quadrant B Data is divided into 100 sec bins |
 |
 |
| Module-wise count rates for Quadrant C Data is divided into 100 sec bins |
 |
 |
| Module-wise count rates for Quadrant D Data is divided into 100 sec bins |
 |
 |
| Parameter | Plot |
|---|---|
| CZT HV Monitor | 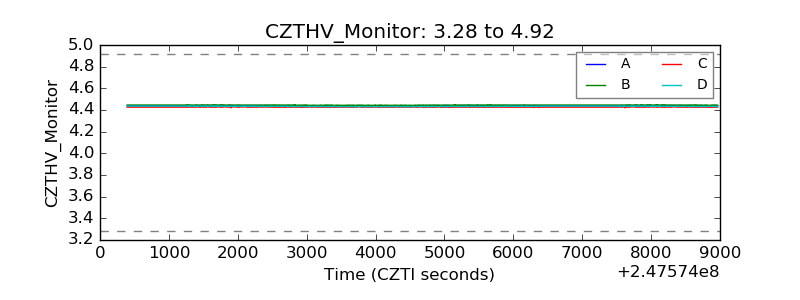 |
| D_VDD |  |
| Temperature 1 | 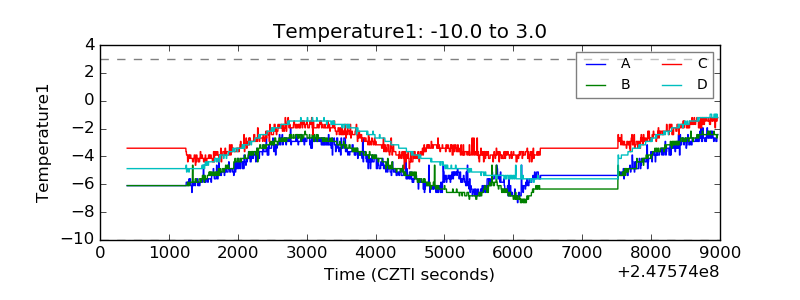 |
| Veto HV Monitor | 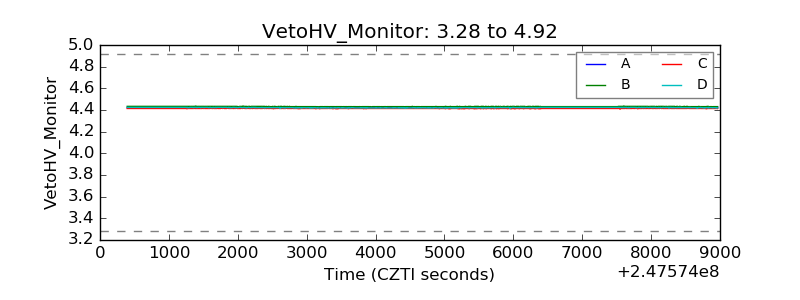 |
| Veto LLD | 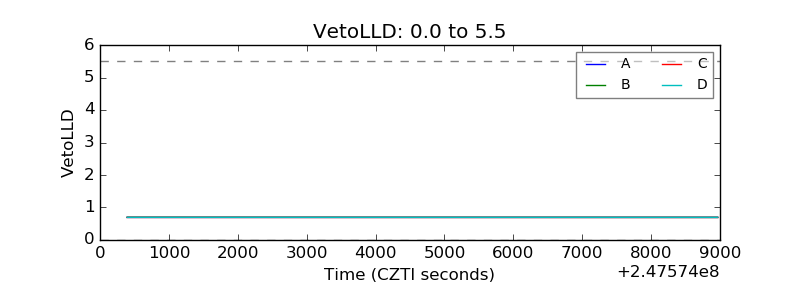 |
| Alpha Counter | 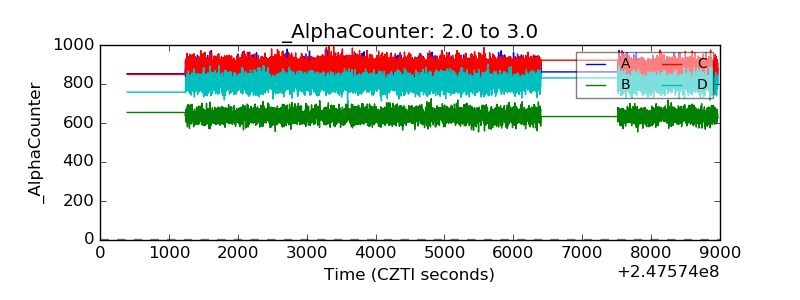 |
| _CPM_Rate | 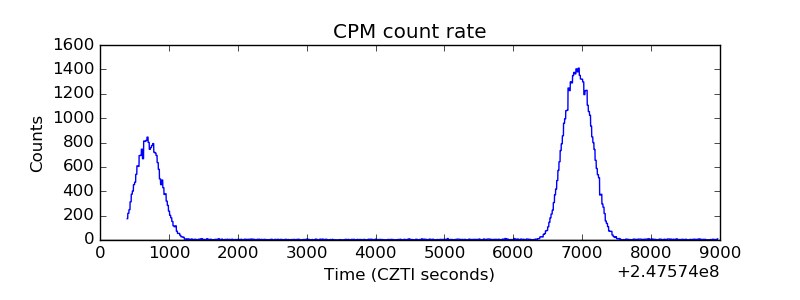 |
| CZT Counter | 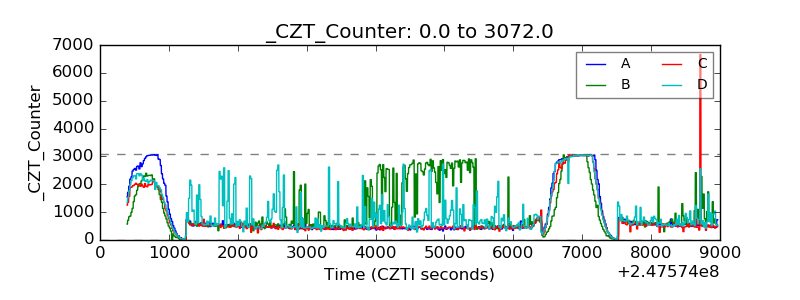 |
| +2.5 Volts monitor | 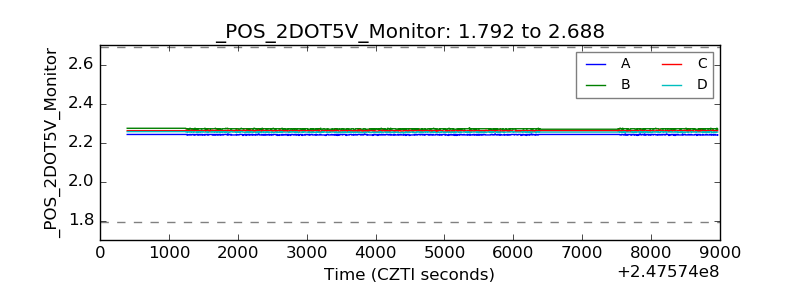 |
| +5 Volts monitor |  |
| _ROLL_ROT | 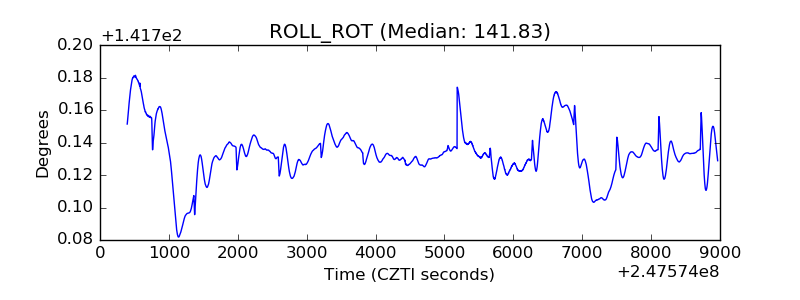 |
| _Roll_DEC | 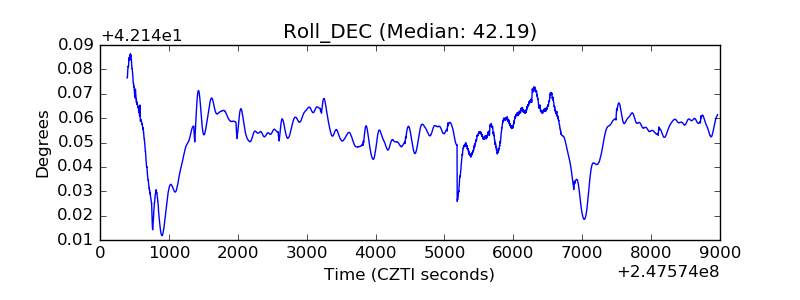 |
| _Roll_RA | 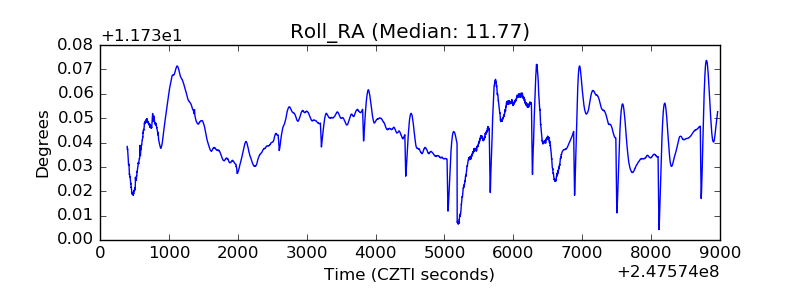 |
| Veto Counter | 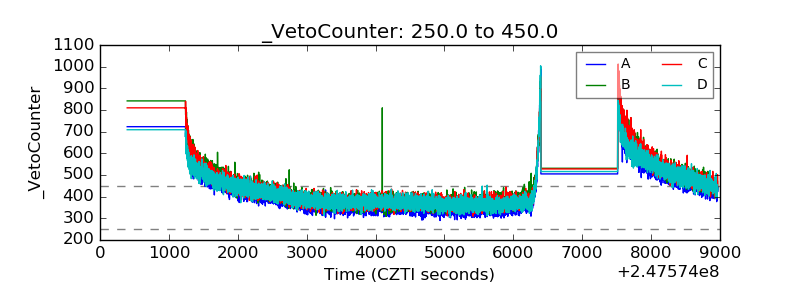 |