| Param | Original file | Final file |
|---|---|---|
| Filename | modeM0/AS1A04_022T03_9000001664_11389cztM0_level2.evt | modeM0/AS1A04_022T03_9000001664_11389cztM0_level2_quad_clean.evt |
| Size (bytes) | 541,800,000 | 103,239,360 |
| Size | 516.7 MB | 98.5 MB |
| Events in quadrant A | 3,208,376 | 685,466 |
| Events in quadrant B | 4,559,464 | 665,367 |
| Events in quadrant C | 2,890,951 | 718,823 |
| Events in quadrant D | 5,345,875 | 640,270 |
| Mode M9 | |||
|---|---|---|---|
| Quadrant | BADHDUFLAG | Total packets | Discarded packets |
| A | 0 | 12 | 0 |
| B | 0 | 12 | 0 |
| C | 0 | 12 | 0 |
| D | 0 | 12 | 0 |
| Mode M0 | |||
|---|---|---|---|
| Quadrant | BADHDUFLAG | Total packets | Discarded packets |
| A | 0 | 13369 | 2 |
| B | 0 | 17536 | 1 |
| C | 0 | 12415 | 1 |
| D | 0 | 19990 | 1 |
| Mode SS | |||
|---|---|---|---|
| Quadrant | BADHDUFLAG | Total packets | Discarded packets |
| A | 0 | 122 | 0 |
| B | 0 | 122 | 0 |
| C | 0 | 122 | 0 |
| D | 0 | 122 | 0 |
| Quadrant | Total seconds | Saturated seconds | Saturation percentage |
|---|---|---|---|
| A | 5959 | 67 | 1.124350% |
| B | 5959 | 432 | 7.249539% |
| C | 5959 | 32 | 0.537003% |
| D | 5959 | 476 | 7.987917% |
Noise dominated data is calculated using 1-second bins in cleaned event files. If a bin has >2000 counts, and if more than 50% of those come from <1% of pixels, then it is considered to be noise-dominated and hence unusable.
| Quadrant | # 1 sec bins | Bins with >0 counts | Bins with >2000 counts | High rate bins dominated by noise | Noise dominated (total time) | Noise dominated (detector-on time) | Marked lightcurve |
|---|---|---|---|---|---|---|---|
| A | 7204 | 5960 | 9 | 9 | 0.12% | 0.15% | 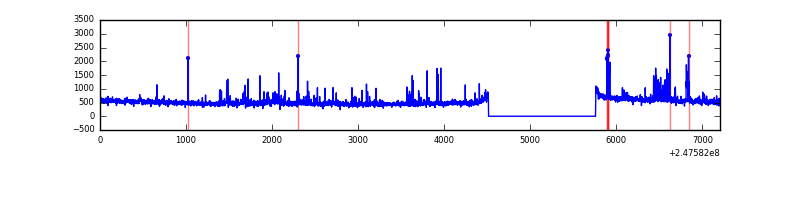 |
| B | 7204 | 5960 | 242 | 242 | 3.36% | 4.06% | 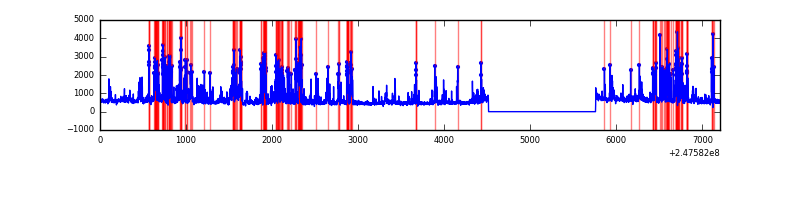 |
| C | 7204 | 5960 | 0 | 0 | 0.00% | 0.00% | 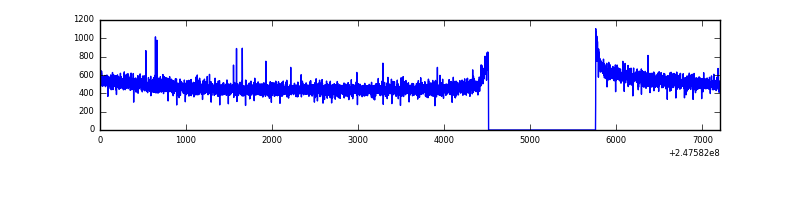 |
| D | 7204 | 5960 | 393 | 393 | 5.46% | 6.59% | 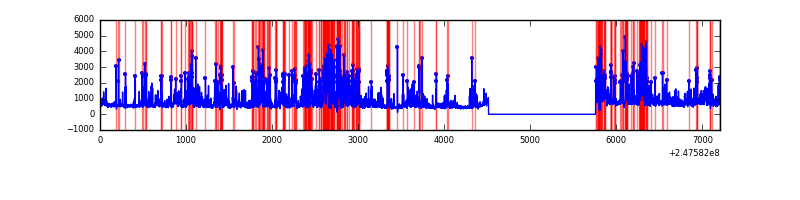 |
Top three noisy pixels from each quadrant. If the there are fewer than three noisy pixels in the level2.evt file, extra rows are filled as -1
| Pixel properties | Quadrant properties | ||||||
|---|---|---|---|---|---|---|---|
| Quadrant | DetID | PixID | Counts | Sigma | Mean | Median | Sigma |
| A | 8 | 5 | 233173 | 1525.25 | 754 | 741 | 152.4 |
| A | 13 | 248 | 32285 | 207.0 | 754 | 741 | 152.4 |
| A | 11 | 29 | 17440 | 109.58 | 754 | 741 | 152.4 |
| B | 4 | 239 | 1418425 | 10337.69 | 729 | 711 | 137.1 |
| B | 11 | 51 | 164343 | 1193.17 | 729 | 711 | 137.1 |
| B | 0 | 214 | 49180 | 353.42 | 729 | 711 | 137.1 |
| C | 13 | 61 | 5262 | 26.2 | 741 | 749 | 172.3 |
| C | 12 | 4 | 1802 | 6.11 | 741 | 749 | 172.3 |
| C | 3 | 202 | 1757 | 5.85 | 741 | 749 | 172.3 |
| D | 10 | 253 | 1087735 | 6459.96 | 712 | 695 | 168.3 |
| D | 1 | 52 | 851620 | 5056.8 | 712 | 695 | 168.3 |
| D | 14 | 34 | 327566 | 1942.5 | 712 | 695 | 168.3 |
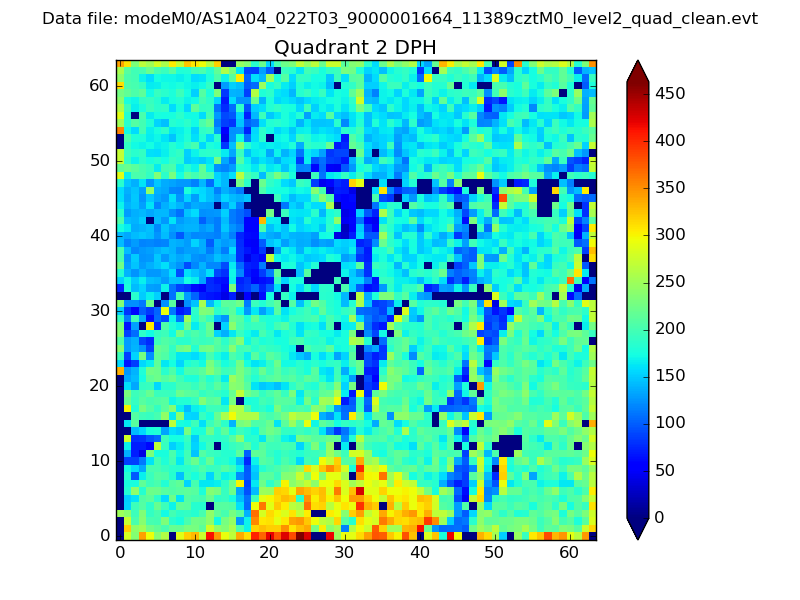
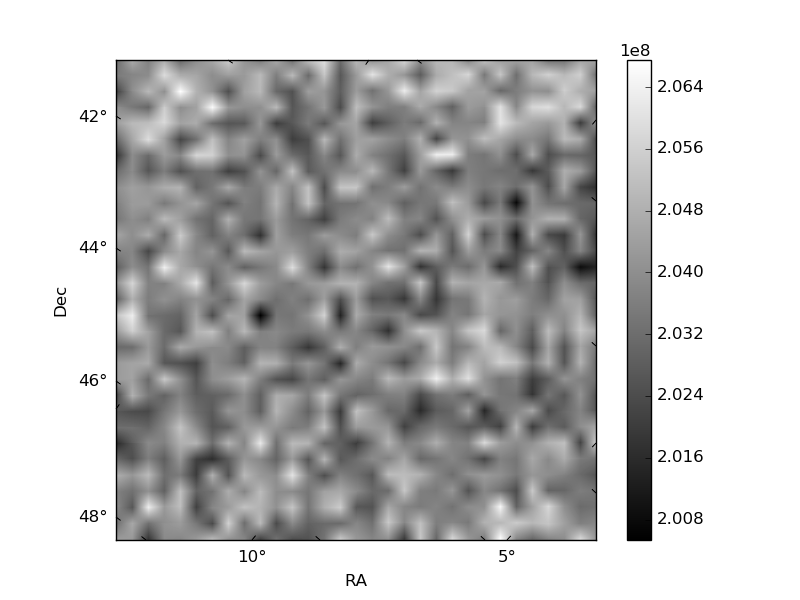
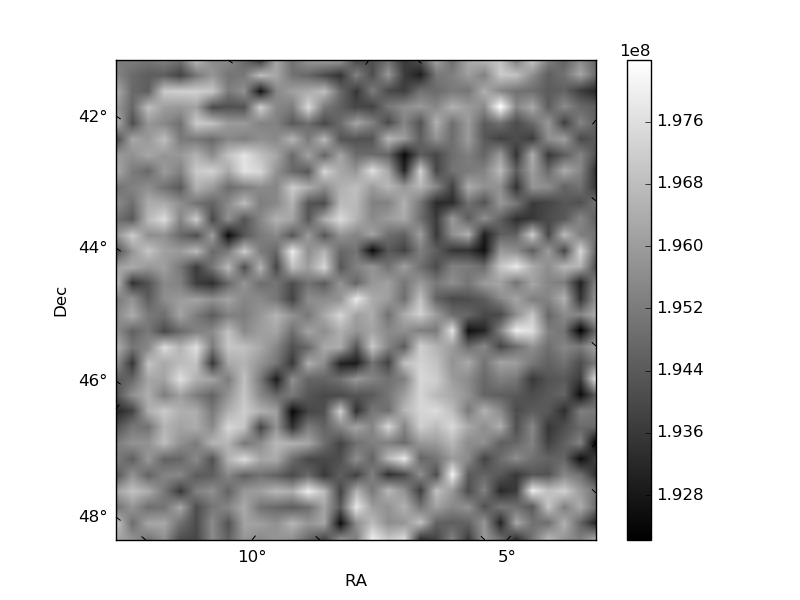
Histogram calculated using DETX and DETY for each event in the final _common_clean file
| Quadrant A | 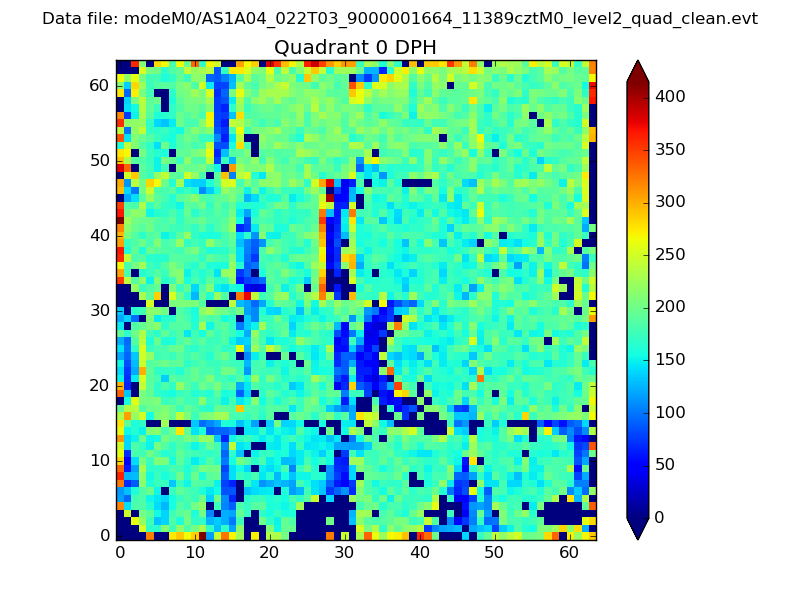 |
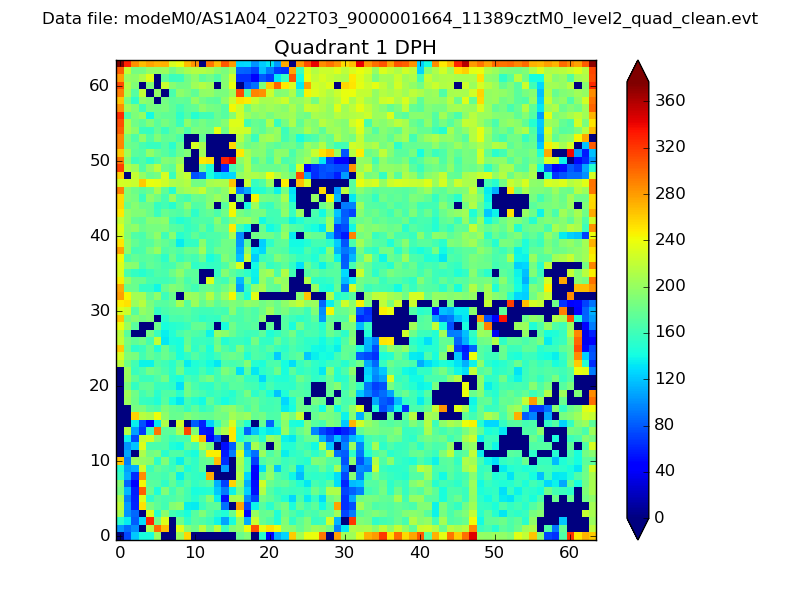 |
Quadrant B |
|---|---|---|---|
| Quadrant D | 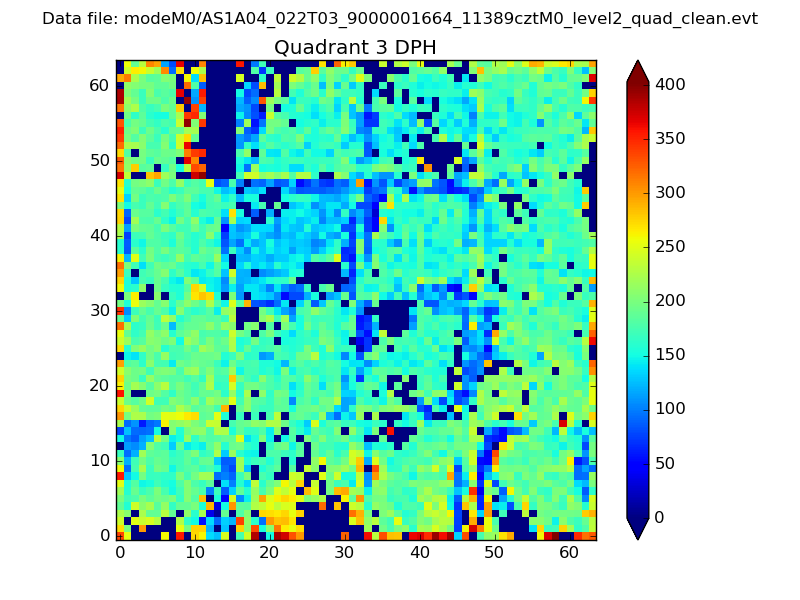 |
 |
Quadrant C |
| Plot type | Count rate plots | Images |
|---|---|---|
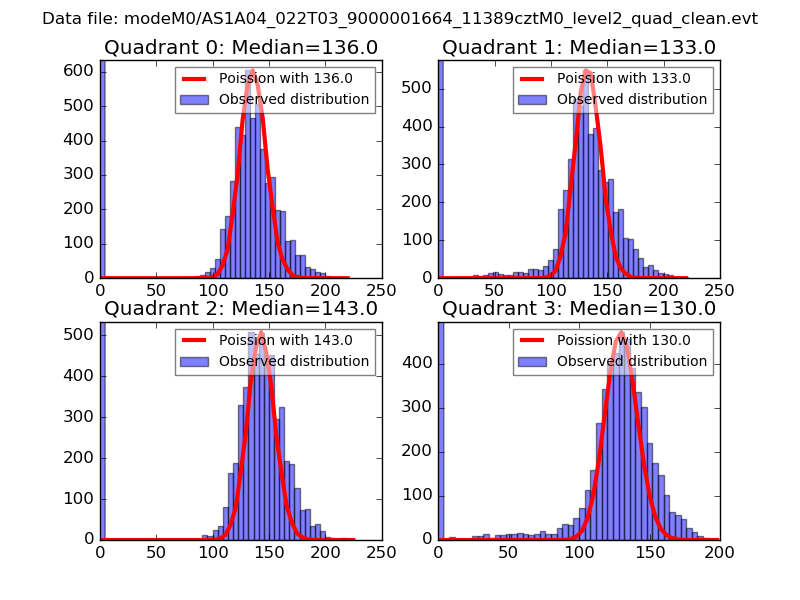
| Comparison with Poisson distribution Blue bars denote a histogram of data divided into 1 sec bins. Red curve is a Poisson curve with rate = median count rate of data. |
 |
 |
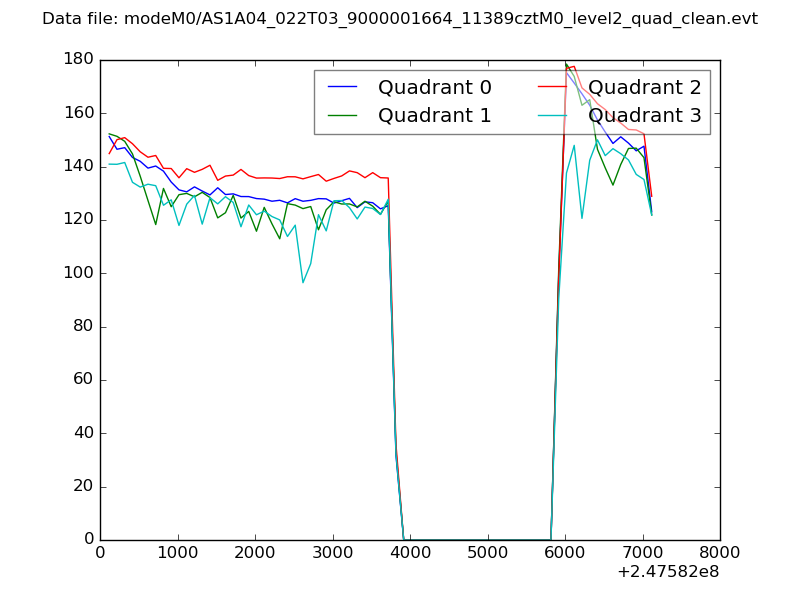
| Quadrant-wise count rates Data is divided into 100 sec bins |
 |
|
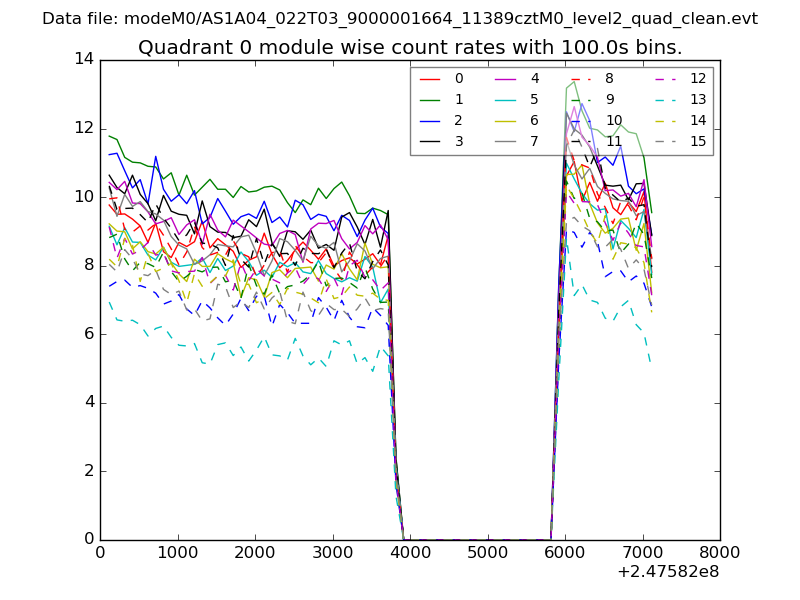
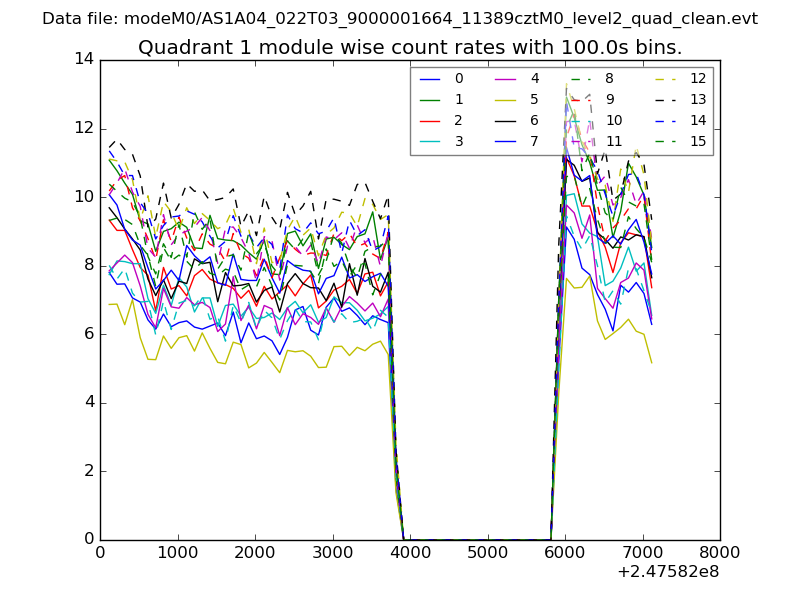
| Module-wise count rates for Quadrant A Data is divided into 100 sec bins |
 |
 |
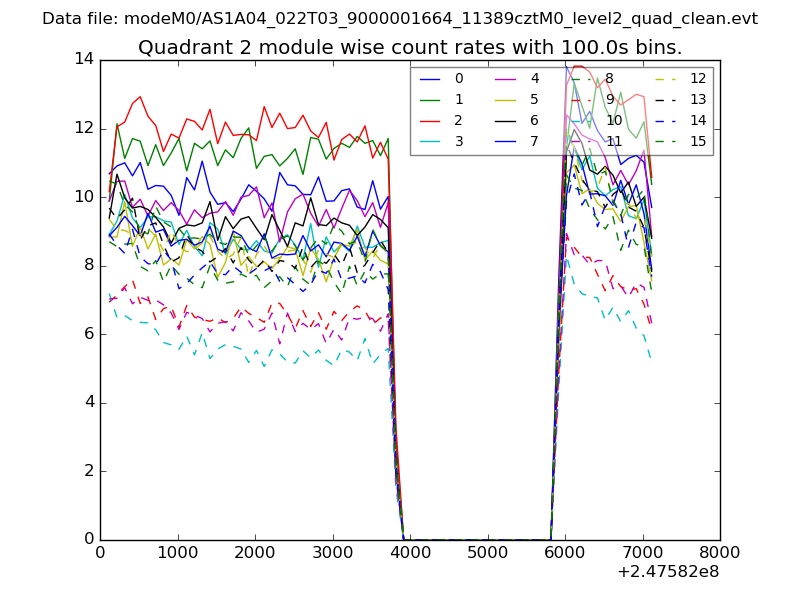
| Module-wise count rates for Quadrant B Data is divided into 100 sec bins |
 |
 |
| Module-wise count rates for Quadrant C Data is divided into 100 sec bins |
 |
 |
| Module-wise count rates for Quadrant D Data is divided into 100 sec bins |
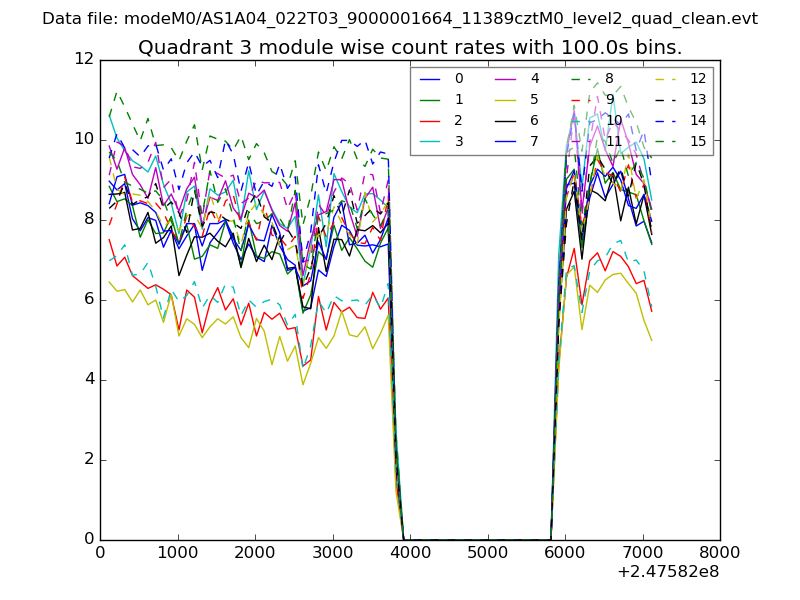 |
 |
| Parameter | Plot |
|---|---|
| CZT HV Monitor | 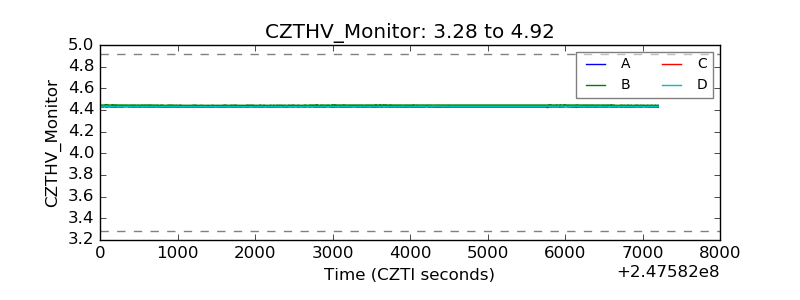 |
| D_VDD | 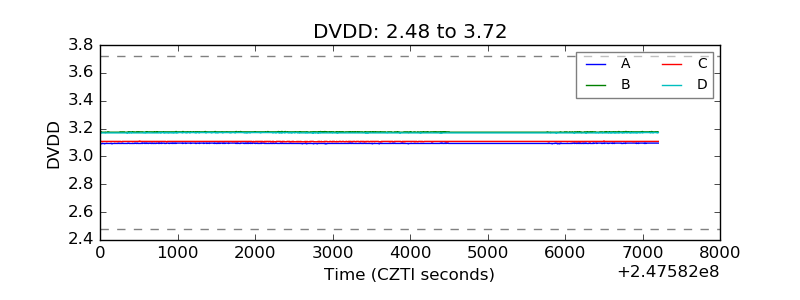 |
| Temperature 1 | 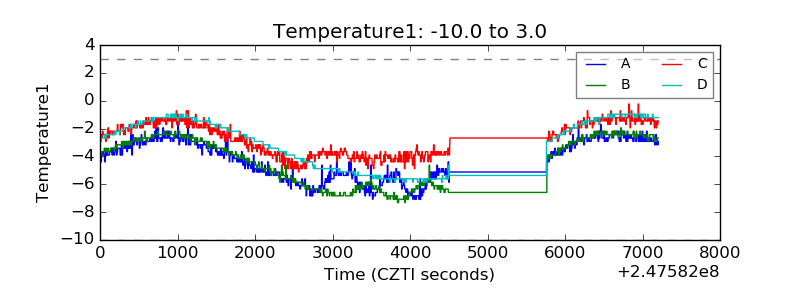 |
| Veto HV Monitor | 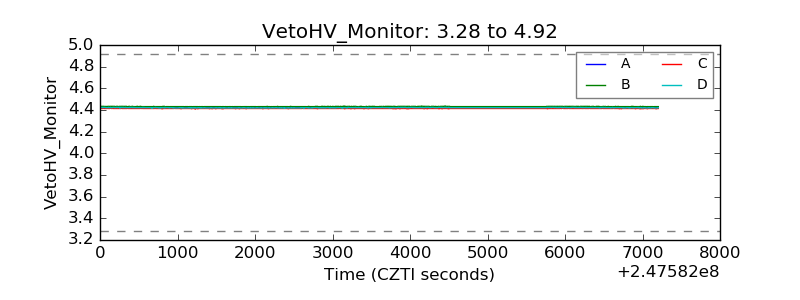 |
| Veto LLD | 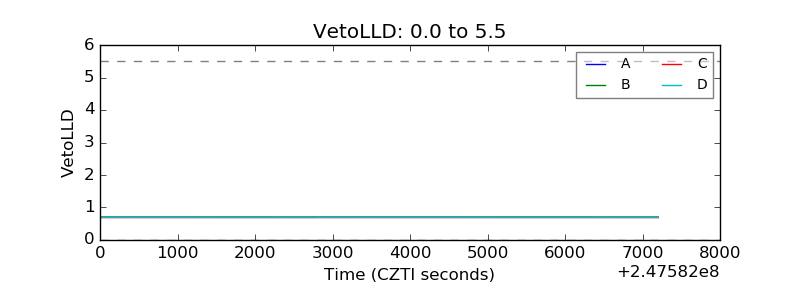 |
| Alpha Counter | 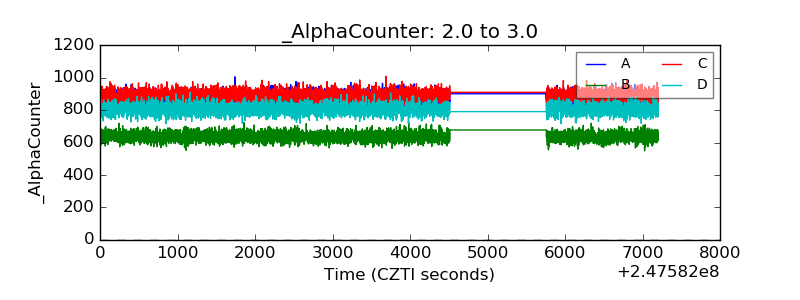 |
| _CPM_Rate | 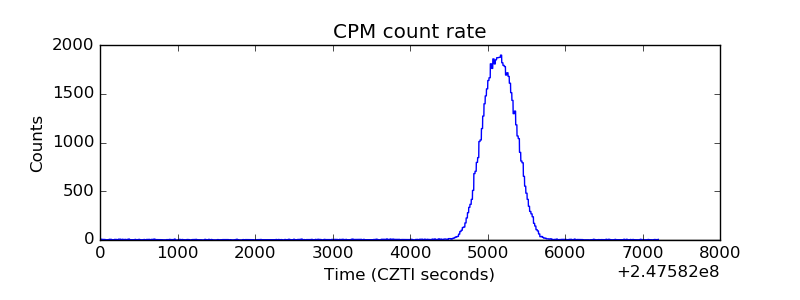 |
| CZT Counter | 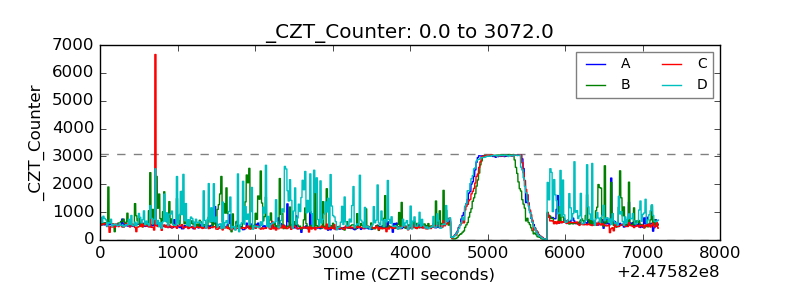 |
| +2.5 Volts monitor |  |
| +5 Volts monitor |  |
| _ROLL_ROT | 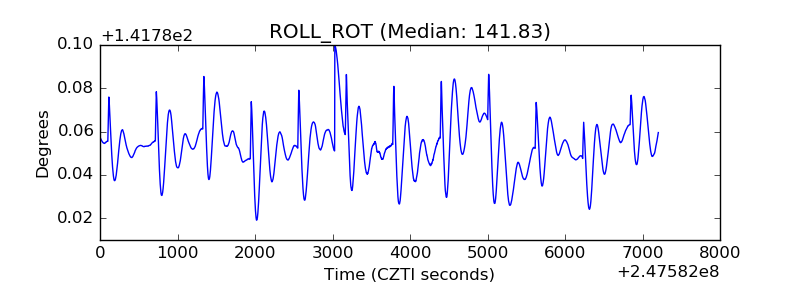 |
| _Roll_DEC | 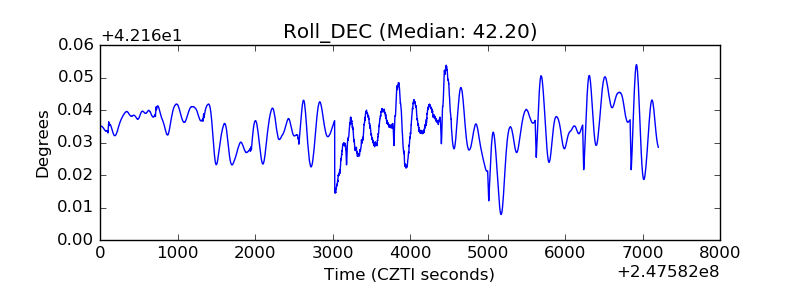 |
| _Roll_RA | 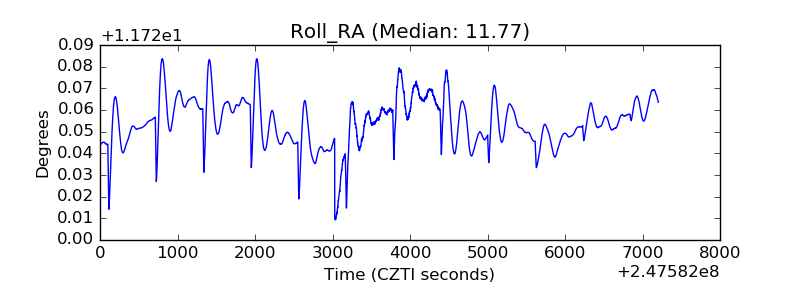 |
| Veto Counter | 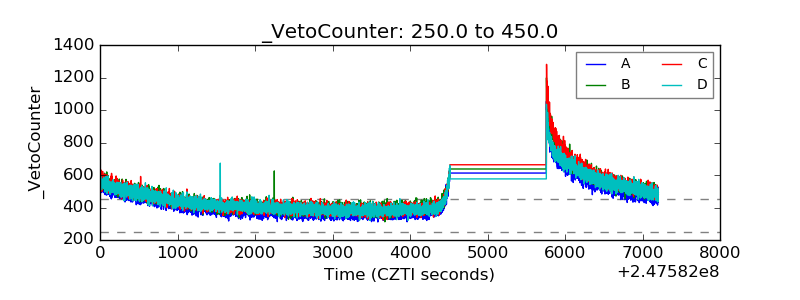 |