| Param | Original file | Final file |
|---|---|---|
| Filename | modeM0/AS1A04_022T03_9000001664_11392cztM0_level2.evt | modeM0/AS1A04_022T03_9000001664_11392cztM0_level2_quad_clean.evt |
| Size (bytes) | 490,040,640 | 85,835,520 |
| Size | 467.3 MB | 81.9 MB |
| Events in quadrant A | 3,391,898 | 545,588 |
| Events in quadrant B | 4,063,047 | 534,429 |
| Events in quadrant C | 2,812,757 | 586,816 |
| Events in quadrant D | 4,180,193 | 527,592 |
| Mode M9 | |||
|---|---|---|---|
| Quadrant | BADHDUFLAG | Total packets | Discarded packets |
| A | 0 | 14 | 0 |
| B | 0 | 14 | 0 |
| C | 0 | 14 | 0 |
| D | 0 | 15 | 0 |
| Mode M0 | |||
|---|---|---|---|
| Quadrant | BADHDUFLAG | Total packets | Discarded packets |
| A | 0 | 13824 | 2 |
| B | 0 | 15916 | 2 |
| C | 0 | 12053 | 2 |
| D | 0 | 16395 | 2 |
| Mode SS | |||
|---|---|---|---|
| Quadrant | BADHDUFLAG | Total packets | Discarded packets |
| A | 0 | 118 | 0 |
| B | 0 | 118 | 0 |
| C | 0 | 118 | 0 |
| D | 0 | 118 | 0 |
| Quadrant | Total seconds | Saturated seconds | Saturation percentage |
|---|---|---|---|
| A | 5790 | 207 | 3.575130% |
| B | 5790 | 372 | 6.424870% |
| C | 5790 | 53 | 0.915371% |
| D | 5790 | 296 | 5.112263% |
Noise dominated data is calculated using 1-second bins in cleaned event files. If a bin has >2000 counts, and if more than 50% of those come from <1% of pixels, then it is considered to be noise-dominated and hence unusable.
| Quadrant | # 1 sec bins | Bins with >0 counts | Bins with >2000 counts | High rate bins dominated by noise | Noise dominated (total time) | Noise dominated (detector-on time) | Marked lightcurve |
|---|---|---|---|---|---|---|---|
| A | 7050 | 5791 | 105 | 105 | 1.49% | 1.81% | 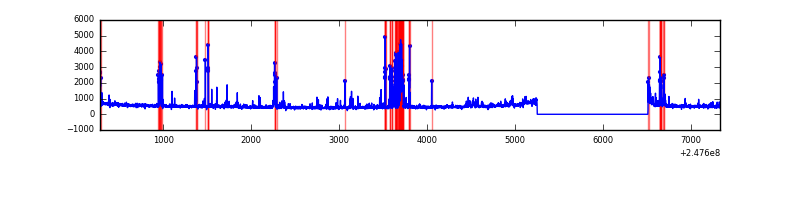 |
| B | 7050 | 5791 | 190 | 190 | 2.70% | 3.28% | 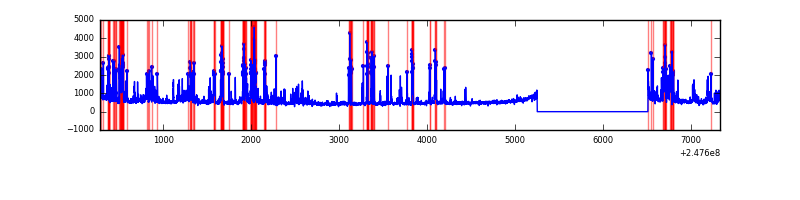 |
| C | 7050 | 5791 | 0 | 0 | 0.00% | 0.00% | 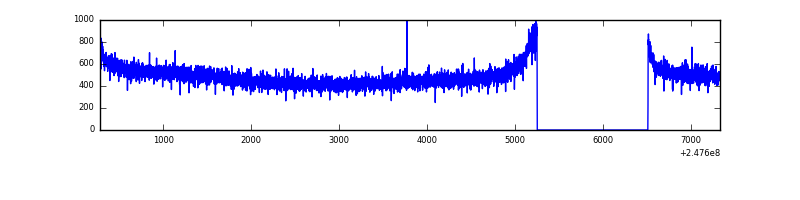 |
| D | 7050 | 5791 | 214 | 214 | 3.04% | 3.70% | 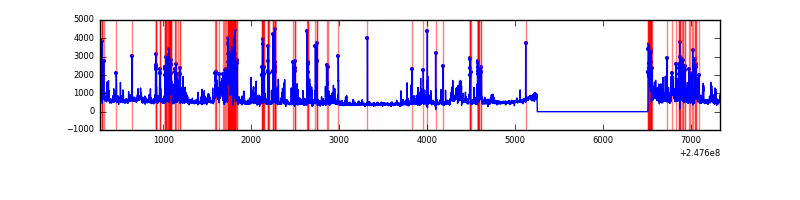 |
Top three noisy pixels from each quadrant. If the there are fewer than three noisy pixels in the level2.evt file, extra rows are filled as -1
| Pixel properties | Quadrant properties | ||||||
|---|---|---|---|---|---|---|---|
| Quadrant | DetID | PixID | Counts | Sigma | Mean | Median | Sigma |
| A | 8 | 5 | 603550 | 4173.43 | 714 | 697 | 144.5 |
| A | 1 | 162 | 12463 | 81.45 | 714 | 697 | 144.5 |
| A | 1 | 178 | 7033 | 43.86 | 714 | 697 | 144.5 |
| B | 4 | 239 | 1115468 | 8435.35 | 706 | 688 | 132.2 |
| B | 11 | 51 | 108484 | 815.67 | 706 | 688 | 132.2 |
| B | 15 | 204 | 45575 | 339.65 | 706 | 688 | 132.2 |
| C | 13 | 61 | 5288 | 27.32 | 721 | 727 | 166.9 |
| C | 3 | 202 | 1804 | 6.45 | 721 | 727 | 166.9 |
| C | 3 | 203 | 1566 | 5.03 | 721 | 727 | 166.9 |
| D | 14 | 34 | 580633 | 3484.24 | 700 | 683 | 166.4 |
| D | 10 | 253 | 405228 | 2430.44 | 700 | 683 | 166.4 |
| D | 1 | 52 | 260663 | 1561.92 | 700 | 683 | 166.4 |
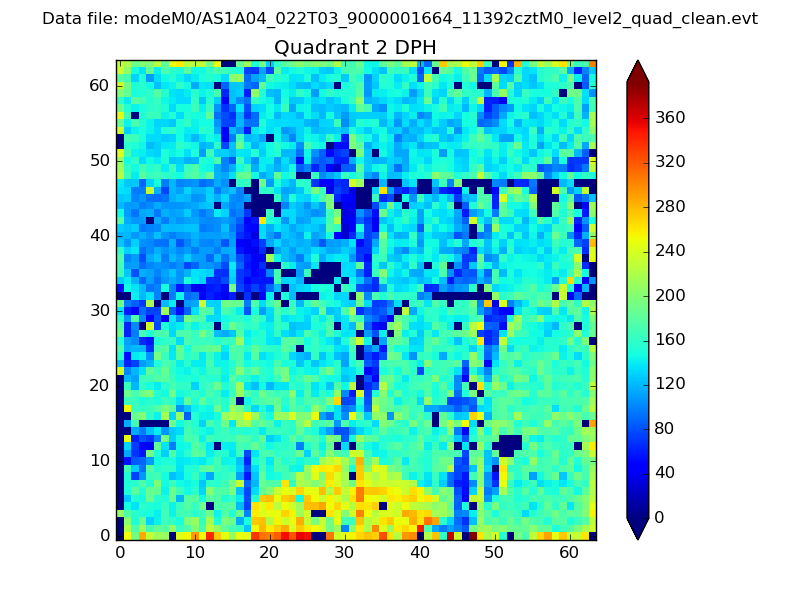
Histogram calculated using DETX and DETY for each event in the final _common_clean file
| Quadrant A |  |
 |
Quadrant B |
|---|---|---|---|
| Quadrant D | 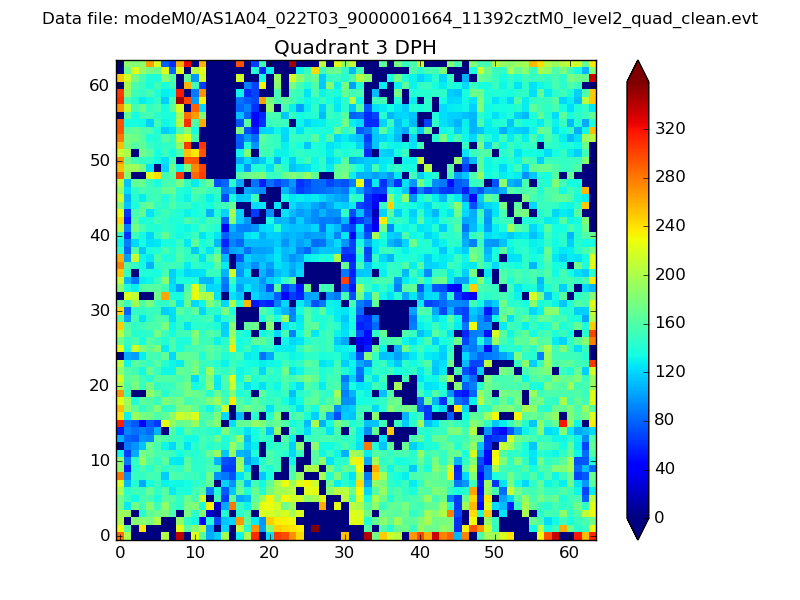 |
 |
Quadrant C |
| Plot type | Count rate plots | Images |
|---|---|---|
| Comparison with Poisson distribution Blue bars denote a histogram of data divided into 1 sec bins. Red curve is a Poisson curve with rate = median count rate of data. |
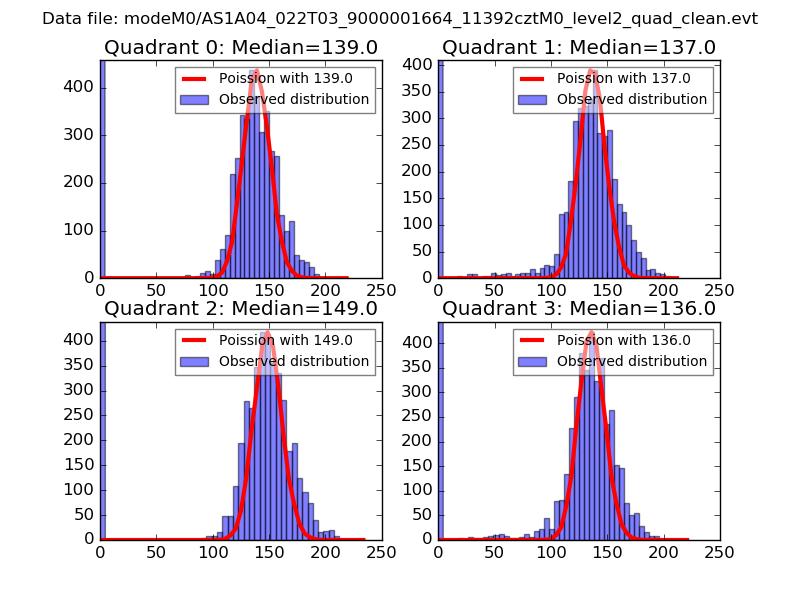 |
 |
| Quadrant-wise count rates Data is divided into 100 sec bins |
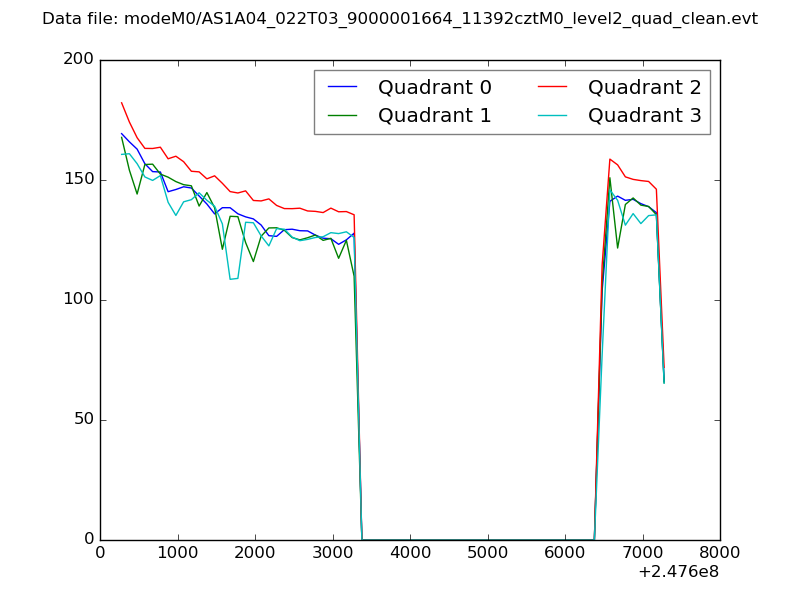 |
|
| Module-wise count rates for Quadrant A Data is divided into 100 sec bins |
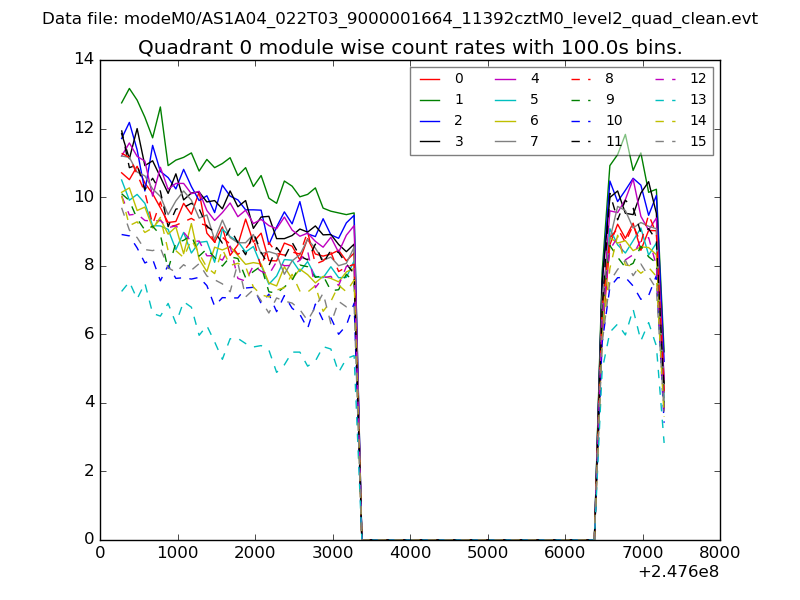 |
 |
| Module-wise count rates for Quadrant B Data is divided into 100 sec bins |
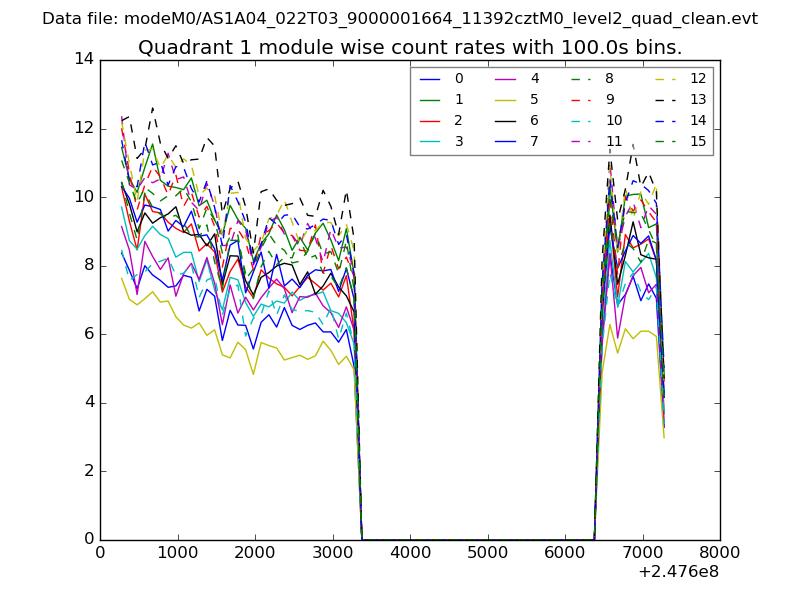 |
 |
| Module-wise count rates for Quadrant C Data is divided into 100 sec bins |
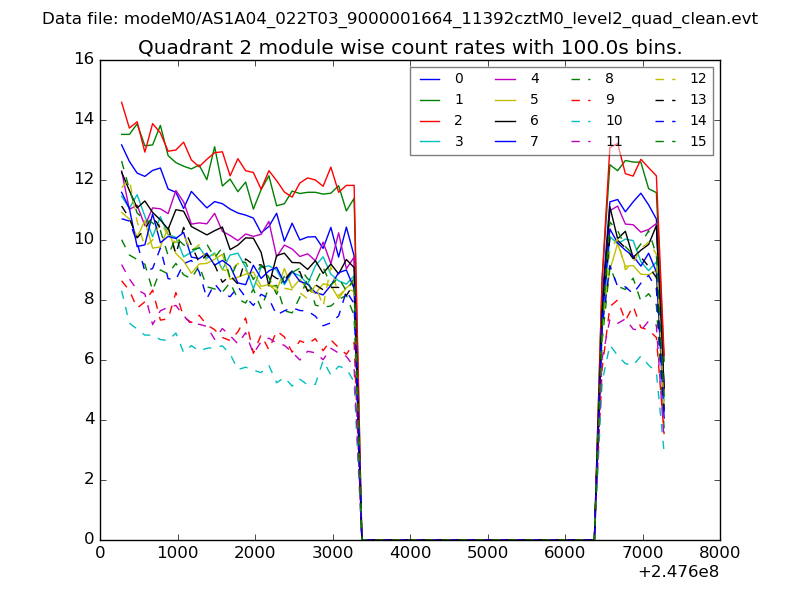 |
 |
| Module-wise count rates for Quadrant D Data is divided into 100 sec bins |
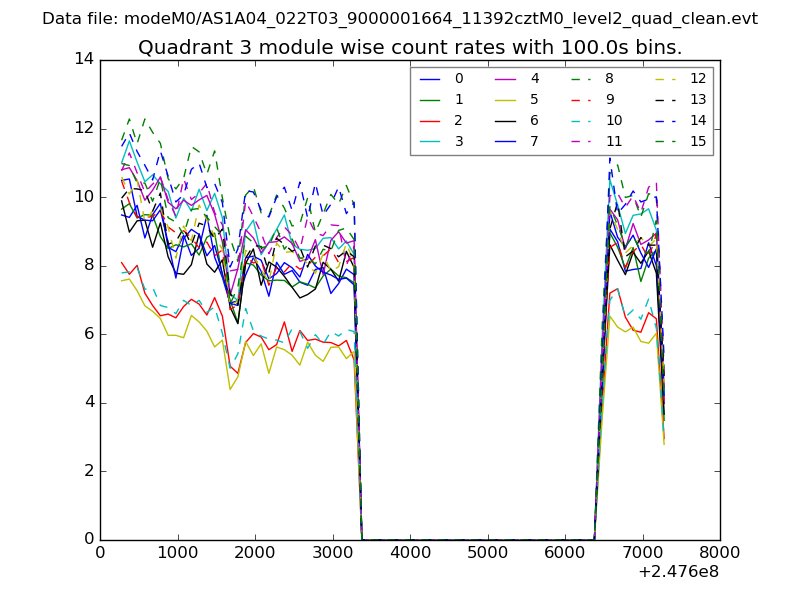 |
 |
| Parameter | Plot |
|---|---|
| CZT HV Monitor | 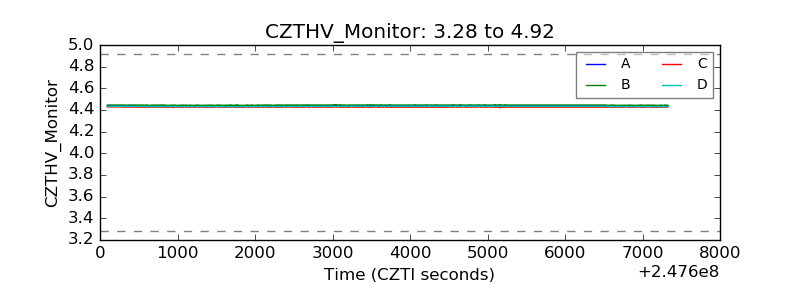 |
| D_VDD | 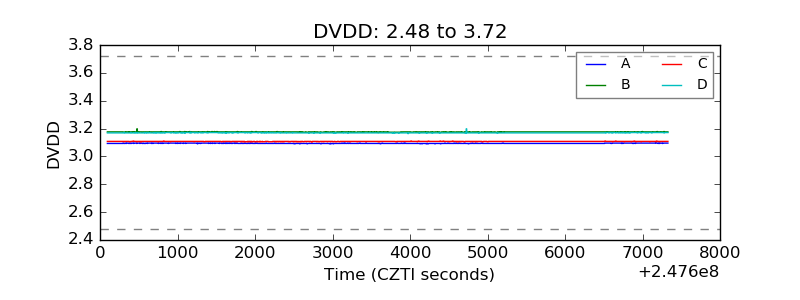 |
| Temperature 1 | 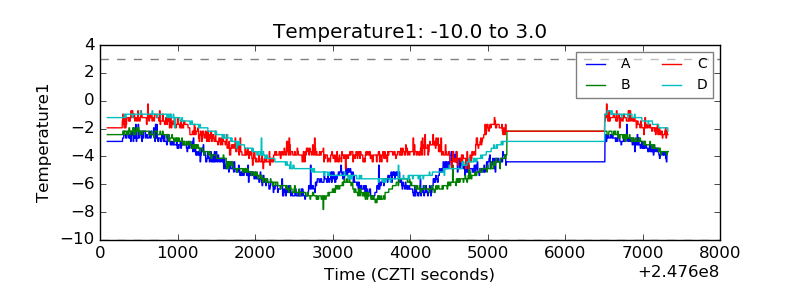 |
| Veto HV Monitor | 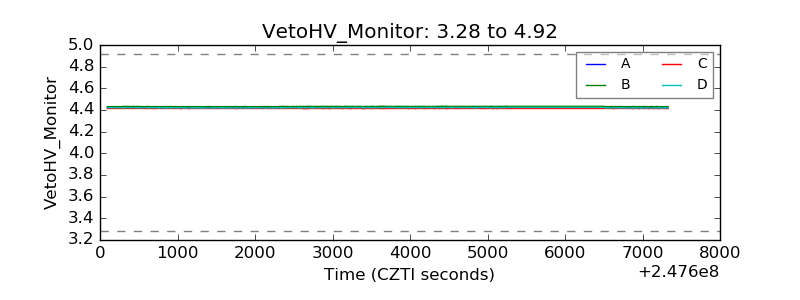 |
| Veto LLD | 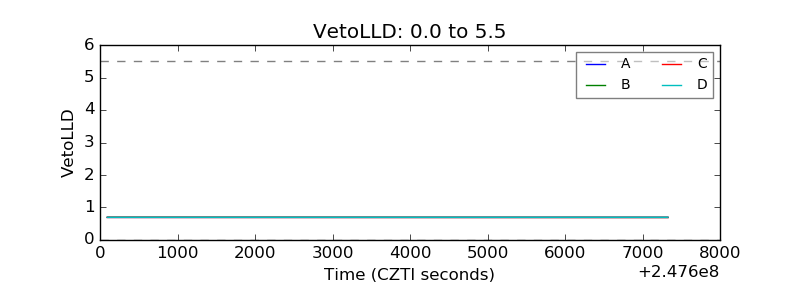 |
| Alpha Counter | 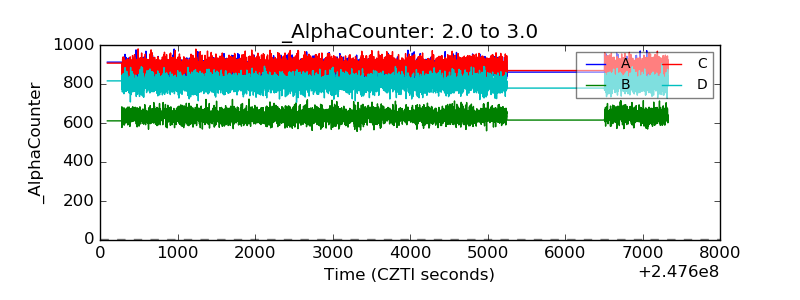 |
| _CPM_Rate | 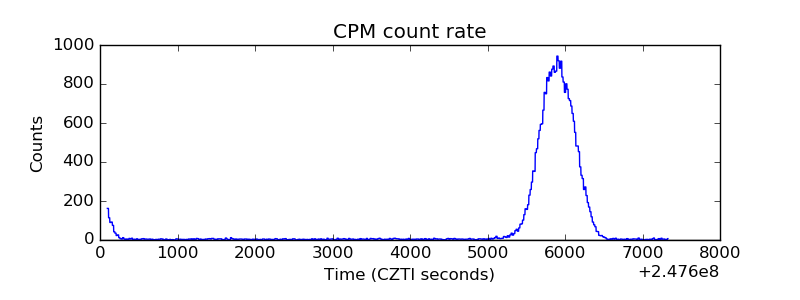 |
| CZT Counter |  |
| +2.5 Volts monitor |  |
| +5 Volts monitor | 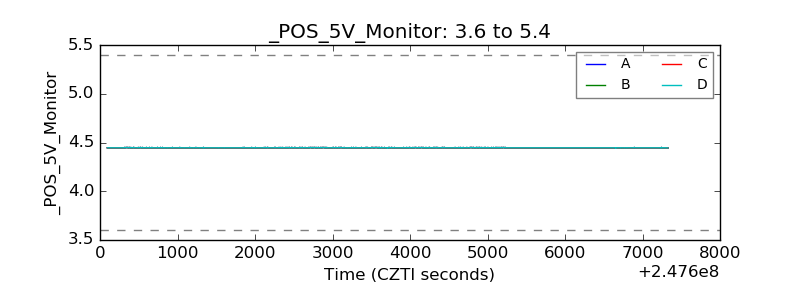 |
| _ROLL_ROT | 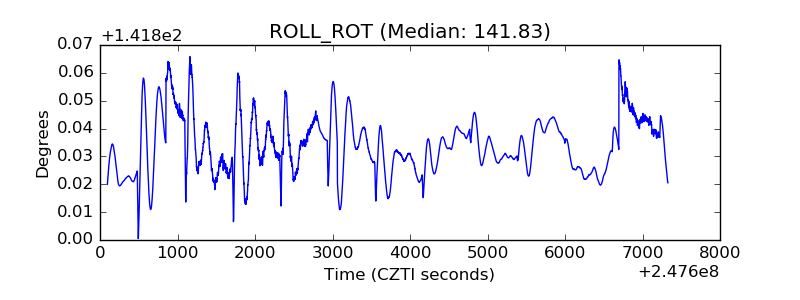 |
| _Roll_DEC | 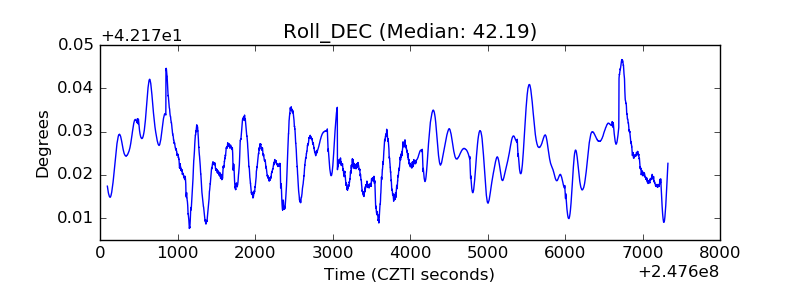 |
| _Roll_RA | 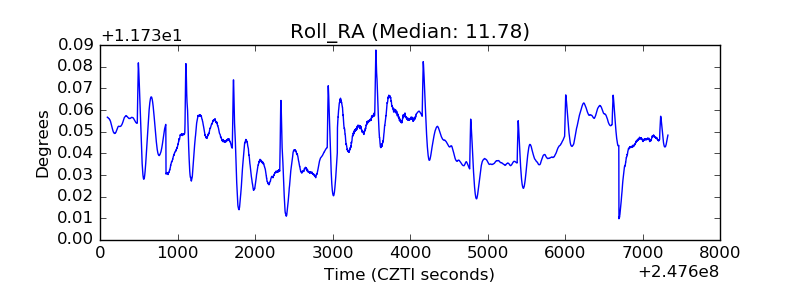 |
| Veto Counter | 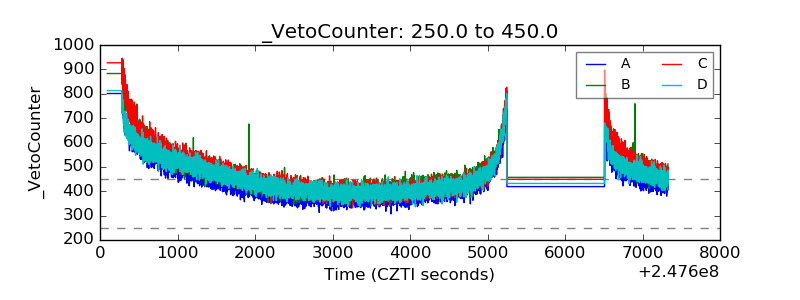 |