| Param | Original file | Final file |
|---|---|---|
| Filename | modeM0/AS1A04_022T03_9000001664_11393cztM0_level2.evt | modeM0/AS1A04_022T03_9000001664_11393cztM0_level2_quad_clean.evt |
| Size (bytes) | 80,233,920 | 17,510,400 |
| Size | 76.5 MB | 16.7 MB |
| Events in quadrant A | 508,495 | 115,777 |
| Events in quadrant B | 681,021 | 114,434 |
| Events in quadrant C | 429,513 | 124,921 |
| Events in quadrant D | 752,352 | 110,093 |
| Mode M9 | |||
|---|---|---|---|
| Quadrant | BADHDUFLAG | Total packets | Discarded packets |
| A | 0 | 7 | 0 |
| B | 0 | 7 | 0 |
| C | 0 | 7 | 0 |
| D | 0 | 8 | 0 |
| Mode M0 | |||
|---|---|---|---|
| Quadrant | BADHDUFLAG | Total packets | Discarded packets |
| A | 0 | 1995 | 1 |
| B | 0 | 2576 | 1 |
| C | 0 | 1728 | 1 |
| D | 0 | 2799 | 1 |
| Mode SS | |||
|---|---|---|---|
| Quadrant | BADHDUFLAG | Total packets | Discarded packets |
| A | 0 | 16 | 0 |
| B | 0 | 16 | 0 |
| C | 0 | 16 | 0 |
| D | 0 | 16 | 0 |
| Quadrant | Total seconds | Saturated seconds | Saturation percentage |
|---|---|---|---|
| A | 819 | 35 | 4.273504% |
| B | 819 | 82 | 10.012210% |
| C | 819 | 2 | 0.244200% |
| D | 819 | 71 | 8.669109% |
Noise dominated data is calculated using 1-second bins in cleaned event files. If a bin has >2000 counts, and if more than 50% of those come from <1% of pixels, then it is considered to be noise-dominated and hence unusable.
| Quadrant | # 1 sec bins | Bins with >0 counts | Bins with >2000 counts | High rate bins dominated by noise | Noise dominated (total time) | Noise dominated (detector-on time) | Marked lightcurve |
|---|---|---|---|---|---|---|---|
| A | 819 | 819 | 14 | 14 | 1.71% | 1.71% | 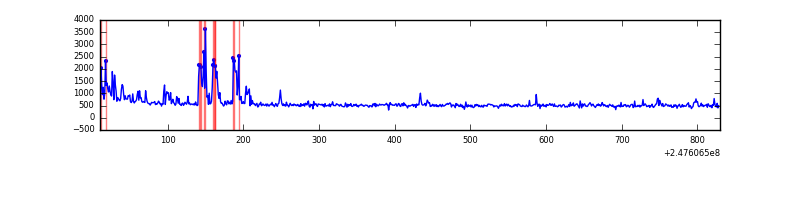 |
| B | 819 | 819 | 25 | 25 | 3.05% | 3.05% | 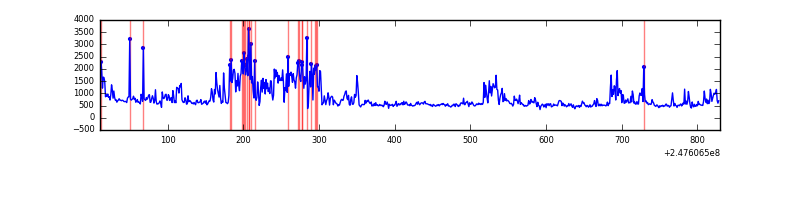 |
| C | 819 | 819 | 0 | 0 | 0.00% | 0.00% | 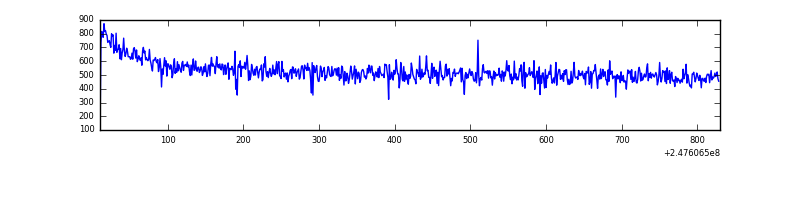 |
| D | 819 | 819 | 42 | 42 | 5.13% | 5.13% | 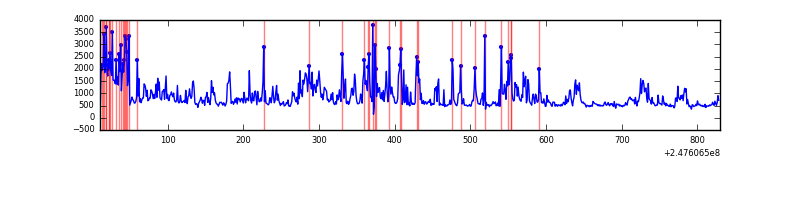 |
Top three noisy pixels from each quadrant. If the there are fewer than three noisy pixels in the level2.evt file, extra rows are filled as -1
| Pixel properties | Quadrant properties | ||||||
|---|---|---|---|---|---|---|---|
| Quadrant | DetID | PixID | Counts | Sigma | Mean | Median | Sigma |
| A | 8 | 5 | 91070 | 3788.7 | 107 | 105 | 24.0 |
| A | 0 | 226 | 993 | 36.99 | 107 | 105 | 24.0 |
| A | 12 | 194 | 930 | 34.36 | 107 | 105 | 24.0 |
| B | 4 | 239 | 239426 | 10980.96 | 104 | 102 | 21.8 |
| B | 15 | 204 | 17984 | 820.48 | 104 | 102 | 21.8 |
| B | 11 | 51 | 7862 | 356.05 | 104 | 102 | 21.8 |
| C | 13 | 61 | 849 | 26.67 | 110 | 110 | 27.7 |
| C | 7 | 159 | 335 | 8.12 | 110 | 110 | 27.7 |
| C | 14 | 67 | 256 | 5.27 | 110 | 110 | 27.7 |
| D | 14 | 34 | 239666 | 8911.62 | 105 | 102 | 26.9 |
| D | 1 | 52 | 59106 | 2194.91 | 105 | 102 | 26.9 |
| D | 2 | 120 | 21280 | 787.81 | 105 | 102 | 26.9 |
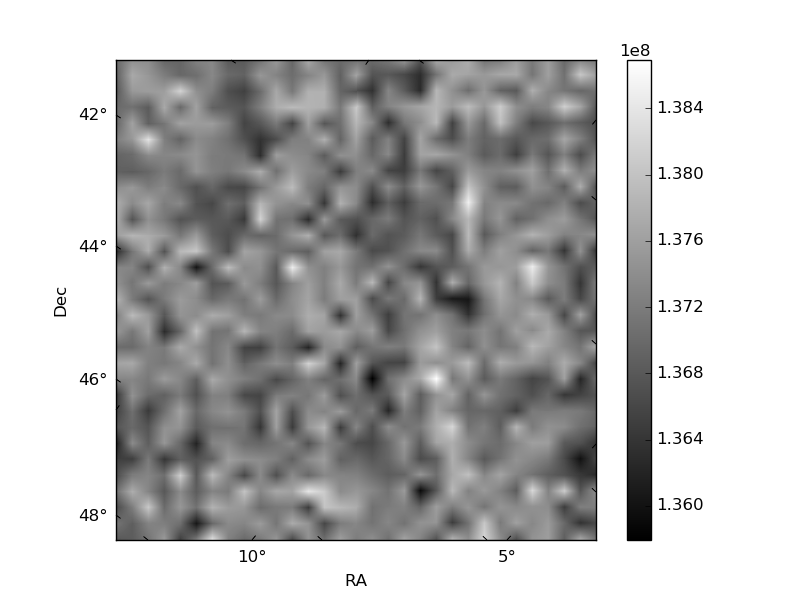
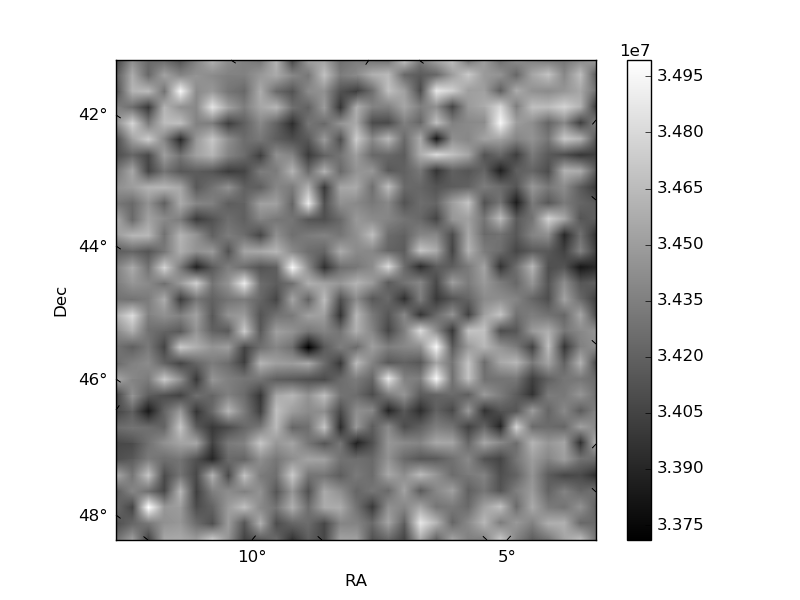
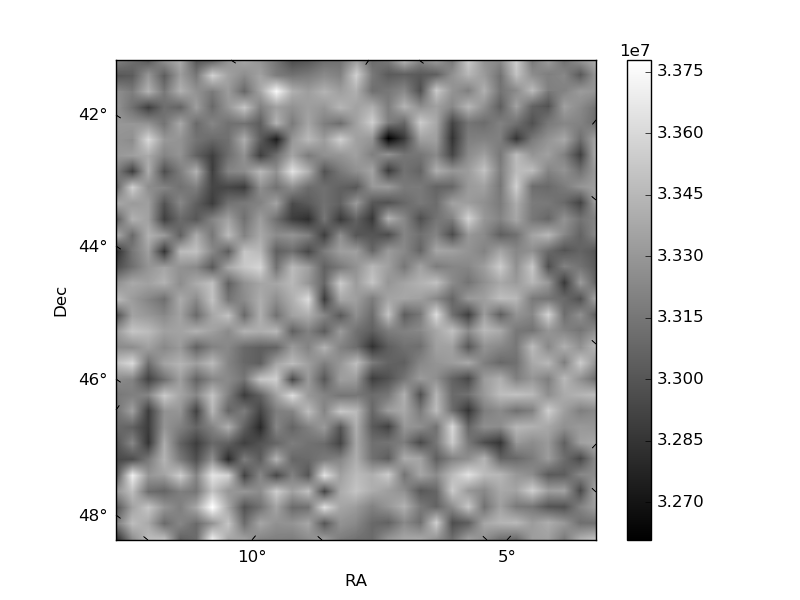
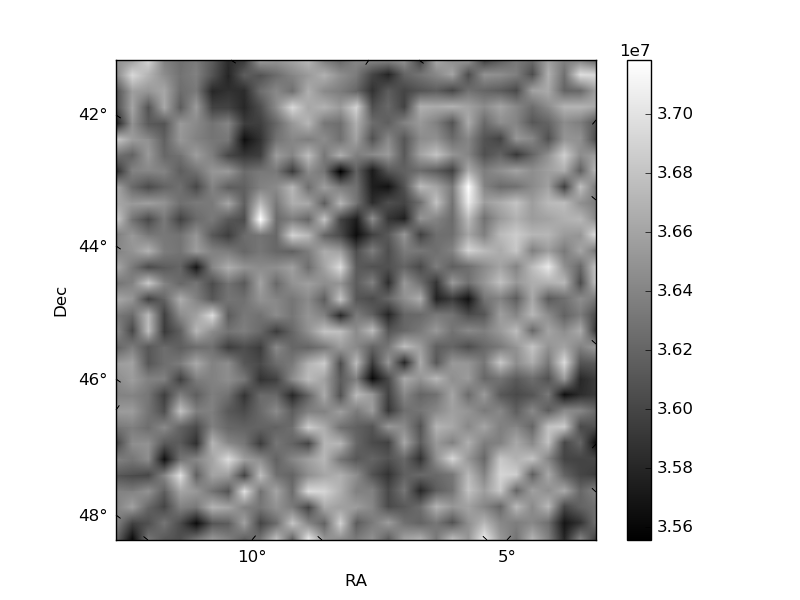
Histogram calculated using DETX and DETY for each event in the final _common_clean file
| Quadrant A | 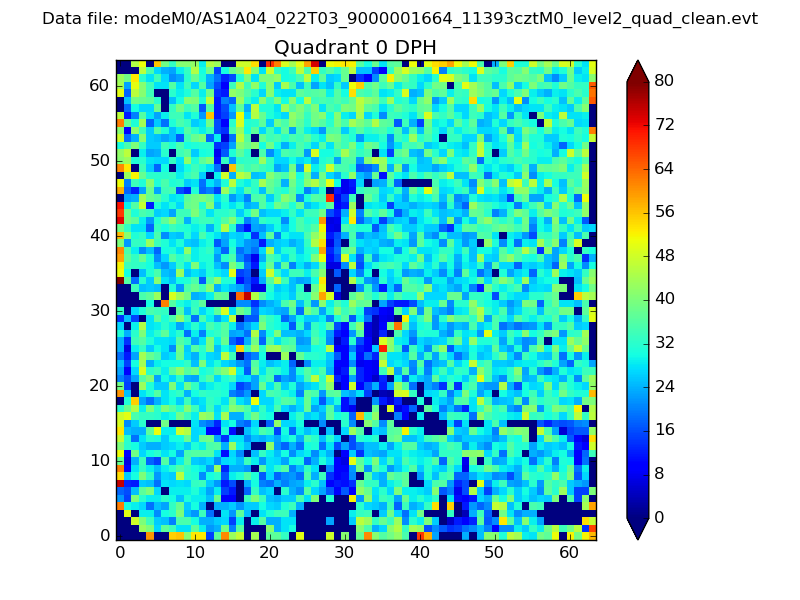 |
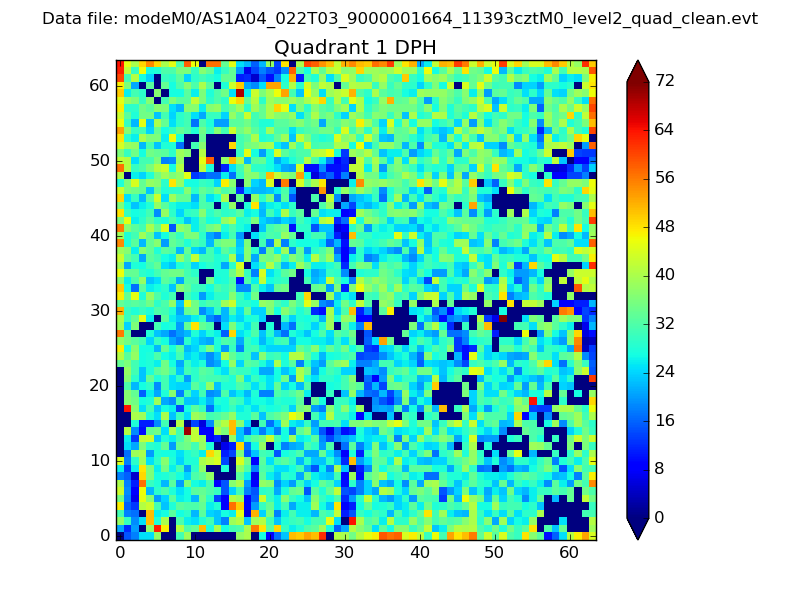 |
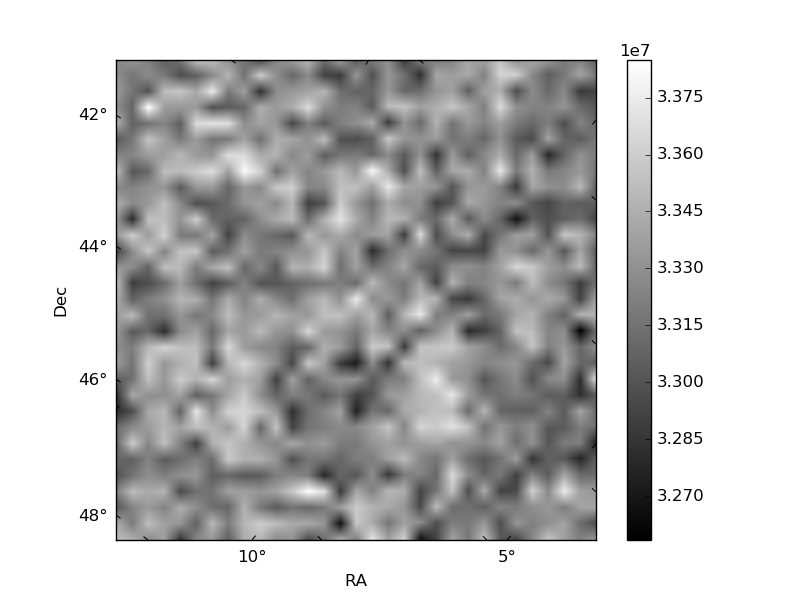
Quadrant B |
|---|---|---|---|
| Quadrant D | 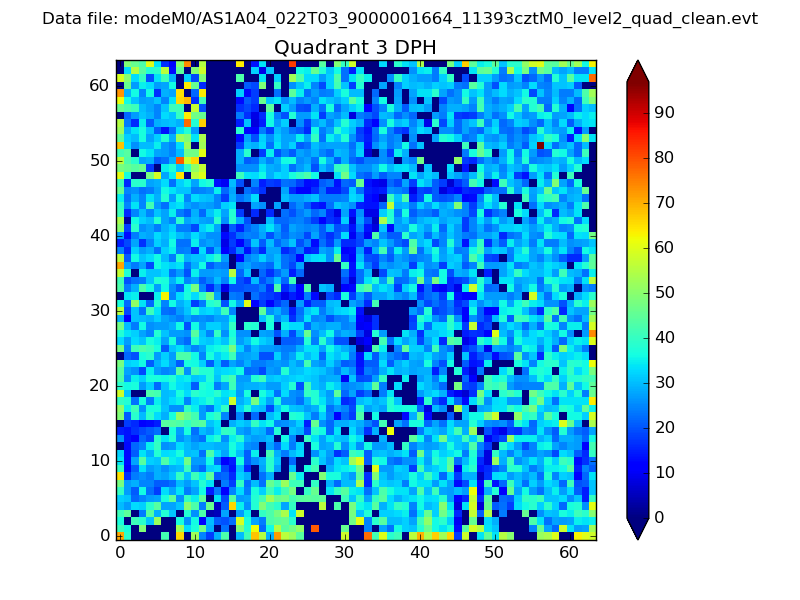 |
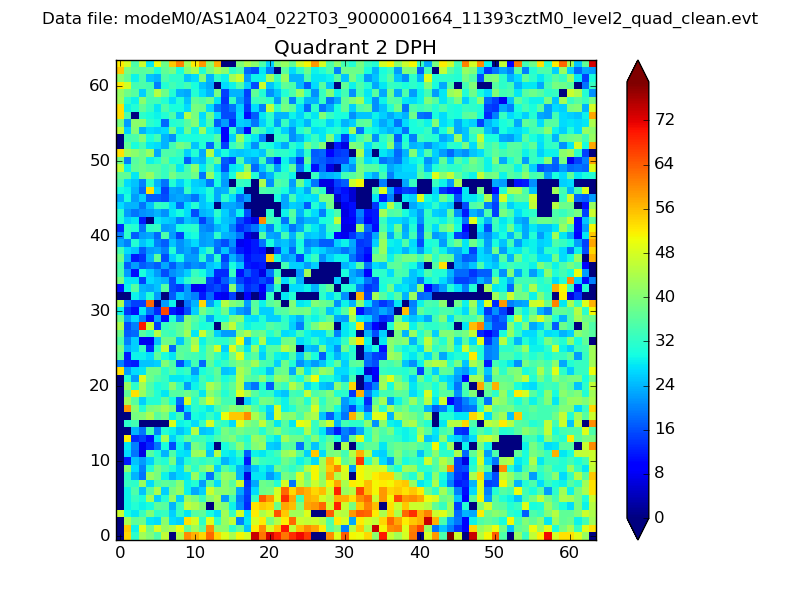 |
Quadrant C |
| Plot type | Count rate plots | Images |
|---|---|---|
| Comparison with Poisson distribution Blue bars denote a histogram of data divided into 1 sec bins. Red curve is a Poisson curve with rate = median count rate of data. |
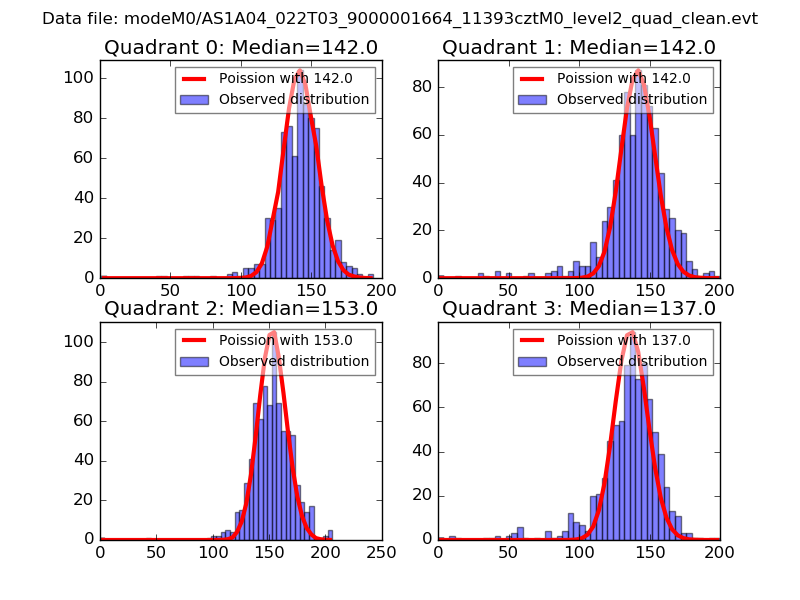 |
 |
| Quadrant-wise count rates Data is divided into 100 sec bins |
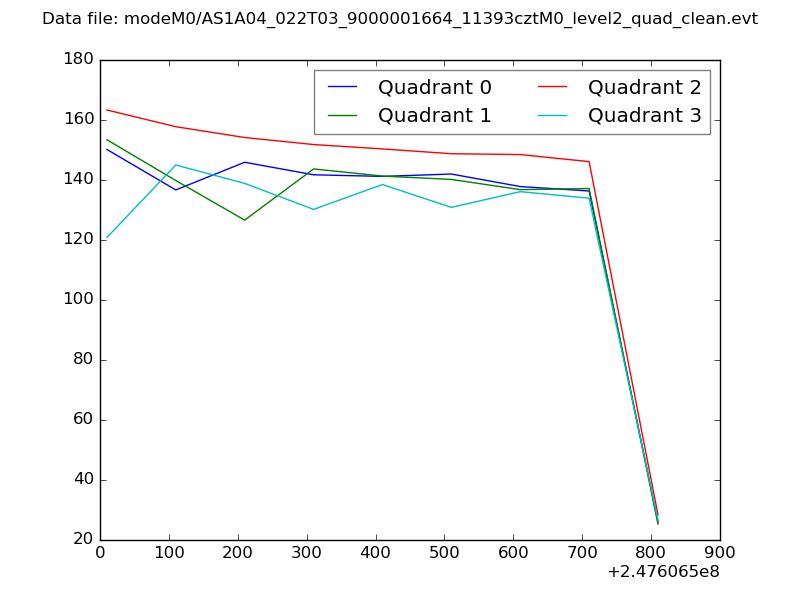 |
|
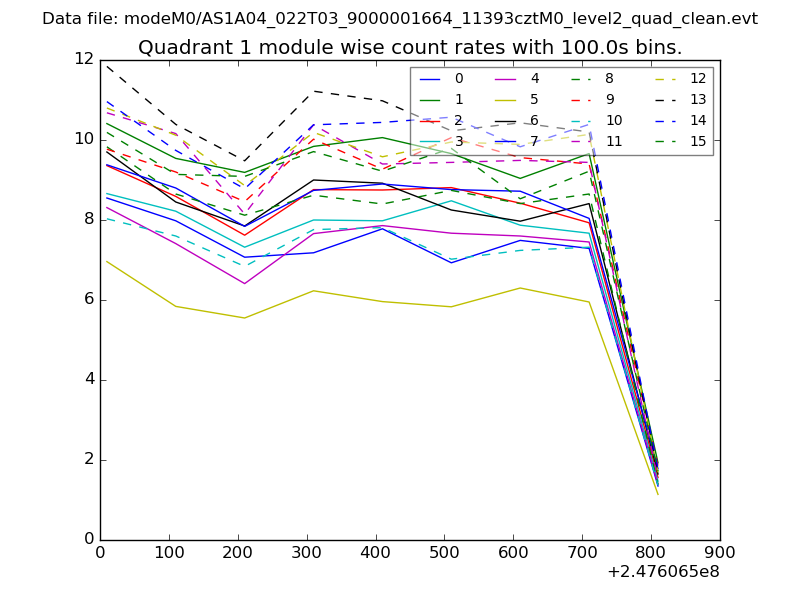
| Module-wise count rates for Quadrant A Data is divided into 100 sec bins |
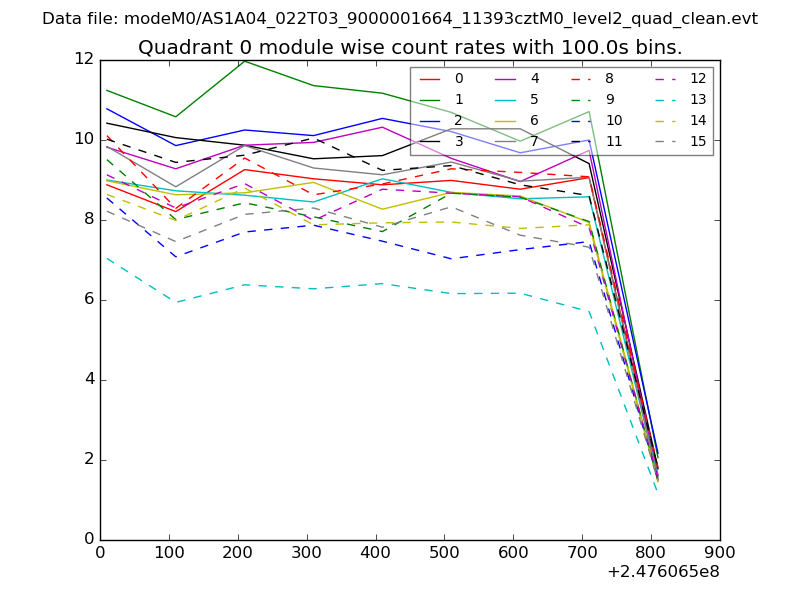 |
 |
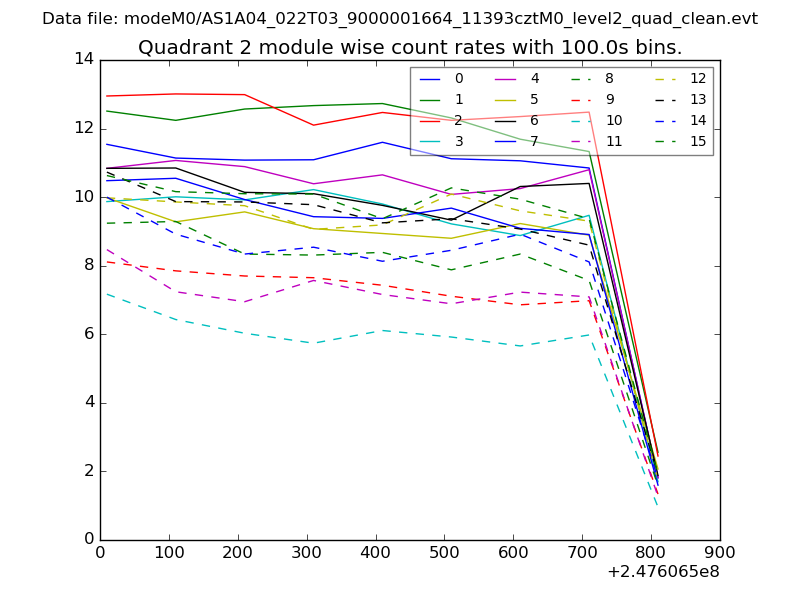
| Module-wise count rates for Quadrant B Data is divided into 100 sec bins |
 |
 |
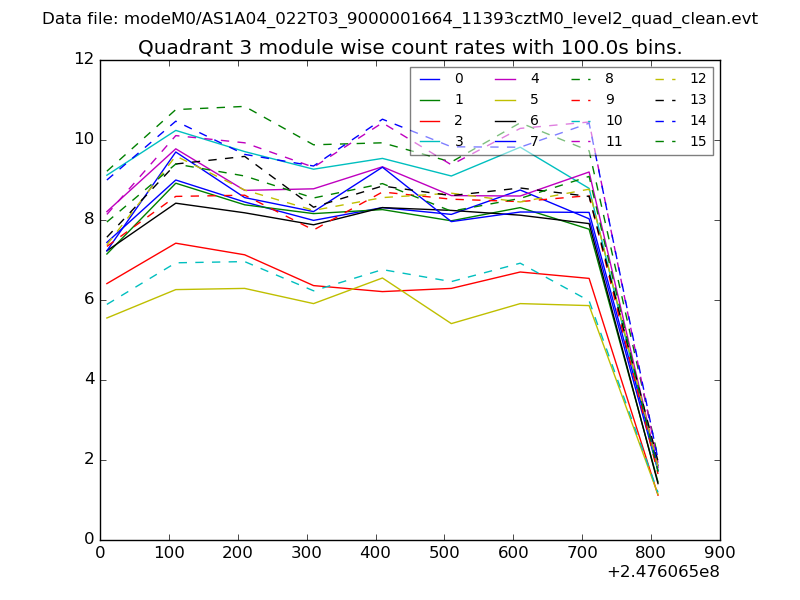
| Module-wise count rates for Quadrant C Data is divided into 100 sec bins |
 |
 |
| Module-wise count rates for Quadrant D Data is divided into 100 sec bins |
 |
 |
| Parameter | Plot |
|---|---|
| CZT HV Monitor | 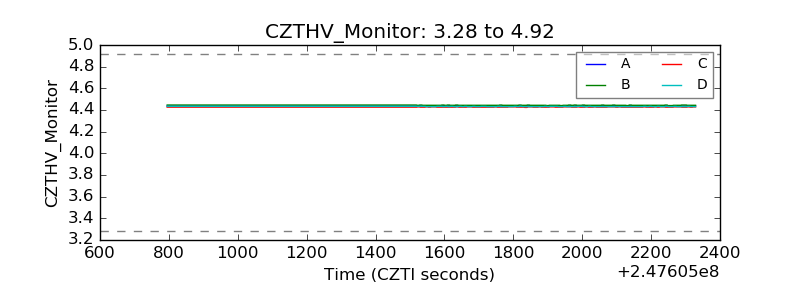 |
| D_VDD | 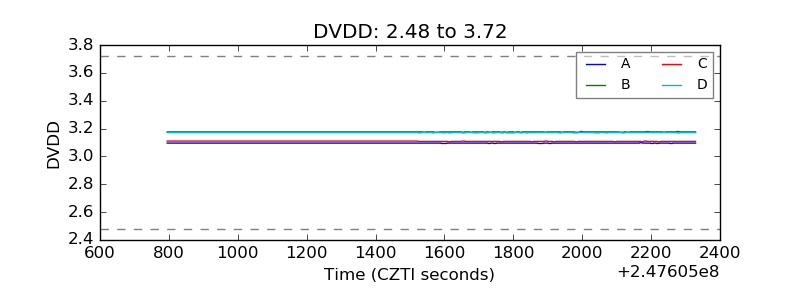 |
| Temperature 1 | 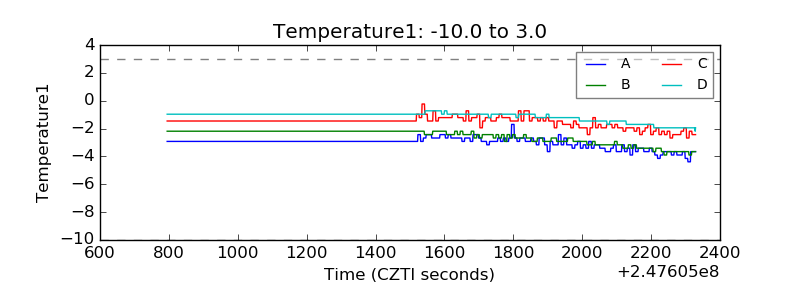 |
| Veto HV Monitor | 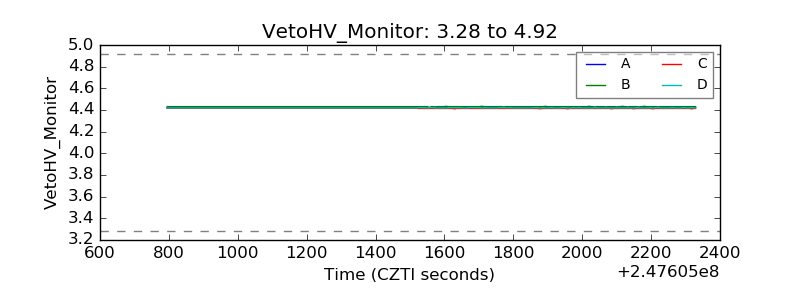 |
| Veto LLD | 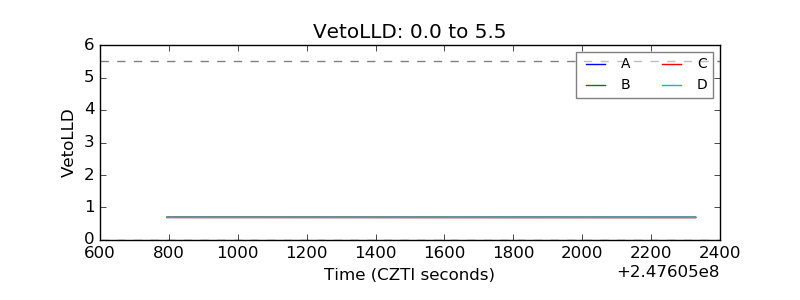 |
| Alpha Counter | 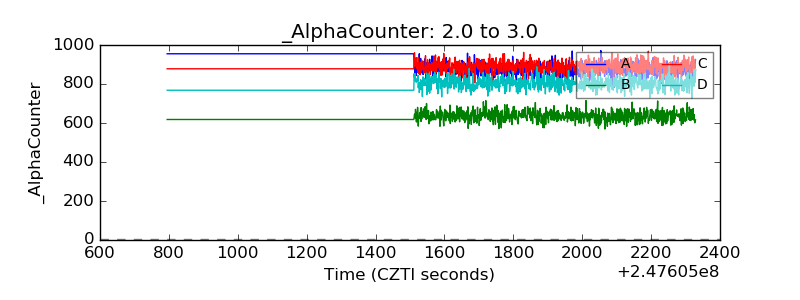 |
| _CPM_Rate | 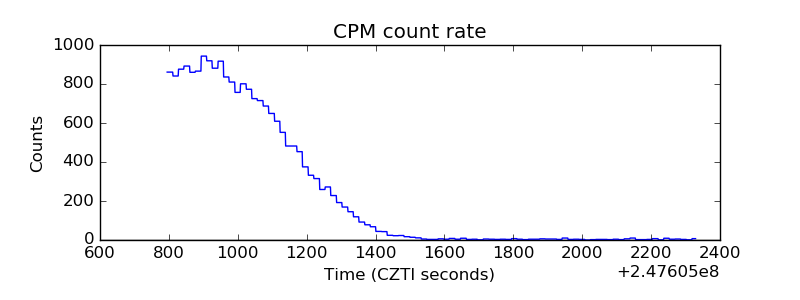 |
| CZT Counter | 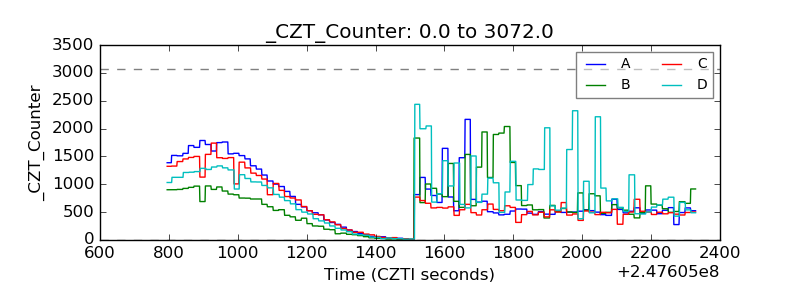 |
| +2.5 Volts monitor |  |
| +5 Volts monitor |  |
| _ROLL_ROT | 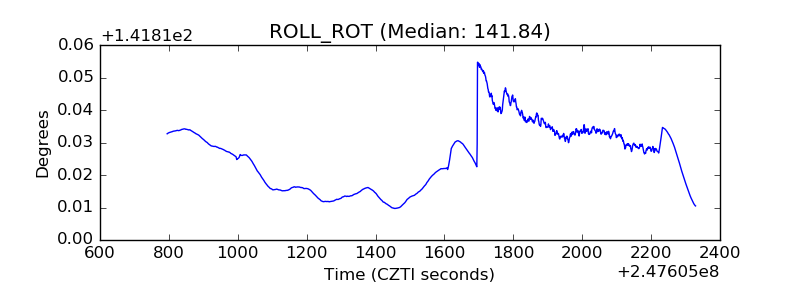 |
| _Roll_DEC | 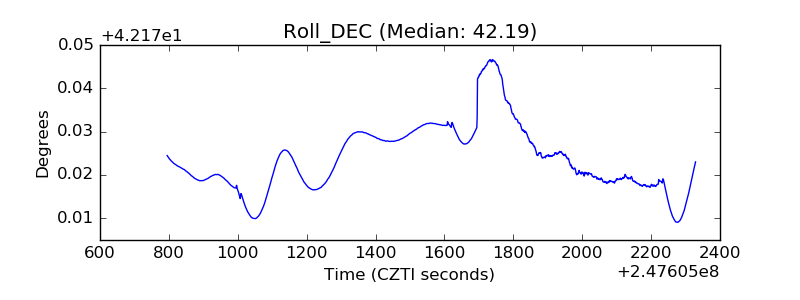 |
| _Roll_RA | 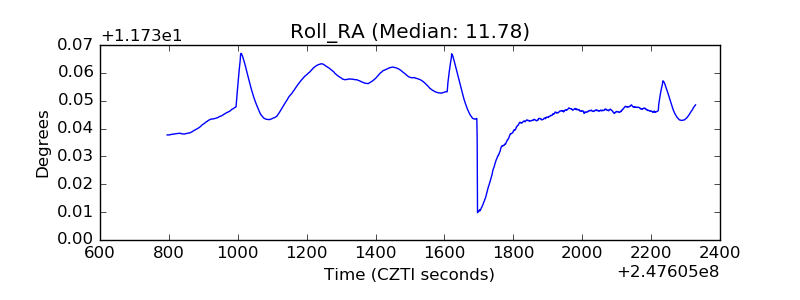 |
| Veto Counter | 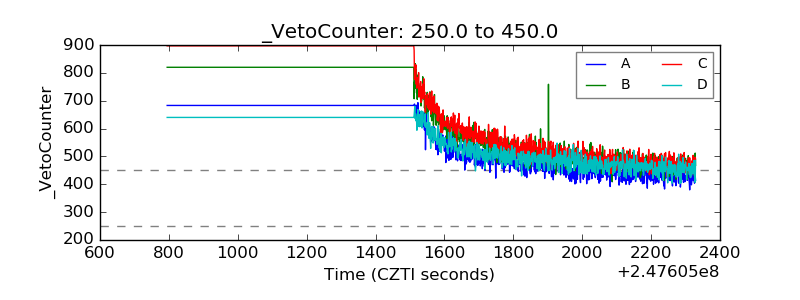 |