| Param | Original file | Final file |
|---|---|---|
| Filename | modeM0/AS1A04_022T04_9000001666cztM0_level2.fits | modeM0/AS1A04_022T04_9000001666cztM0_level2_quad_clean.evt |
| Size (bytes) | 575,040,960 | 580,348,800 |
| Size | 548.4 MB | 553.5 MB |
| Events in quadrant A | 3,476,100 | 3,390,522 |
| Events in quadrant B | 3,279,522 | 3,263,943 |
| Events in quadrant C | 3,498,940 | 3,601,557 |
| Events in quadrant D | 2,890,114 | 3,052,572 |
| Mode M9 | |||
|---|---|---|---|
| Quadrant | BADHDUFLAG | Total packets | Discarded packets |
| A | 0 | 79 | 0 |
| B | 0 | 79 | 0 |
| C | 0 | 79 | 0 |
| D | 0 | 79 | 0 |
| Mode SS | |||
|---|---|---|---|
| Quadrant | BADHDUFLAG | Total packets | Discarded packets |
| A | 0 | 1266 | 0 |
| B | 0 | 1266 | 0 |
| C | 0 | 1266 | 0 |
| D | 0 | 1266 | 0 |
| Mode M0 | |||
|---|---|---|---|
| Quadrant | BADHDUFLAG | Total packets | Discarded packets |
| A | 0 | 145813 | 0 |
| B | 0 | 163554 | 0 |
| C | 0 | 127999 | 0 |
| D | 0 | 176359 | 0 |
| Quadrant | Total seconds | Saturated seconds | Saturation percentage |
|---|---|---|---|
| A | 62209 | 1719 | 2.763266% |
| B | 62209 | 3888 | 6.249900% |
| C | 62209 | 445 | 0.715331% |
| D | 62209 | 4516 | 7.259400% |
Noise dominated data is calculated using 1-second bins in cleaned event files. If a bin has >2000 counts, and if more than 50% of those come from <1% of pixels, then it is considered to be noise-dominated and hence unusable.
| Quadrant | # 1 sec bins | Bins with >0 counts | Bins with >2000 counts | High rate bins dominated by noise | Noise dominated (total time) | Noise dominated (detector-on time) | Marked lightcurve |
|---|---|---|---|---|---|---|---|
| A | 70104 | 62197 | 0 | 0 | 0.00% | 0.00% |  |
| B | 70104 | 62205 | 0 | 0 | 0.00% | 0.00% |  |
| C | 70104 | 62209 | 0 | 0 | 0.00% | 0.00% |  |
| D | 70104 | 61573 | 0 | 0 | 0.00% | 0.00% |  |
Top three noisy pixels from each quadrant. If the there are fewer than three noisy pixels in the level2.evt file, extra rows are filled as -1
| Pixel properties | Quadrant properties | ||||||
|---|---|---|---|---|---|---|---|
| Quadrant | DetID | PixID | Counts | Sigma | Mean | Median | Sigma |
| A | 0 | 29 | 3271 | 10.64 | 904 | 844 | 228.1 |
| A | 7 | 110 | 2769 | 8.44 | 904 | 844 | 228.1 |
| A | 9 | 19 | 2664 | 7.98 | 904 | 844 | 228.1 |
| B | 2 | 9 | 2886 | 11.87 | 866 | 824 | 173.7 |
| B | 3 | 17 | 2213 | 8.0 | 866 | 824 | 173.7 |
| B | 2 | 8 | 2160 | 7.69 | 866 | 824 | 173.7 |
| C | 1 | 80 | 2592 | 7.23 | 921 | 855 | 240.4 |
| C | 12 | 250 | 2577 | 7.16 | 921 | 855 | 240.4 |
| C | 1 | 81 | 2549 | 7.05 | 921 | 855 | 240.4 |
| D | 3 | 14 | 2163 | 6.34 | 824 | 749 | 223.0 |
| D | 6 | 231 | 2113 | 6.11 | 824 | 749 | 223.0 |
| D | 1 | 19 | 2071 | 5.93 | 824 | 749 | 223.0 |
Histogram calculated using DETX and DETY for each event in the final _common_clean file
| Quadrant A | 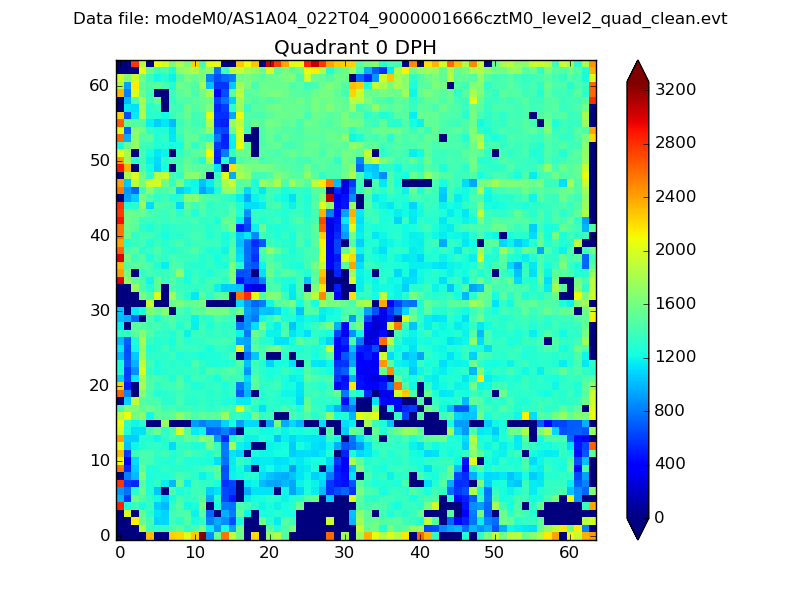 |
 |
Quadrant B |
|---|---|---|---|
| Quadrant D |  |
 |
Quadrant C |
| Plot type | Count rate plots | Images |
|---|---|---|
| Comparison with Poisson distribution Blue bars denote a histogram of data divided into 1 sec bins. Red curve is a Poisson curve with rate = median count rate of data. |
 |
 |
| Quadrant-wise count rates Data is divided into 100 sec bins |
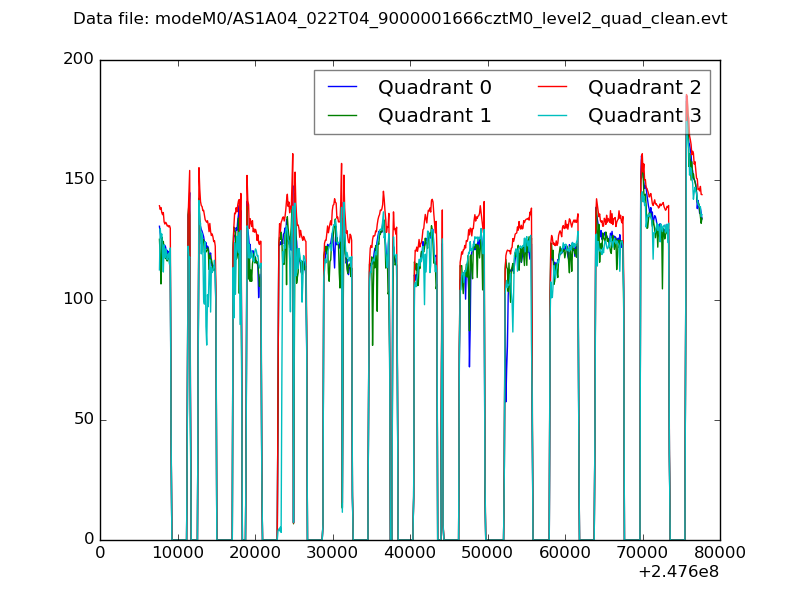 |
|
| Module-wise count rates for Quadrant A Data is divided into 100 sec bins |
 |
 |
| Module-wise count rates for Quadrant B Data is divided into 100 sec bins |
 |
 |
| Module-wise count rates for Quadrant C Data is divided into 100 sec bins |
 |
 |
| Module-wise count rates for Quadrant D Data is divided into 100 sec bins |
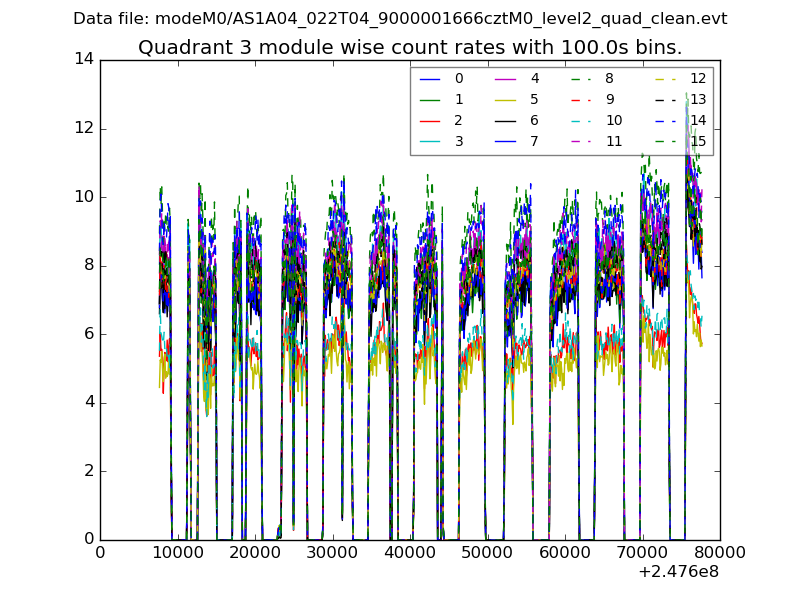 |
 |
| Parameter | Plot |
|---|---|
| CZT HV Monitor |  |
| D_VDD | 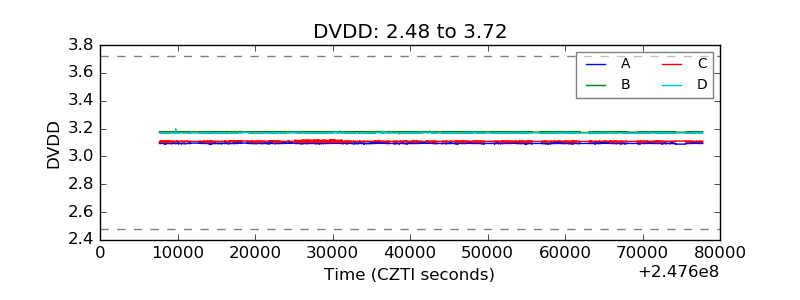 |
| Temperature 1 |  |
| Veto HV Monitor |  |
| Veto LLD |  |
| Alpha Counter |  |
| _CPM_Rate |  |
| CZT Counter |  |
| +2.5 Volts monitor |  |
| +5 Volts monitor |  |
| _ROLL_ROT |  |
| _Roll_DEC |  |
| _Roll_RA |  |
| Veto Counter |  |