| Param | Original file | Final file |
|---|---|---|
| Filename | modeM0/AS1A04_022T04_9000001666_11393cztM0_level2.evt | modeM0/AS1A04_022T04_9000001666_11393cztM0_level2_quad_clean.evt |
| Size (bytes) | 430,891,200 | 65,891,520 |
| Size | 410.9 MB | 62.8 MB |
| Events in quadrant A | 2,654,932 | 406,332 |
| Events in quadrant B | 3,707,433 | 396,035 |
| Events in quadrant C | 2,434,200 | 440,527 |
| Events in quadrant D | 3,890,679 | 378,927 |
| Mode M9 | |||
|---|---|---|---|
| Quadrant | BADHDUFLAG | Total packets | Discarded packets |
| A | 0 | 10 | 0 |
| B | 0 | 10 | 0 |
| C | 0 | 10 | 0 |
| D | 0 | 10 | 0 |
| Mode SS | |||
|---|---|---|---|
| Quadrant | BADHDUFLAG | Total packets | Discarded packets |
| A | 0 | 110 | 0 |
| B | 0 | 110 | 0 |
| C | 0 | 110 | 0 |
| D | 0 | 110 | 0 |
| Mode M0 | |||
|---|---|---|---|
| Quadrant | BADHDUFLAG | Total packets | Discarded packets |
| A | 0 | 11497 | 2 |
| B | 0 | 14673 | 1 |
| C | 0 | 10941 | 1 |
| D | 0 | 15267 | 1 |
| Quadrant | Total seconds | Saturated seconds | Saturation percentage |
|---|---|---|---|
| A | 5323 | 38 | 0.713883% |
| B | 5323 | 316 | 5.936502% |
| C | 5323 | 21 | 0.394514% |
| D | 5323 | 430 | 8.078151% |
Noise dominated data is calculated using 1-second bins in cleaned event files. If a bin has >2000 counts, and if more than 50% of those come from <1% of pixels, then it is considered to be noise-dominated and hence unusable.
| Quadrant | # 1 sec bins | Bins with >0 counts | Bins with >2000 counts | High rate bins dominated by noise | Noise dominated (total time) | Noise dominated (detector-on time) | Marked lightcurve |
|---|---|---|---|---|---|---|---|
| A | 6333 | 5324 | 4 | 4 | 0.06% | 0.08% | 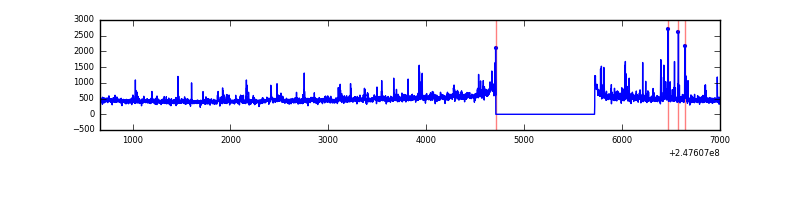 |
| B | 6333 | 5324 | 138 | 138 | 2.18% | 2.59% | 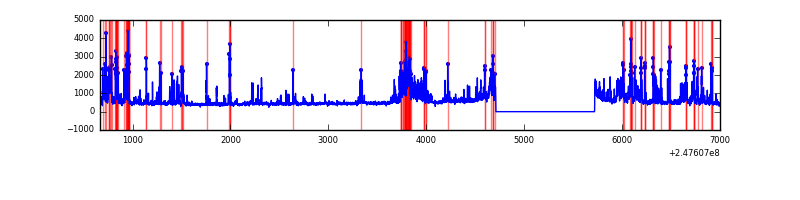 |
| C | 6333 | 5324 | 0 | 0 | 0.00% | 0.00% | 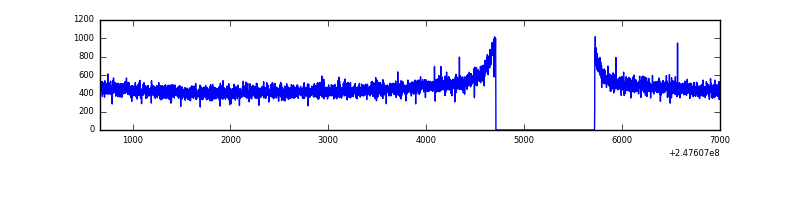 |
| D | 6333 | 5324 | 337 | 337 | 5.32% | 6.33% | 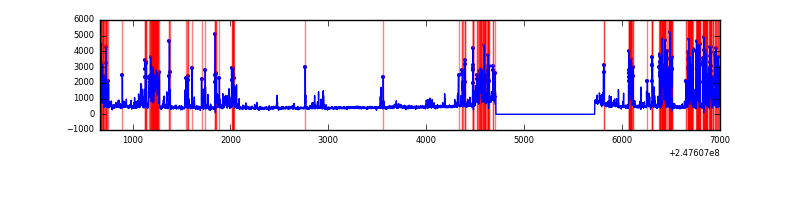 |
Top three noisy pixels from each quadrant. If the there are fewer than three noisy pixels in the level2.evt file, extra rows are filled as -1
| Pixel properties | Quadrant properties | ||||||
|---|---|---|---|---|---|---|---|
| Quadrant | DetID | PixID | Counts | Sigma | Mean | Median | Sigma |
| A | 8 | 5 | 219189 | 1718.66 | 621 | 608 | 127.2 |
| A | 11 | 29 | 10697 | 79.33 | 621 | 608 | 127.2 |
| A | 1 | 162 | 10458 | 77.45 | 621 | 608 | 127.2 |
| B | 4 | 239 | 1075804 | 9285.18 | 612 | 596 | 115.8 |
| B | 11 | 51 | 145952 | 1255.25 | 612 | 596 | 115.8 |
| B | 15 | 204 | 47823 | 407.84 | 612 | 596 | 115.8 |
| C | 13 | 61 | 4523 | 26.64 | 624 | 629 | 146.2 |
| C | 3 | 202 | 1555 | 6.33 | 624 | 629 | 146.2 |
| C | 3 | 203 | 1363 | 5.02 | 624 | 629 | 146.2 |
| D | 10 | 253 | 1127392 | 7884.05 | 592 | 576 | 142.9 |
| D | 13 | 104 | 155296 | 1082.54 | 592 | 576 | 142.9 |
| D | 1 | 52 | 142900 | 995.81 | 592 | 576 | 142.9 |
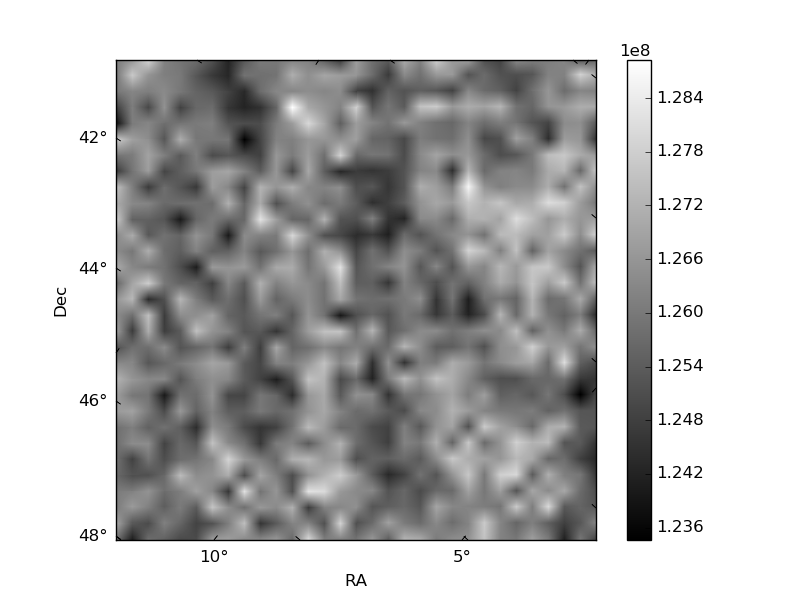
Histogram calculated using DETX and DETY for each event in the final _common_clean file
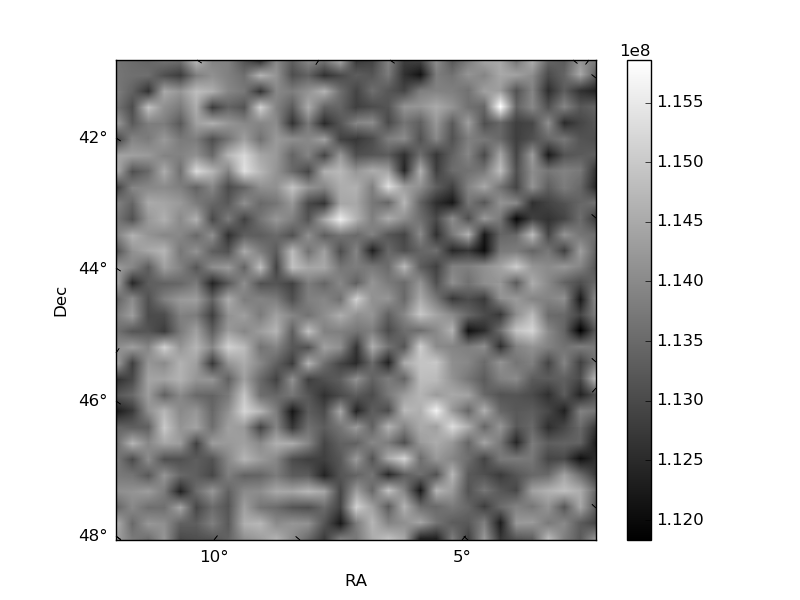
| Quadrant A | 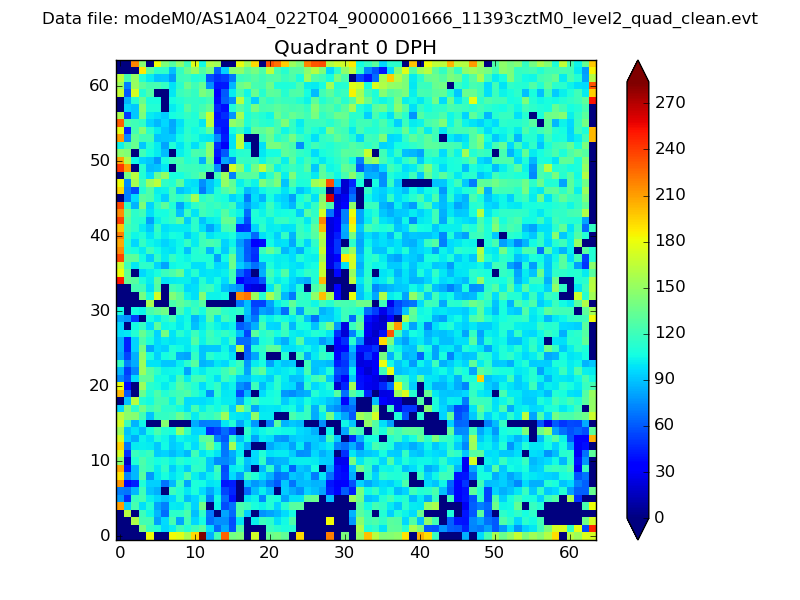 |
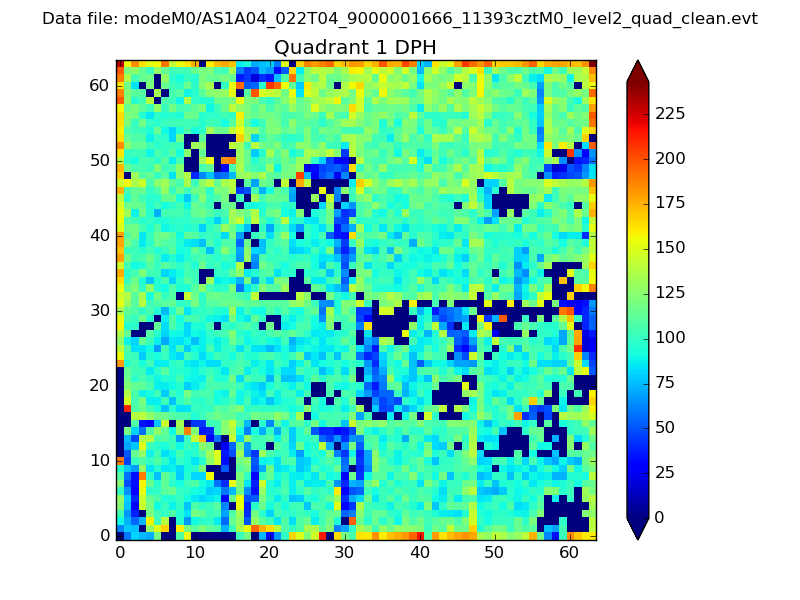 |
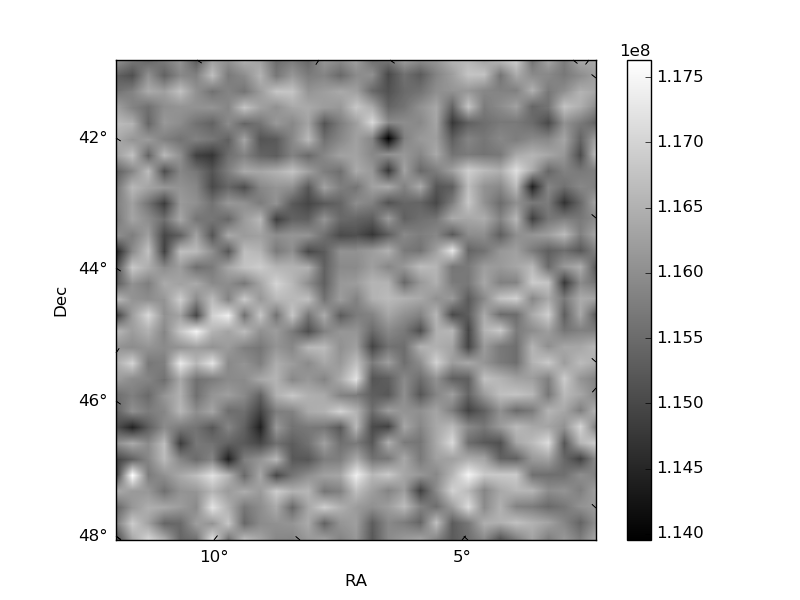
Quadrant B |
|---|---|---|---|
| Quadrant D | 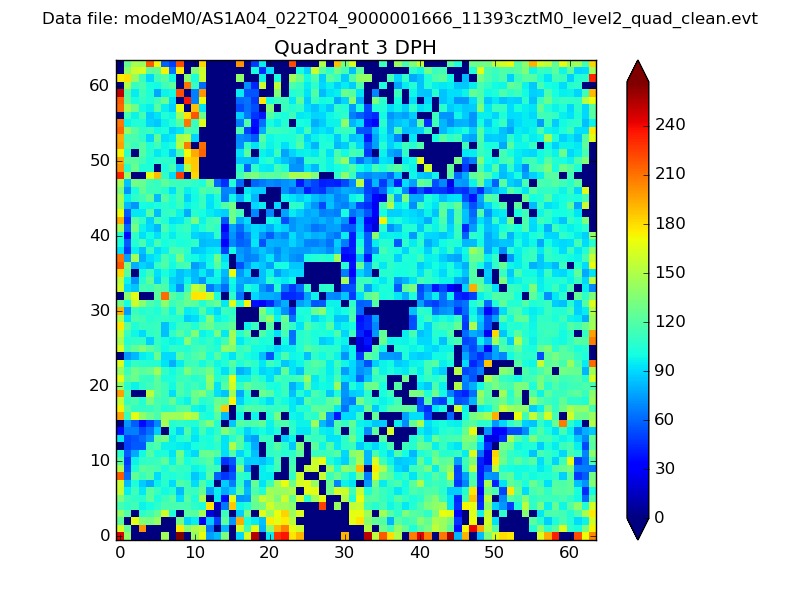 |
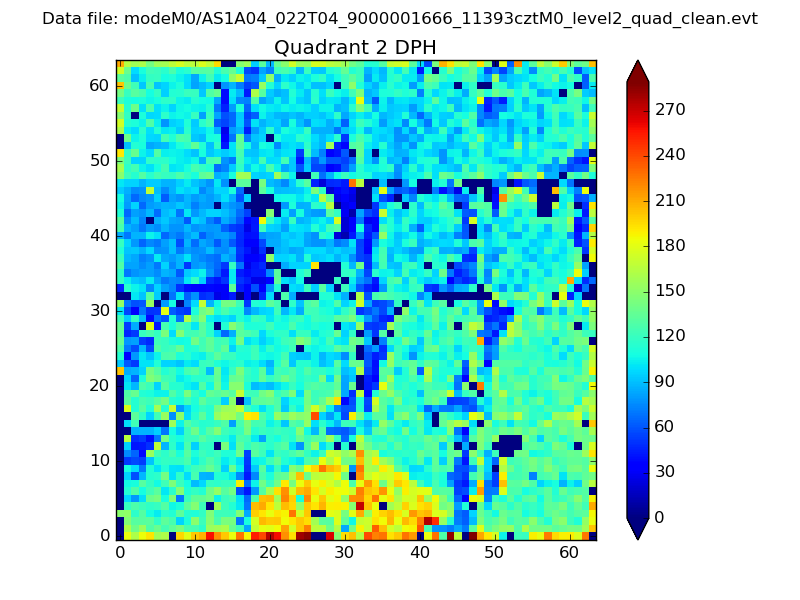 |
Quadrant C |
| Plot type | Count rate plots | Images |
|---|---|---|
| Comparison with Poisson distribution Blue bars denote a histogram of data divided into 1 sec bins. Red curve is a Poisson curve with rate = median count rate of data. |
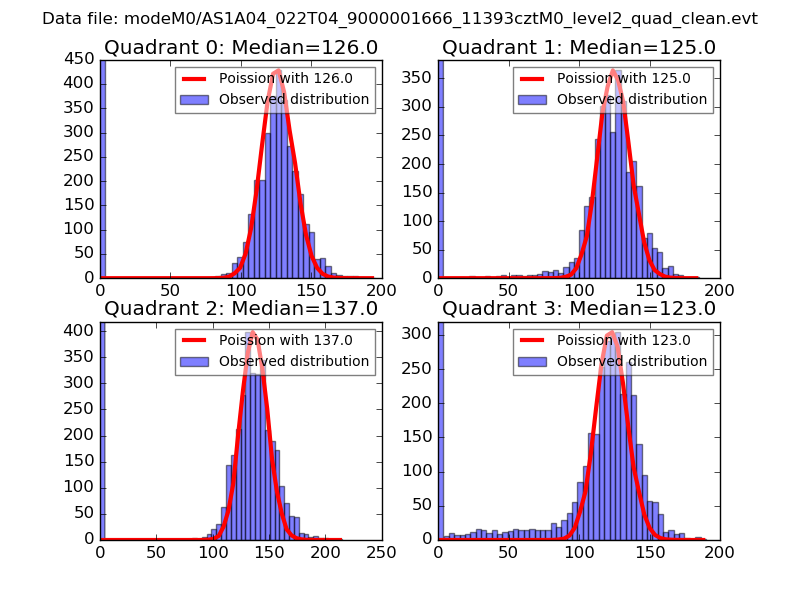 |
 |
| Quadrant-wise count rates Data is divided into 100 sec bins |
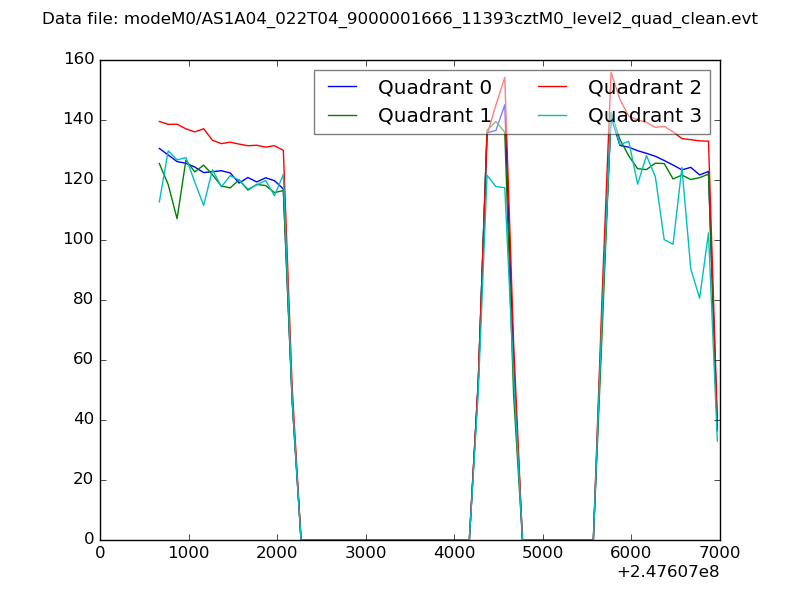 |
|
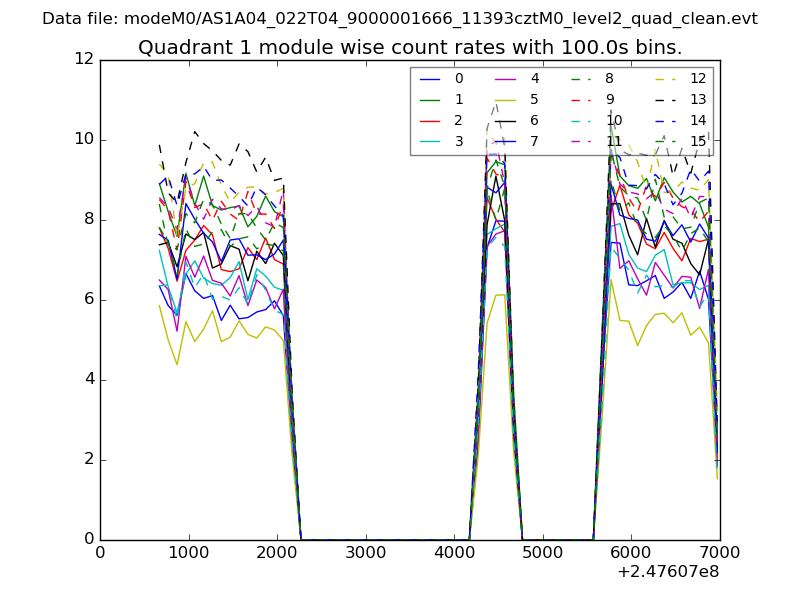
| Module-wise count rates for Quadrant A Data is divided into 100 sec bins |
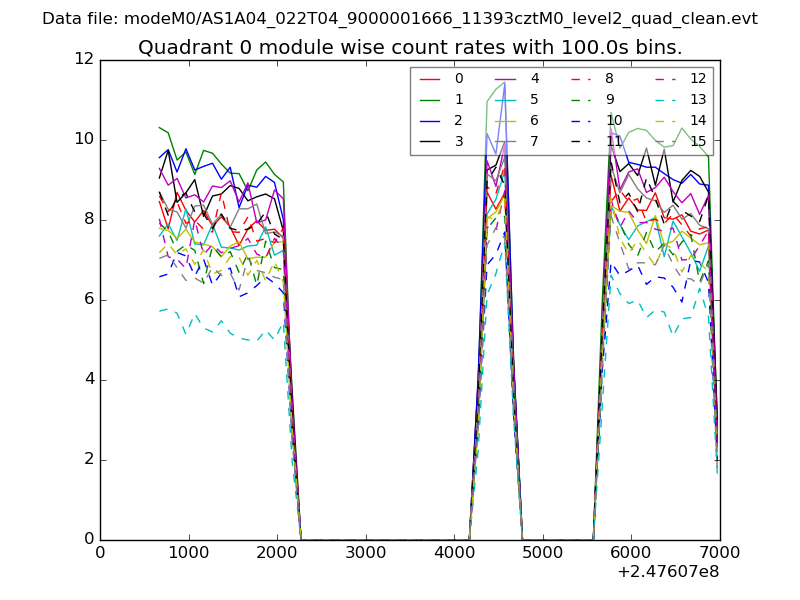 |
 |
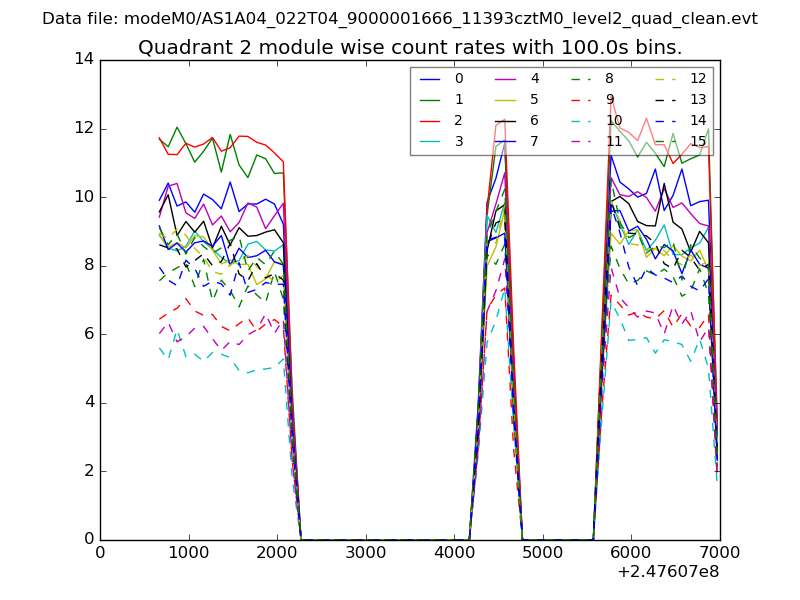
| Module-wise count rates for Quadrant B Data is divided into 100 sec bins |
 |
 |
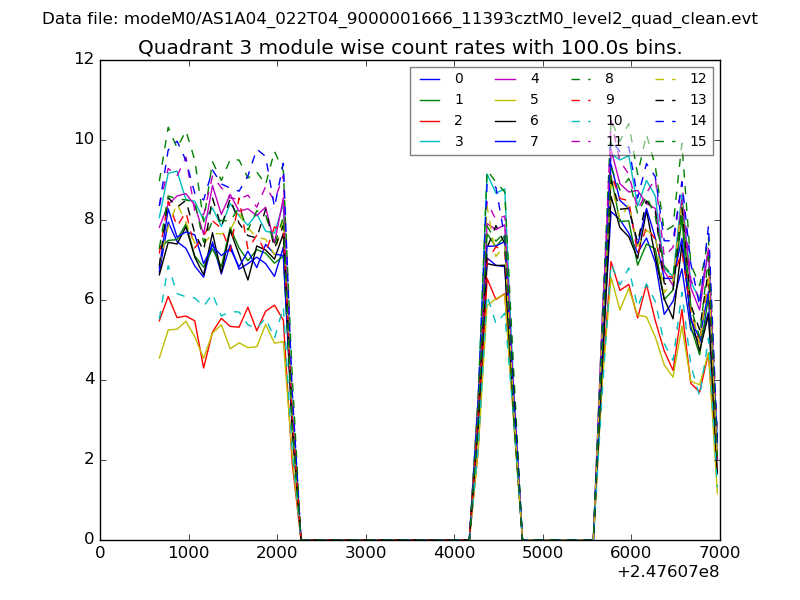
| Module-wise count rates for Quadrant C Data is divided into 100 sec bins |
 |
 |
| Module-wise count rates for Quadrant D Data is divided into 100 sec bins |
 |
 |
| Parameter | Plot |
|---|---|
| CZT HV Monitor | 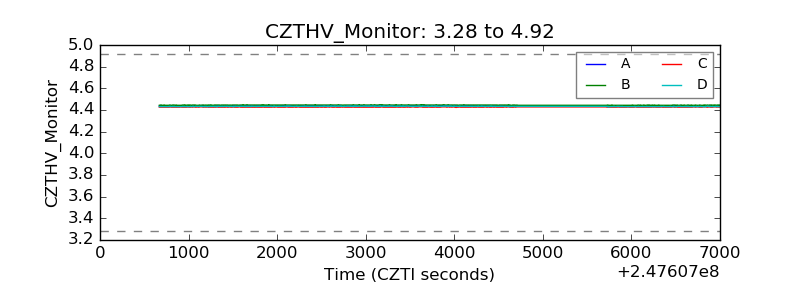 |
| D_VDD | 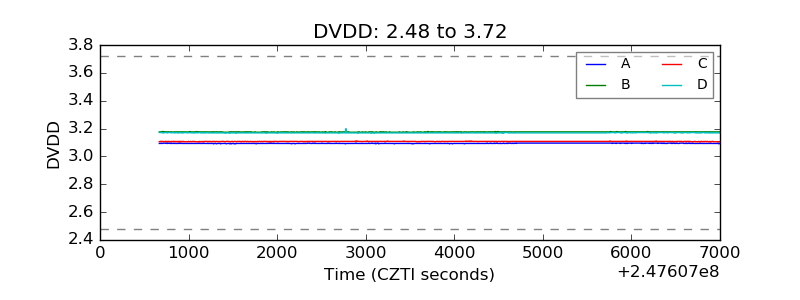 |
| Temperature 1 | 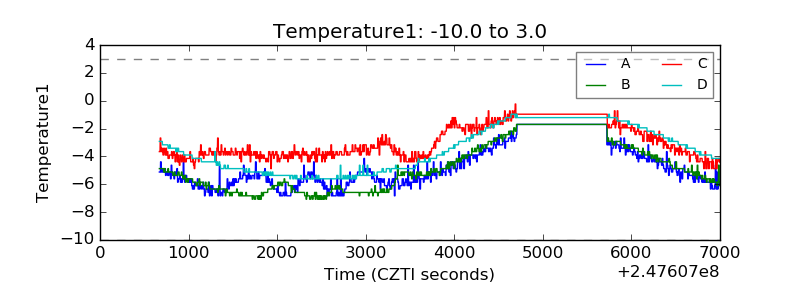 |
| Veto HV Monitor | 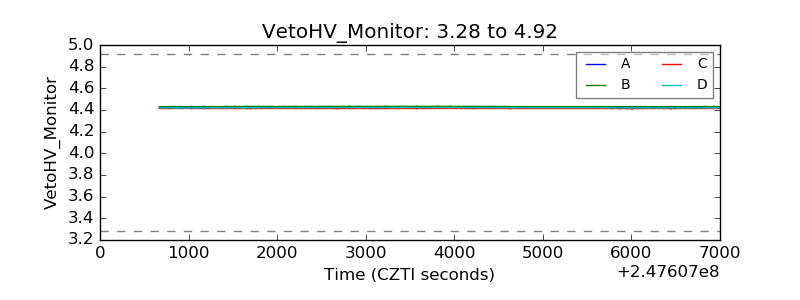 |
| Veto LLD | 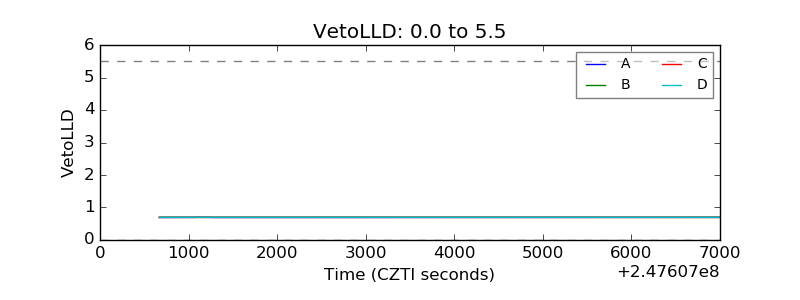 |
| Alpha Counter | 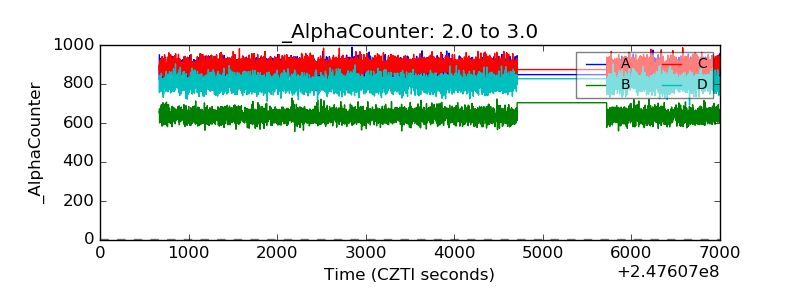 |
| _CPM_Rate |  |
| CZT Counter | 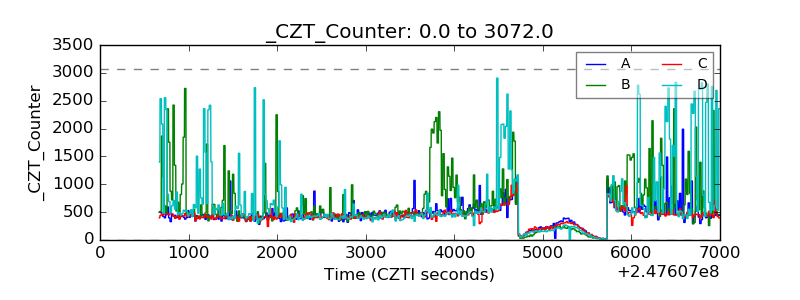 |
| +2.5 Volts monitor |  |
| +5 Volts monitor |  |
| _ROLL_ROT | 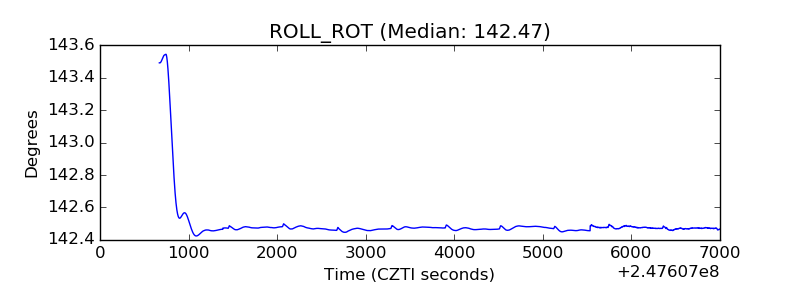 |
| _Roll_DEC | 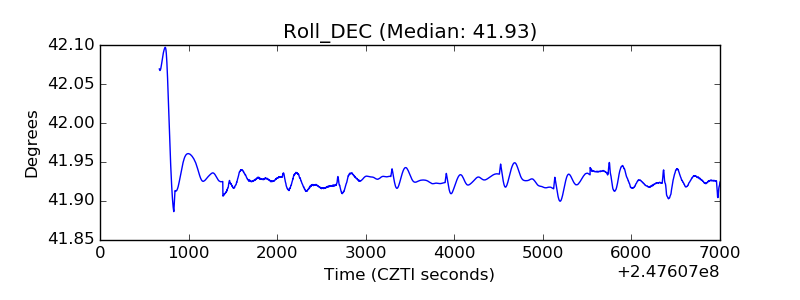 |
| _Roll_RA |  |
| Veto Counter | 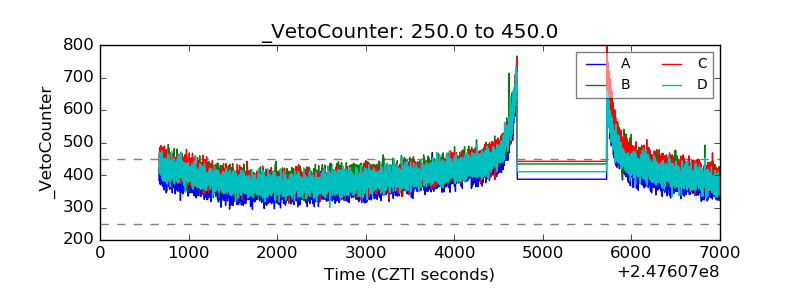 |