| Param | Original file | Final file |
|---|---|---|
| Filename | modeM0/AS1A04_022T04_9000001666_11394cztM0_level2.evt | modeM0/AS1A04_022T04_9000001666_11394cztM0_level2_quad_clean.evt |
| Size (bytes) | 617,618,880 | 100,045,440 |
| Size | 589.0 MB | 95.4 MB |
| Events in quadrant A | 3,762,361 | 637,163 |
| Events in quadrant B | 5,198,297 | 612,415 |
| Events in quadrant C | 3,444,436 | 686,869 |
| Events in quadrant D | 5,811,857 | 591,673 |
| Mode M9 | |||
|---|---|---|---|
| Quadrant | BADHDUFLAG | Total packets | Discarded packets |
| A | 0 | 16 | 0 |
| B | 0 | 16 | 0 |
| C | 0 | 16 | 0 |
| D | 0 | 16 | 0 |
| Mode SS | |||
|---|---|---|---|
| Quadrant | BADHDUFLAG | Total packets | Discarded packets |
| A | 0 | 148 | 0 |
| B | 0 | 148 | 0 |
| C | 0 | 148 | 0 |
| D | 0 | 148 | 0 |
| Mode M0 | |||
|---|---|---|---|
| Quadrant | BADHDUFLAG | Total packets | Discarded packets |
| A | 0 | 16046 | 3 |
| B | 0 | 20444 | 2 |
| C | 0 | 15303 | 2 |
| D | 0 | 22382 | 2 |
| Quadrant | Total seconds | Saturated seconds | Saturation percentage |
|---|---|---|---|
| A | 7196 | 85 | 1.181212% |
| B | 7196 | 608 | 8.449138% |
| C | 7196 | 74 | 1.028349% |
| D | 7196 | 732 | 10.172318% |
Noise dominated data is calculated using 1-second bins in cleaned event files. If a bin has >2000 counts, and if more than 50% of those come from <1% of pixels, then it is considered to be noise-dominated and hence unusable.
| Quadrant | # 1 sec bins | Bins with >0 counts | Bins with >2000 counts | High rate bins dominated by noise | Noise dominated (total time) | Noise dominated (detector-on time) | Marked lightcurve |
|---|---|---|---|---|---|---|---|
| A | 8811 | 7198 | 20 | 20 | 0.23% | 0.28% | 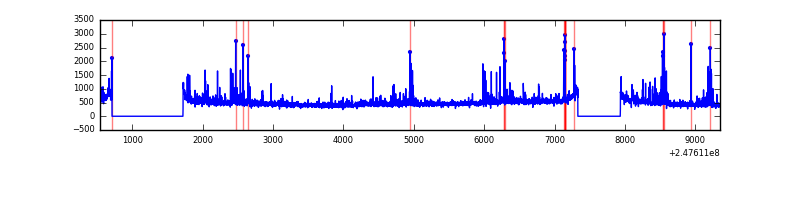 |
| B | 8811 | 7197 | 268 | 268 | 3.04% | 3.72% | 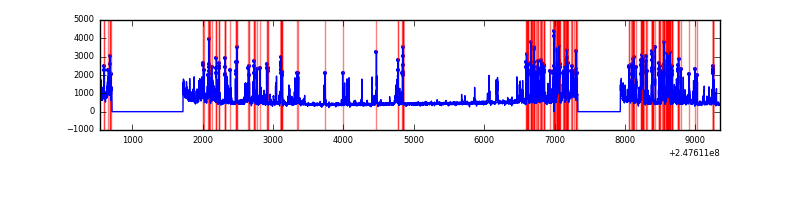 |
| C | 8811 | 7198 | 15 | 15 | 0.17% | 0.21% | 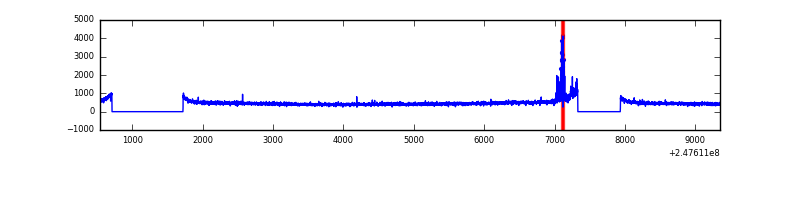 |
| D | 8811 | 7198 | 553 | 553 | 6.28% | 7.68% | 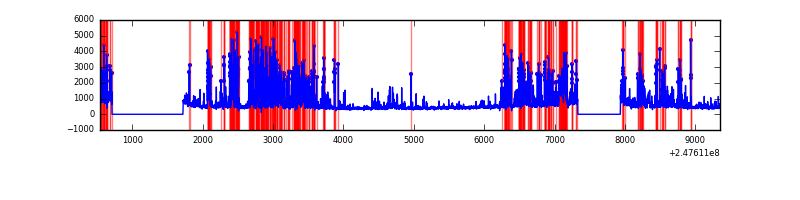 |
Top three noisy pixels from each quadrant. If the there are fewer than three noisy pixels in the level2.evt file, extra rows are filled as -1
| Pixel properties | Quadrant properties | ||||||
|---|---|---|---|---|---|---|---|
| Quadrant | DetID | PixID | Counts | Sigma | Mean | Median | Sigma |
| A | 8 | 5 | 396187 | 2292.5 | 848 | 827 | 172.5 |
| A | 1 | 162 | 31136 | 175.75 | 848 | 827 | 172.5 |
| A | 1 | 178 | 18356 | 101.64 | 848 | 827 | 172.5 |
| B | 4 | 239 | 1753250 | 11144.86 | 828 | 805 | 157.2 |
| B | 11 | 51 | 85690 | 539.83 | 828 | 805 | 157.2 |
| B | 15 | 204 | 53619 | 335.88 | 828 | 805 | 157.2 |
| C | 0 | 207 | 127944 | 637.88 | 850 | 854 | 199.2 |
| C | 13 | 61 | 6099 | 26.33 | 850 | 854 | 199.2 |
| C | 3 | 202 | 2073 | 6.12 | 850 | 854 | 199.2 |
| D | 10 | 253 | 1912774 | 9928.65 | 802 | 778 | 192.6 |
| D | 1 | 52 | 384436 | 1992.27 | 802 | 778 | 192.6 |
| D | 13 | 104 | 212497 | 1099.42 | 802 | 778 | 192.6 |
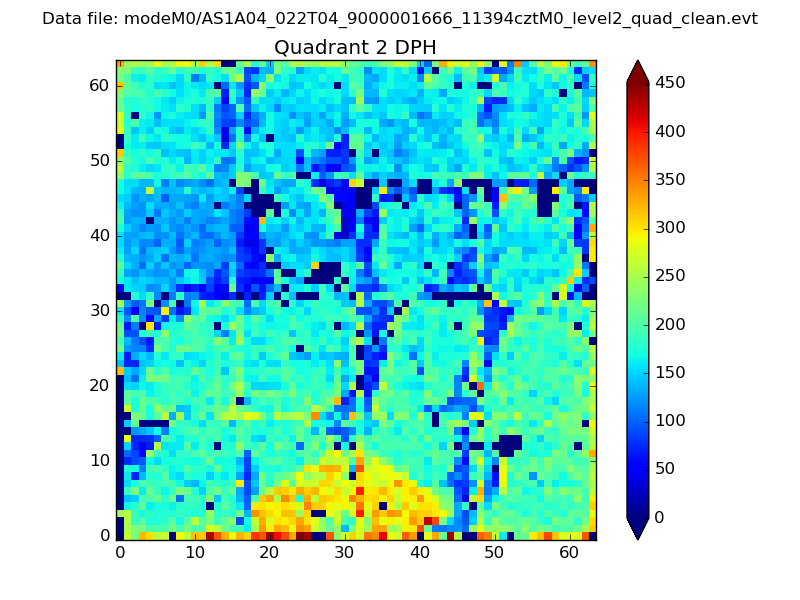
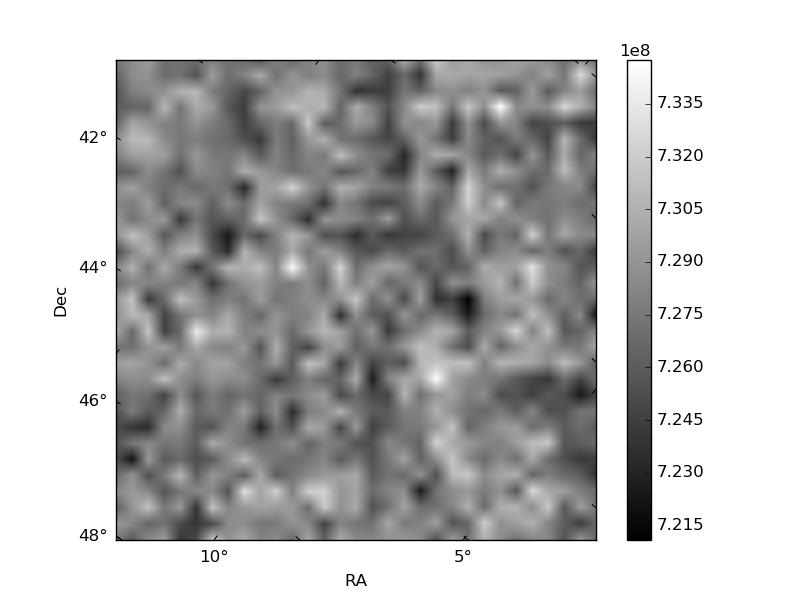
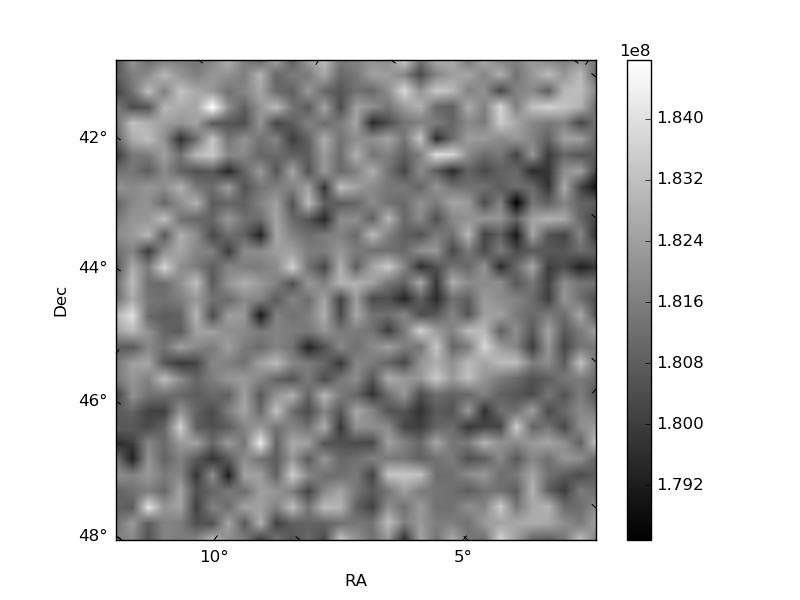
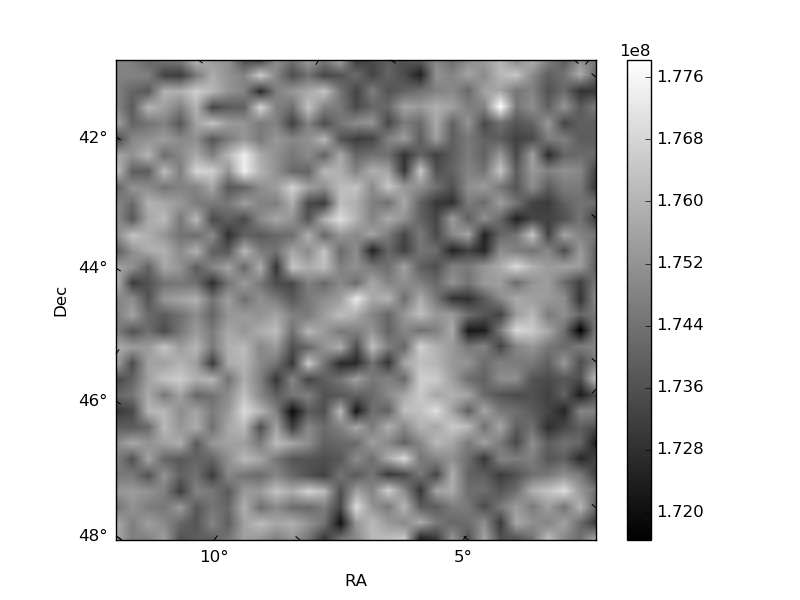
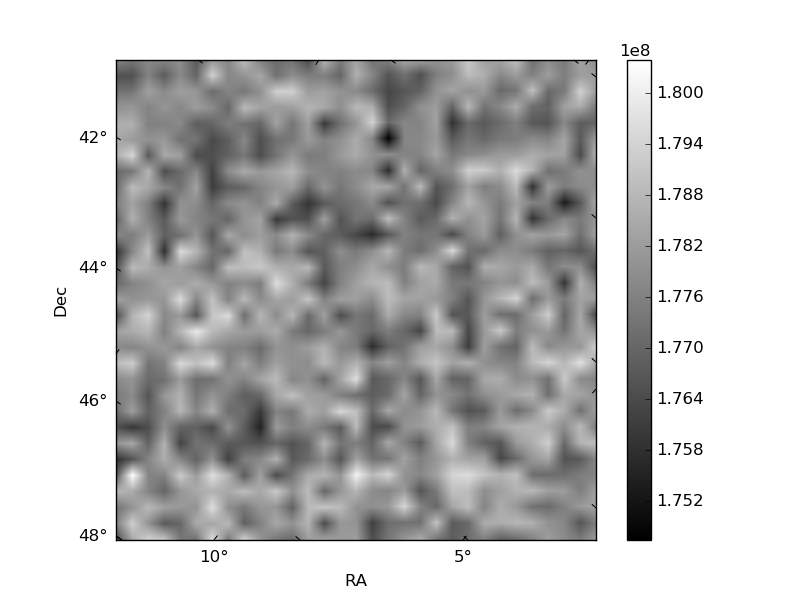
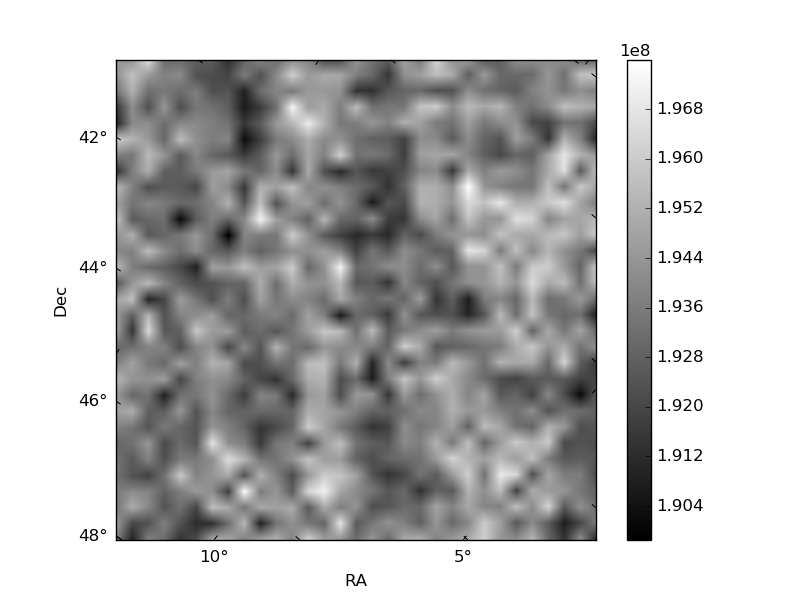
Histogram calculated using DETX and DETY for each event in the final _common_clean file
| Quadrant A | 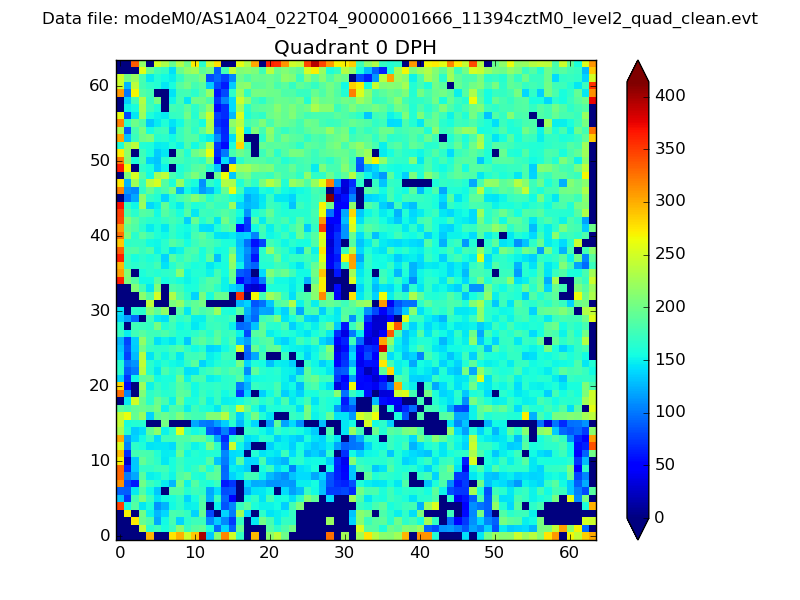 |
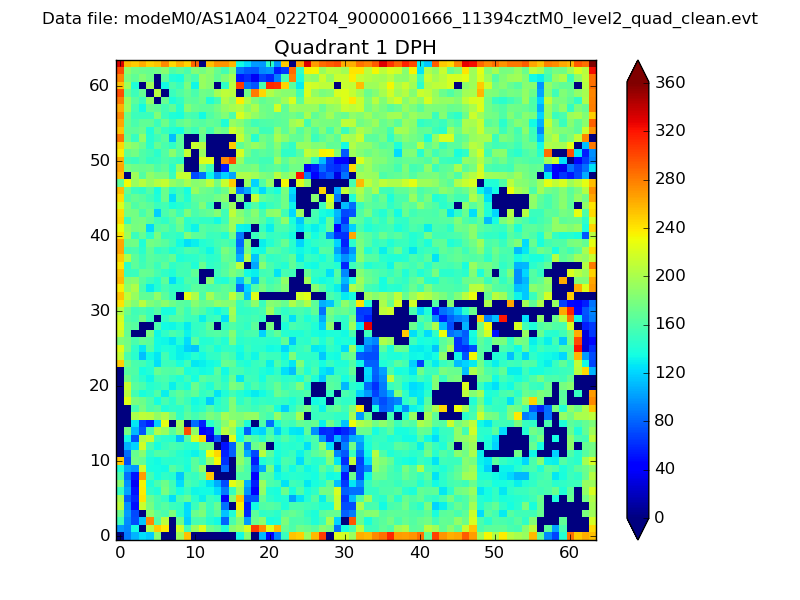 |
Quadrant B |
|---|---|---|---|
| Quadrant D | 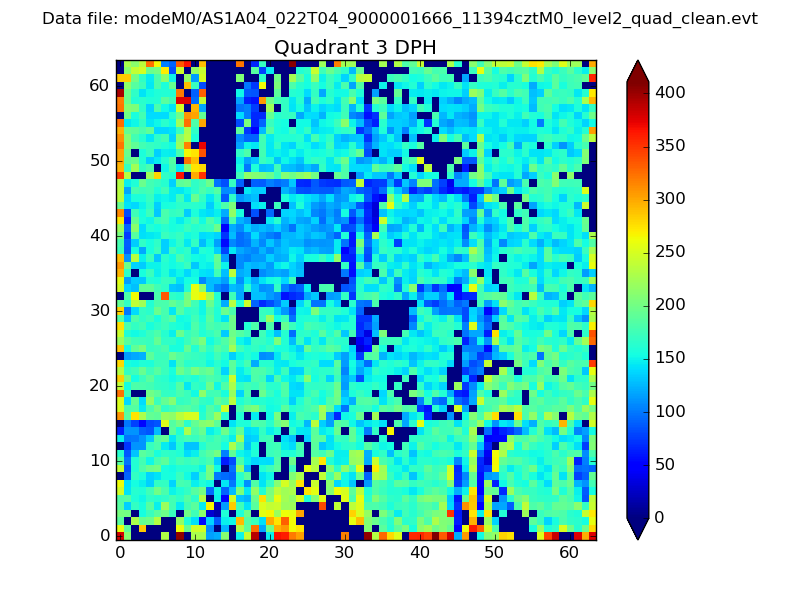 |
 |
Quadrant C |
| Plot type | Count rate plots | Images |
|---|---|---|
| Comparison with Poisson distribution Blue bars denote a histogram of data divided into 1 sec bins. Red curve is a Poisson curve with rate = median count rate of data. |
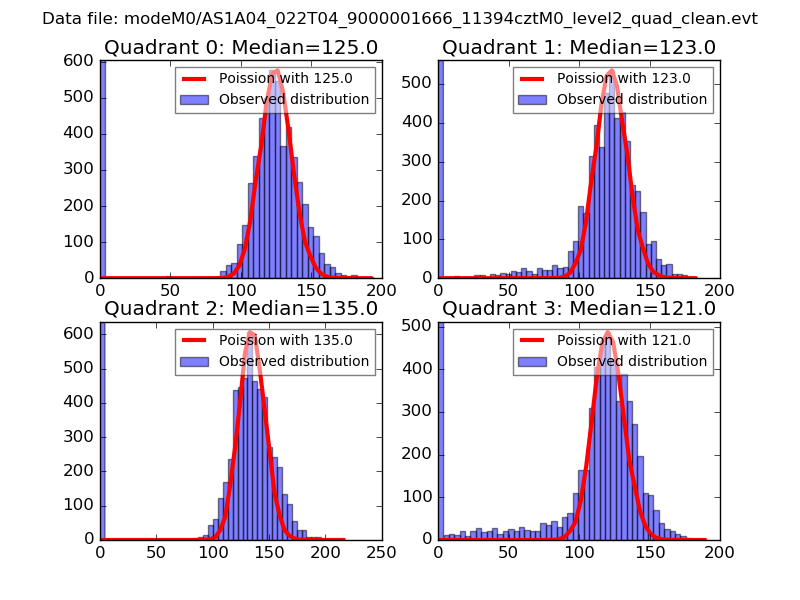 |
 |
| Quadrant-wise count rates Data is divided into 100 sec bins |
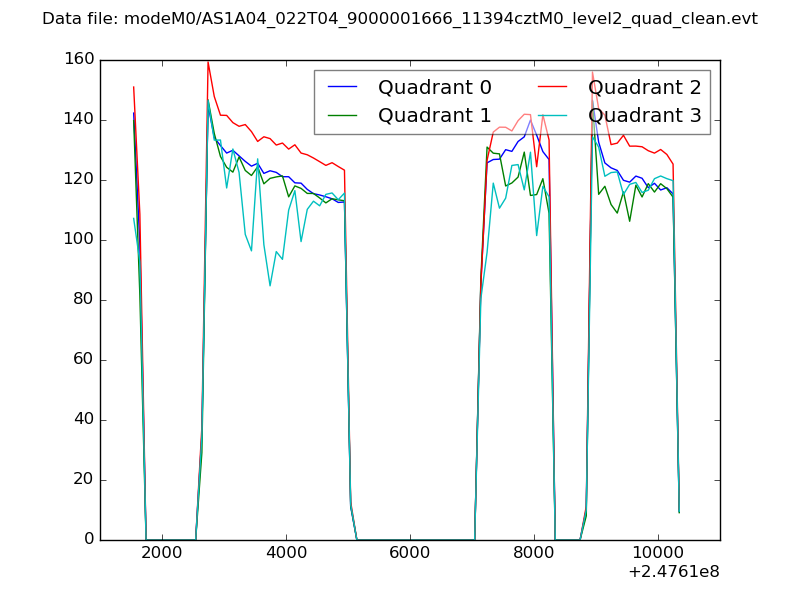 |
|
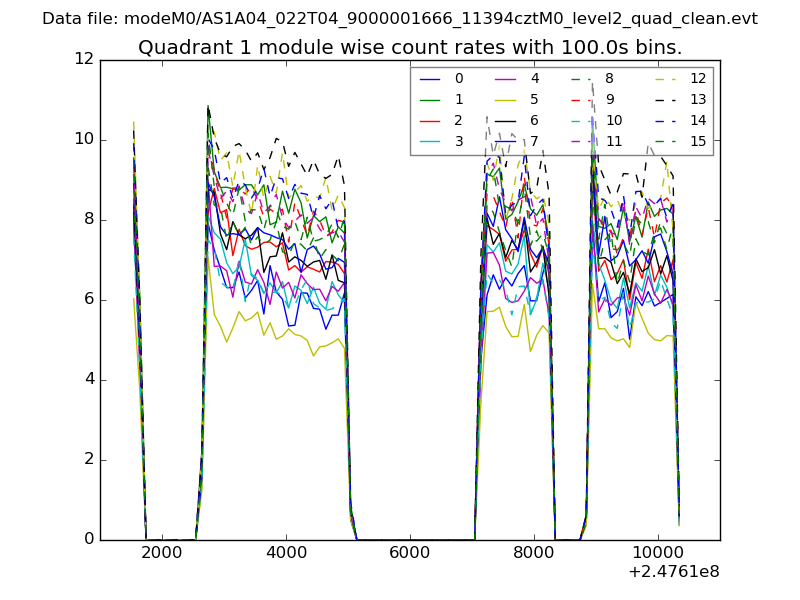
| Module-wise count rates for Quadrant A Data is divided into 100 sec bins |
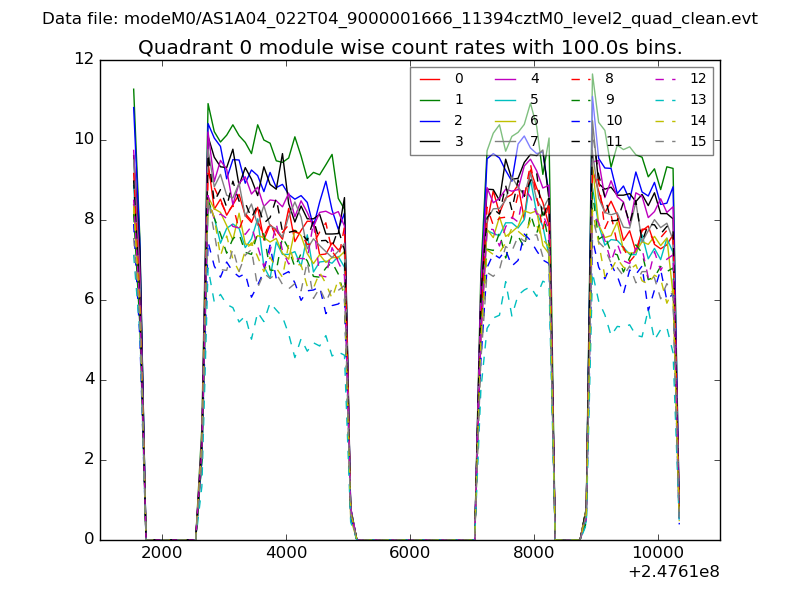 |
 |
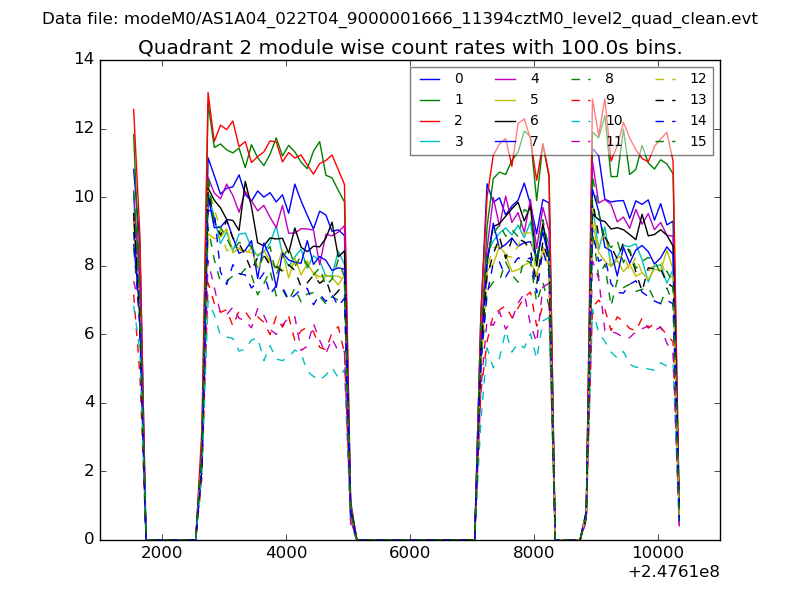
| Module-wise count rates for Quadrant B Data is divided into 100 sec bins |
 |
 |
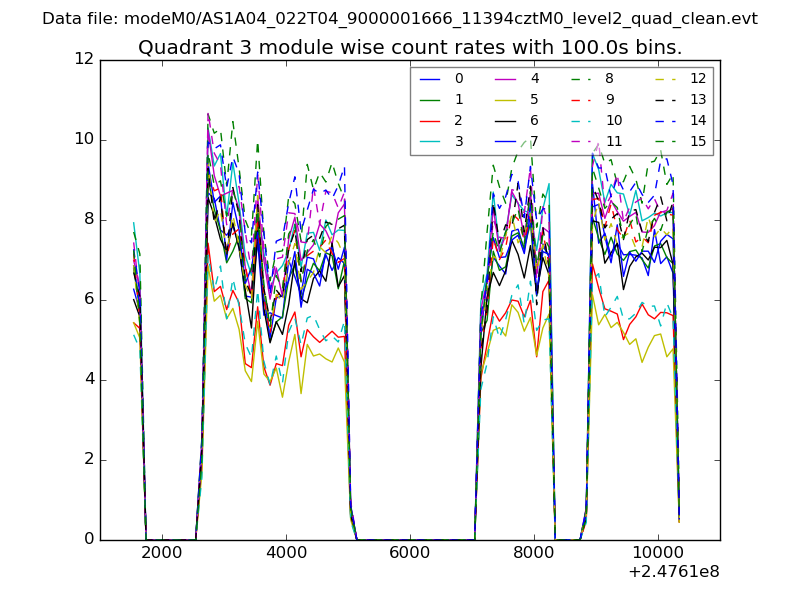
| Module-wise count rates for Quadrant C Data is divided into 100 sec bins |
 |
 |
| Module-wise count rates for Quadrant D Data is divided into 100 sec bins |
 |
 |
| Parameter | Plot |
|---|---|
| CZT HV Monitor | 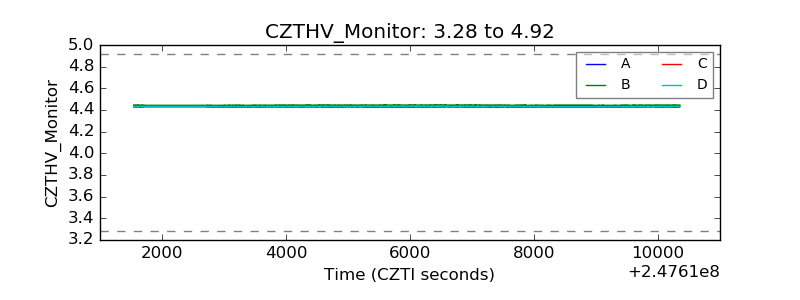 |
| D_VDD | 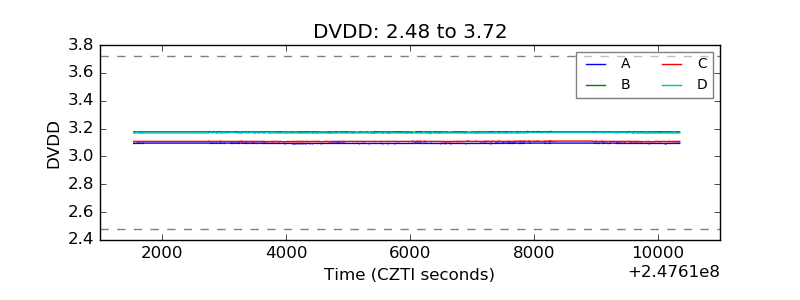 |
| Temperature 1 | 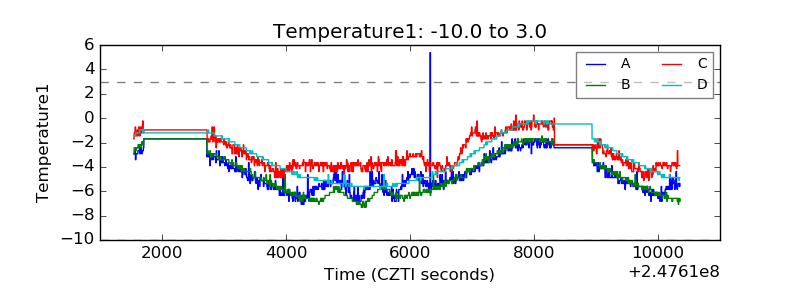 |
| Veto HV Monitor | 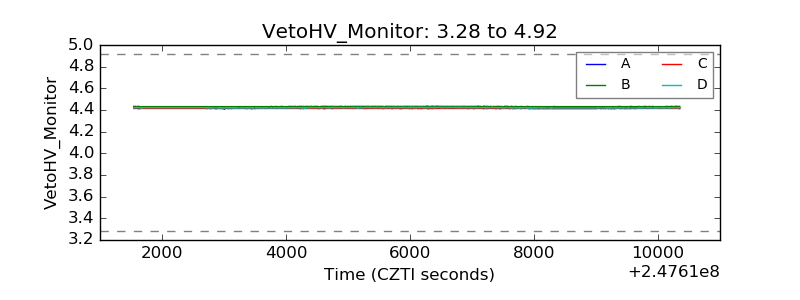 |
| Veto LLD | 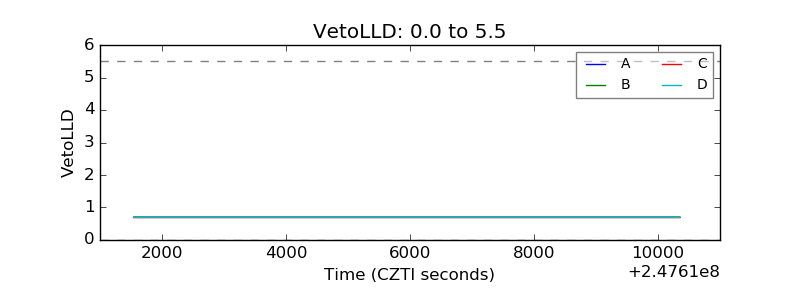 |
| Alpha Counter | 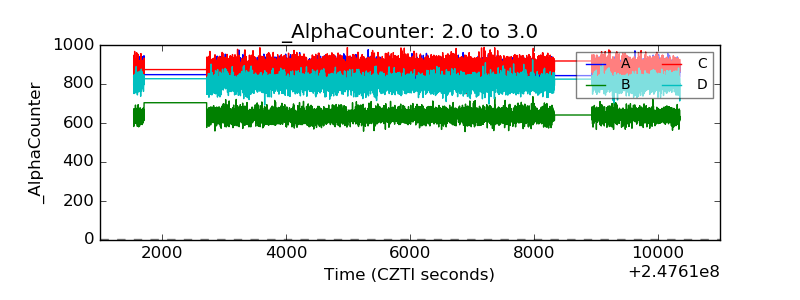 |
| _CPM_Rate | 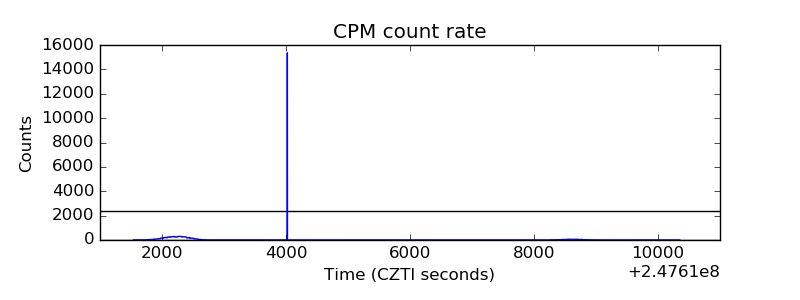 |
| CZT Counter | 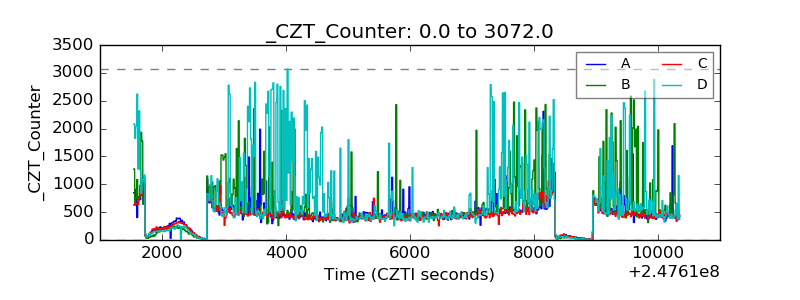 |
| +2.5 Volts monitor |  |
| +5 Volts monitor |  |
| _ROLL_ROT | 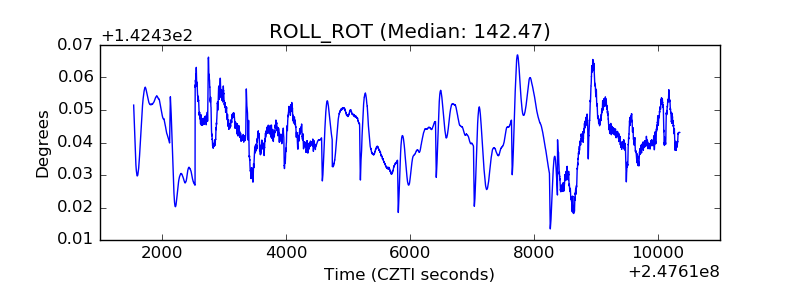 |
| _Roll_DEC | 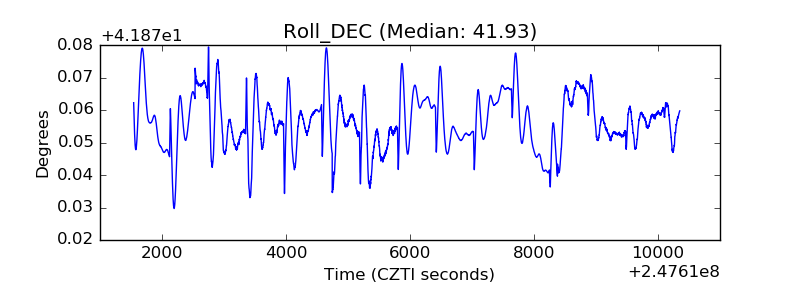 |
| _Roll_RA | 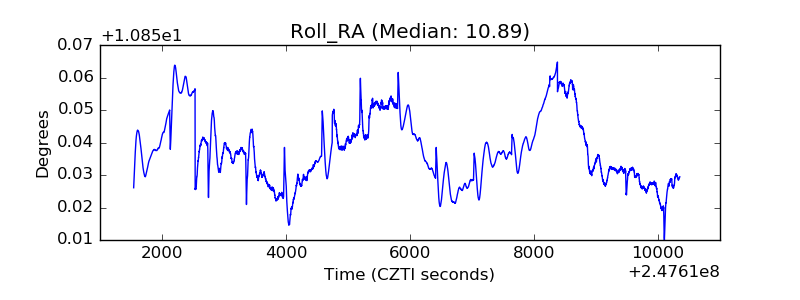 |
| Veto Counter | 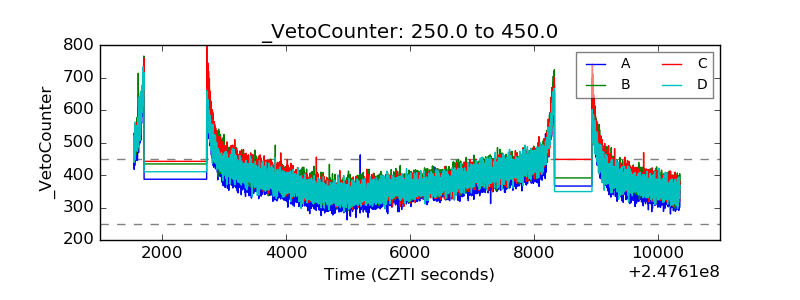 |