| Param | Original file | Final file |
|---|---|---|
| Filename | modeM0/AS1A04_022T04_9000001666_11396cztM0_level2.evt | modeM0/AS1A04_022T04_9000001666_11396cztM0_level2_quad_clean.evt |
| Size (bytes) | 626,080,320 | 108,705,600 |
| Size | 597.1 MB | 103.7 MB |
| Events in quadrant A | 4,630,724 | 670,122 |
| Events in quadrant B | 5,339,594 | 659,088 |
| Events in quadrant C | 3,715,933 | 736,158 |
| Events in quadrant D | 4,734,749 | 672,668 |
| Mode M9 | |||
|---|---|---|---|
| Quadrant | BADHDUFLAG | Total packets | Discarded packets |
| A | 0 | 3 | 0 |
| B | 0 | 3 | 0 |
| C | 0 | 3 | 0 |
| D | 0 | 3 | 0 |
| Mode SS | |||
|---|---|---|---|
| Quadrant | BADHDUFLAG | Total packets | Discarded packets |
| A | 0 | 162 | 0 |
| B | 0 | 162 | 0 |
| C | 0 | 162 | 0 |
| D | 0 | 162 | 0 |
| Mode M0 | |||
|---|---|---|---|
| Quadrant | BADHDUFLAG | Total packets | Discarded packets |
| A | 0 | 19306 | 3 |
| B | 0 | 21327 | 2 |
| C | 0 | 16657 | 2 |
| D | 0 | 19881 | 2 |
| Quadrant | Total seconds | Saturated seconds | Saturation percentage |
|---|---|---|---|
| A | 7969 | 267 | 3.350483% |
| B | 7969 | 618 | 7.755051% |
| C | 7969 | 58 | 0.727820% |
| D | 7969 | 314 | 3.940269% |
Noise dominated data is calculated using 1-second bins in cleaned event files. If a bin has >2000 counts, and if more than 50% of those come from <1% of pixels, then it is considered to be noise-dominated and hence unusable.
| Quadrant | # 1 sec bins | Bins with >0 counts | Bins with >2000 counts | High rate bins dominated by noise | Noise dominated (total time) | Noise dominated (detector-on time) | Marked lightcurve |
|---|---|---|---|---|---|---|---|
| A | 8199 | 7971 | 85 | 85 | 1.04% | 1.07% | 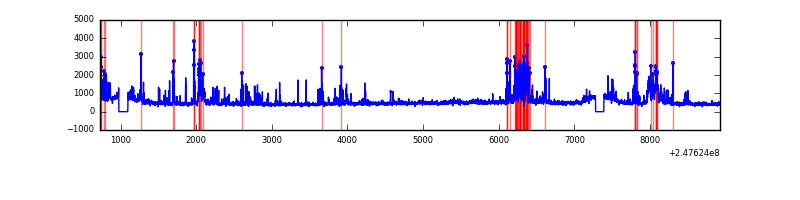 |
| B | 8199 | 7971 | 238 | 238 | 2.90% | 2.99% | 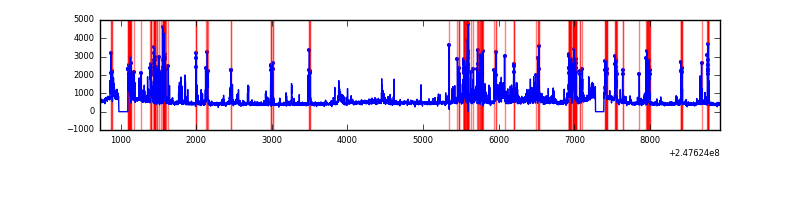 |
| C | 8199 | 7971 | 0 | 0 | 0.00% | 0.00% | 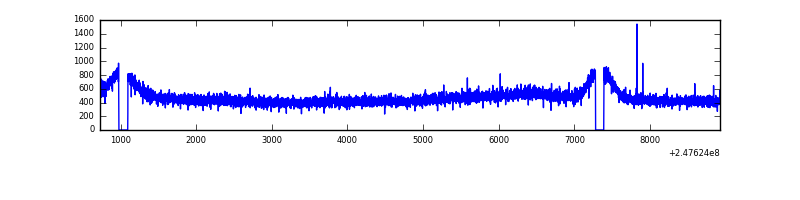 |
| D | 8199 | 7971 | 189 | 189 | 2.31% | 2.37% | 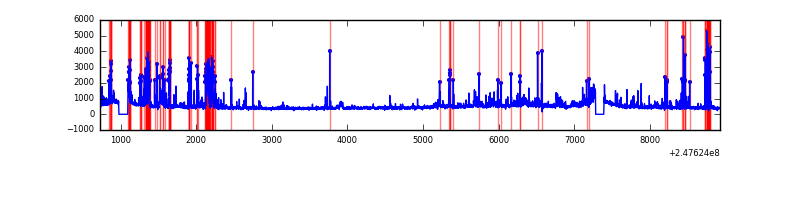 |
Top three noisy pixels from each quadrant. If the there are fewer than three noisy pixels in the level2.evt file, extra rows are filled as -1
| Pixel properties | Quadrant properties | ||||||
|---|---|---|---|---|---|---|---|
| Quadrant | DetID | PixID | Counts | Sigma | Mean | Median | Sigma |
| A | 8 | 5 | 772386 | 4028.01 | 933 | 910 | 191.5 |
| A | 13 | 248 | 230153 | 1196.92 | 933 | 910 | 191.5 |
| A | 11 | 29 | 16789 | 82.91 | 933 | 910 | 191.5 |
| B | 4 | 239 | 1571525 | 8933.98 | 919 | 894 | 175.8 |
| B | 0 | 214 | 96269 | 542.51 | 919 | 894 | 175.8 |
| B | 3 | 189 | 29929 | 165.16 | 919 | 894 | 175.8 |
| C | 8 | 128 | 12270 | 50.97 | 947 | 951 | 222.1 |
| C | 8 | 112 | 7076 | 27.58 | 947 | 951 | 222.1 |
| C | 13 | 61 | 6858 | 26.6 | 947 | 951 | 222.1 |
| D | 10 | 253 | 603840 | 2720.06 | 917 | 891 | 221.7 |
| D | 2 | 120 | 159127 | 713.84 | 917 | 891 | 221.7 |
| D | 1 | 52 | 139966 | 627.4 | 917 | 891 | 221.7 |
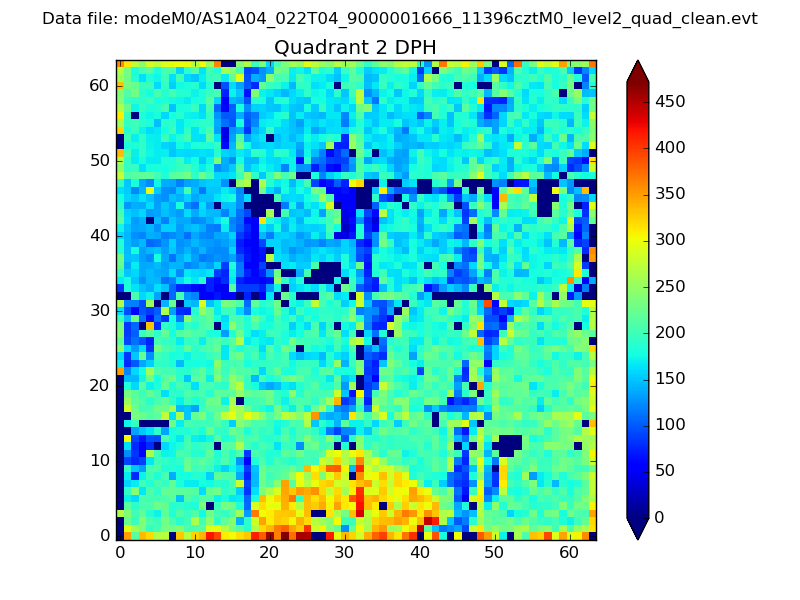
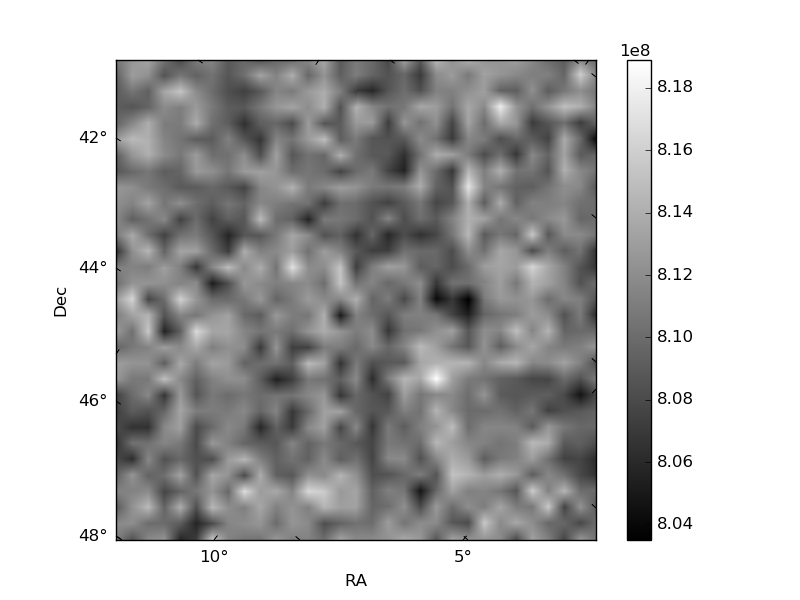
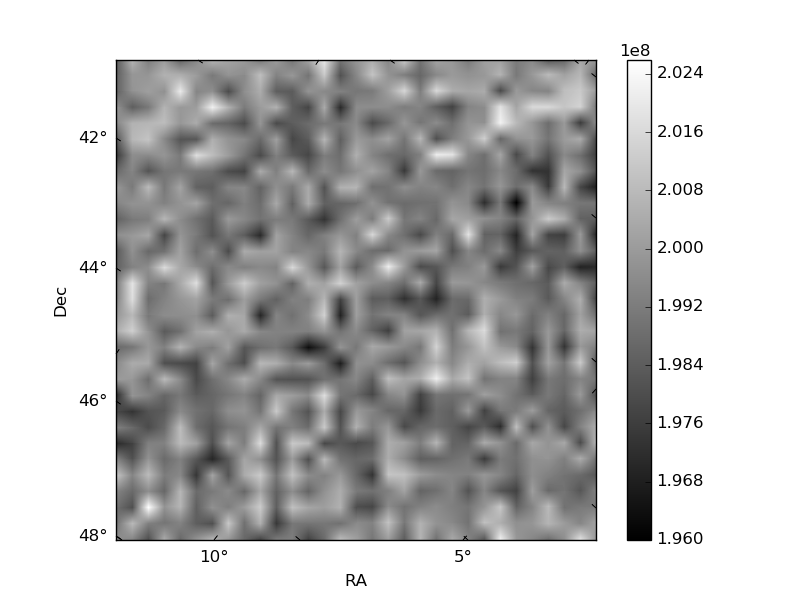
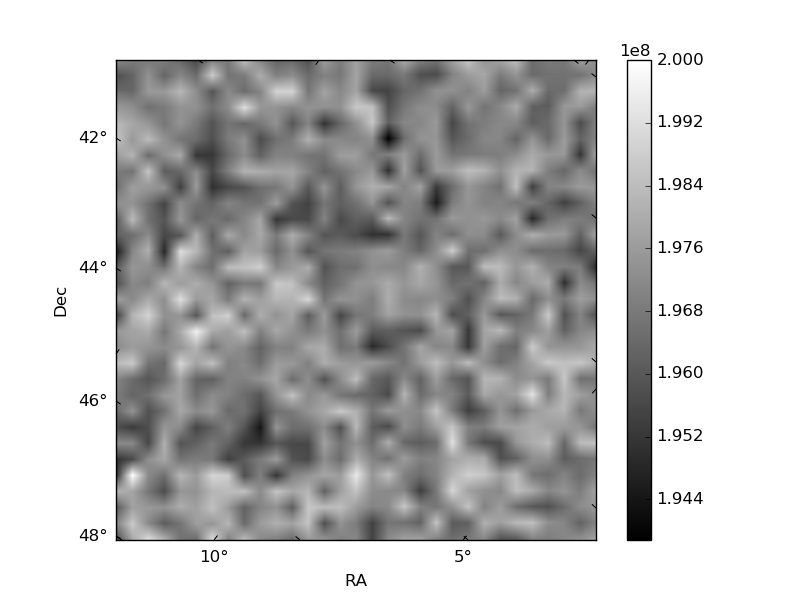
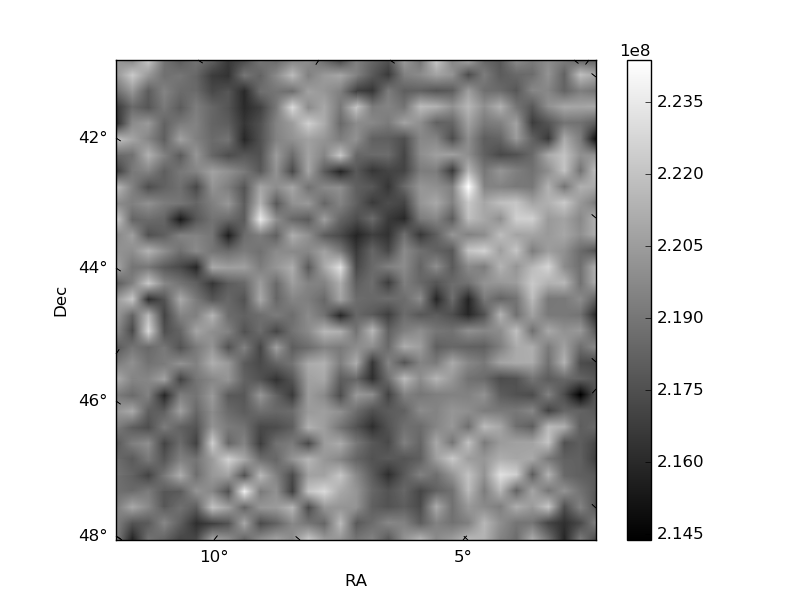
Histogram calculated using DETX and DETY for each event in the final _common_clean file
| Quadrant A | 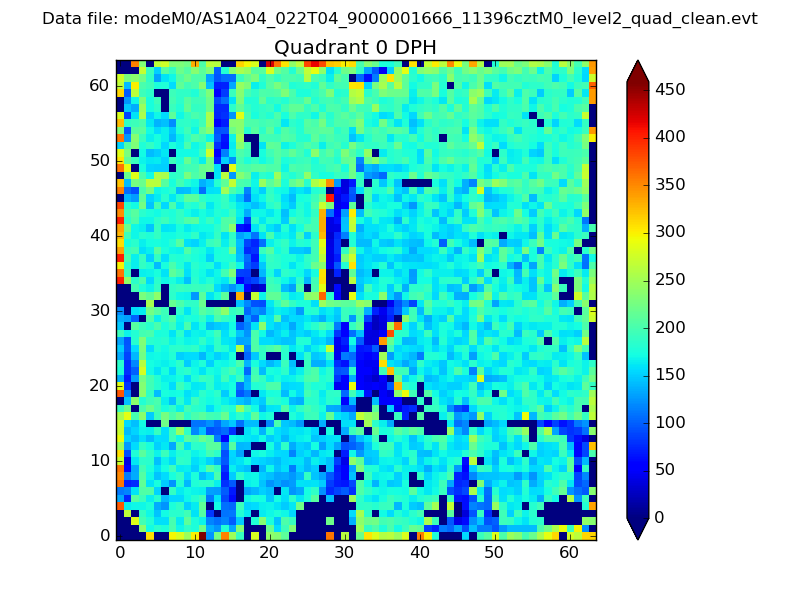 |
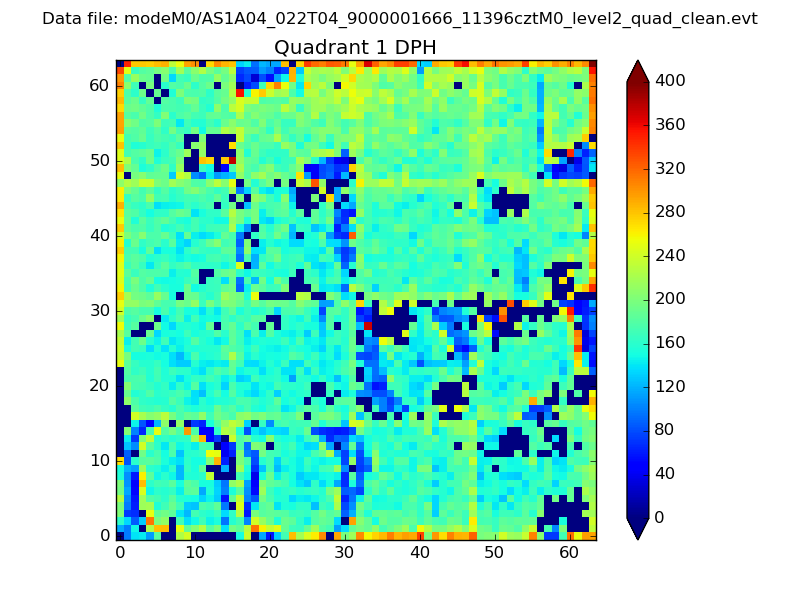 |
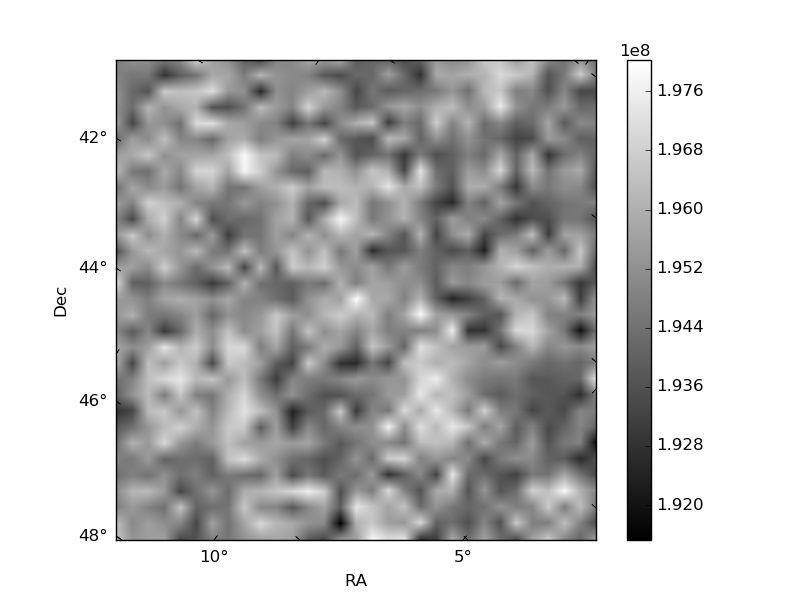
Quadrant B |
|---|---|---|---|
| Quadrant D | 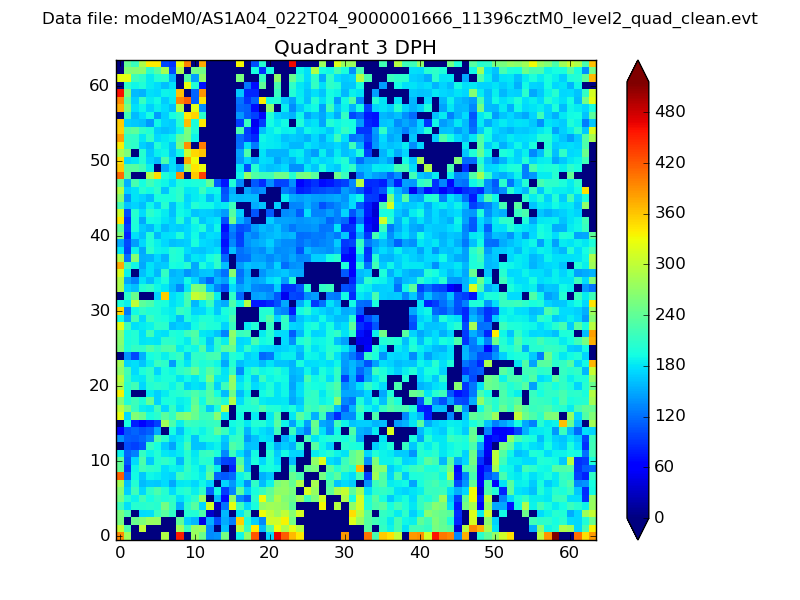 |
 |
Quadrant C |
| Plot type | Count rate plots | Images |
|---|---|---|
| Comparison with Poisson distribution Blue bars denote a histogram of data divided into 1 sec bins. Red curve is a Poisson curve with rate = median count rate of data. |
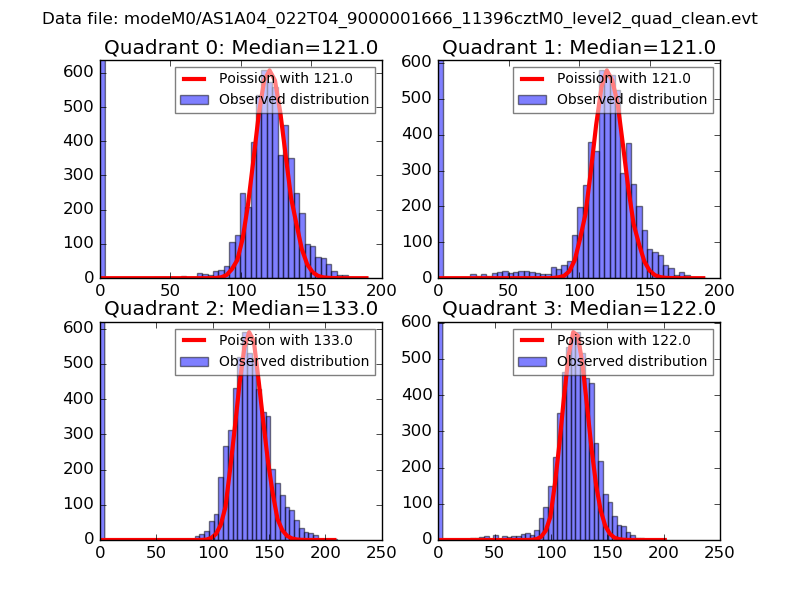 |
 |
| Quadrant-wise count rates Data is divided into 100 sec bins |
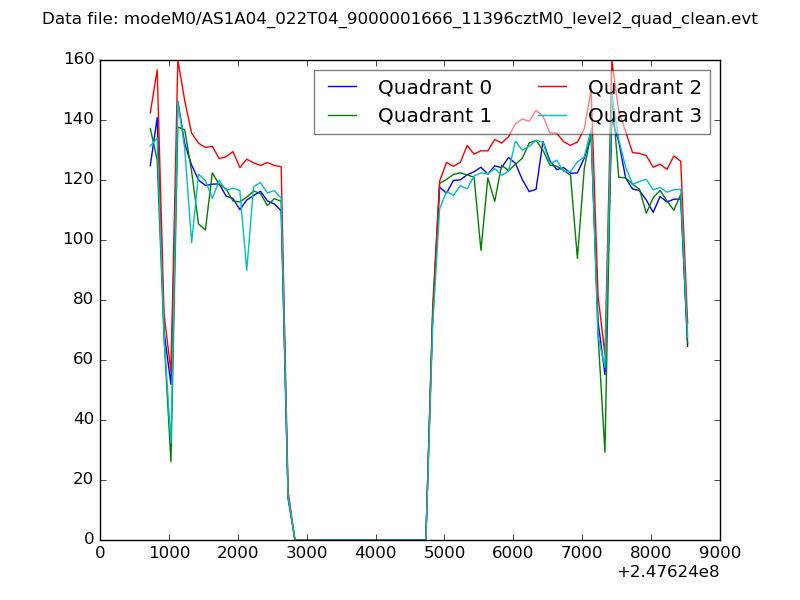 |
|
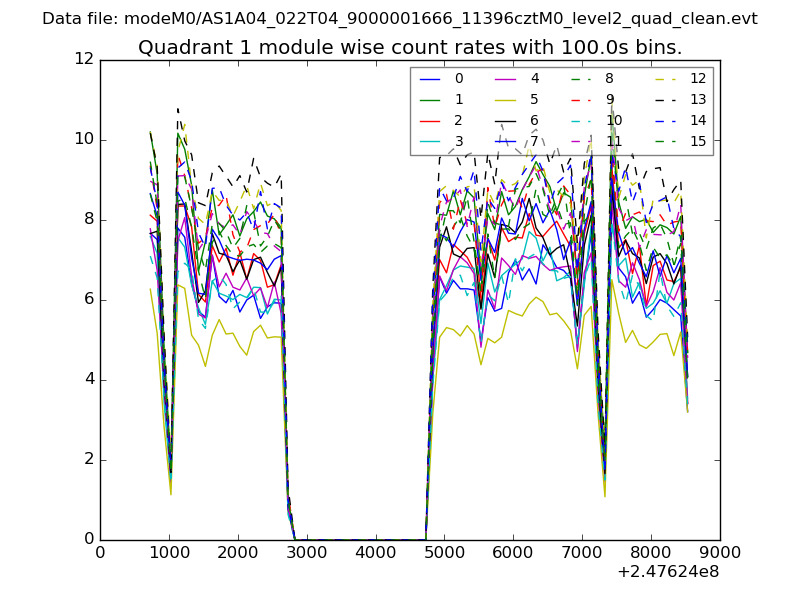
| Module-wise count rates for Quadrant A Data is divided into 100 sec bins |
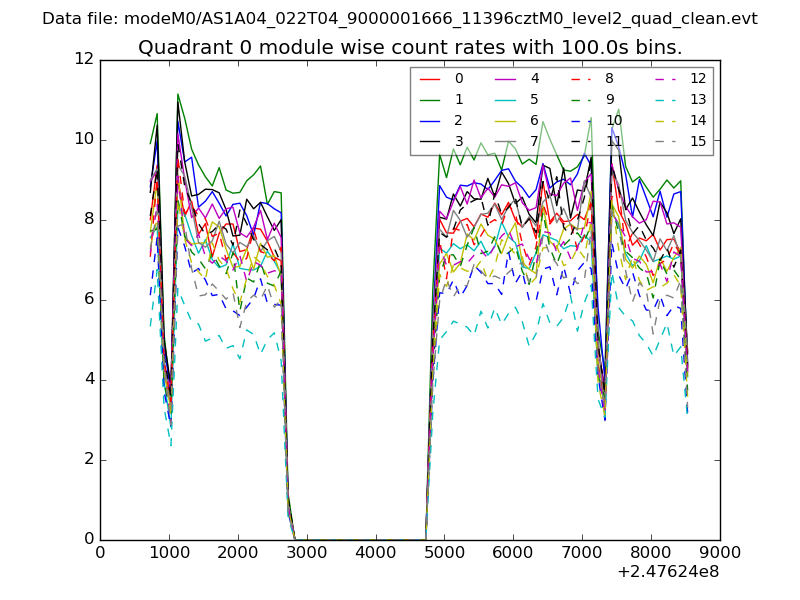 |
 |
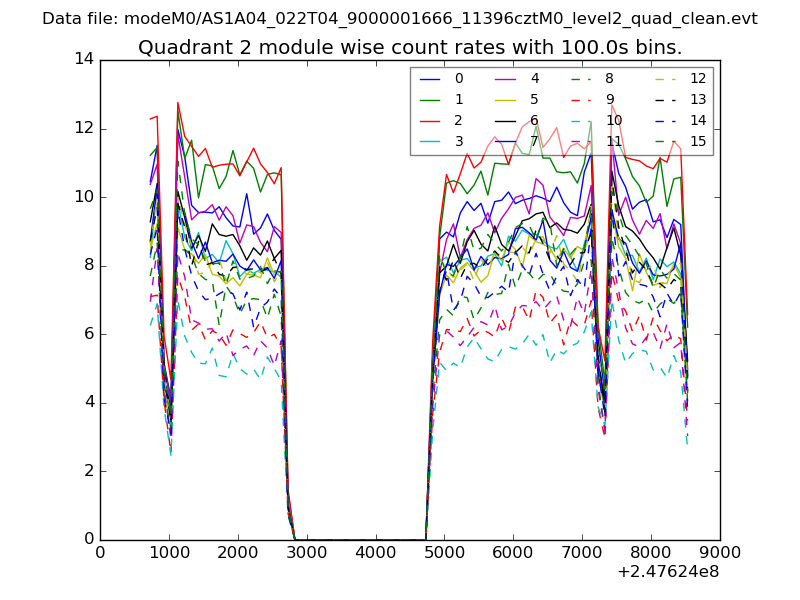
| Module-wise count rates for Quadrant B Data is divided into 100 sec bins |
 |
 |
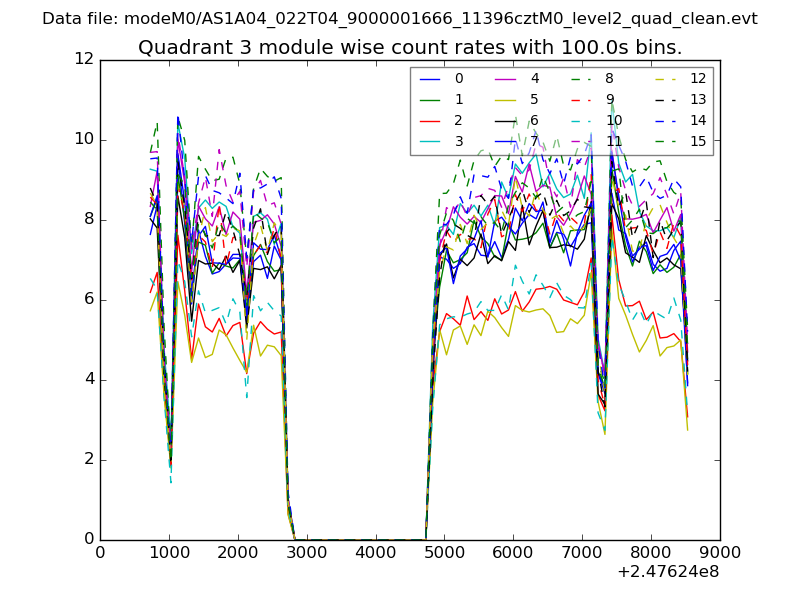
| Module-wise count rates for Quadrant C Data is divided into 100 sec bins |
 |
 |
| Module-wise count rates for Quadrant D Data is divided into 100 sec bins |
 |
 |
| Parameter | Plot |
|---|---|
| CZT HV Monitor | 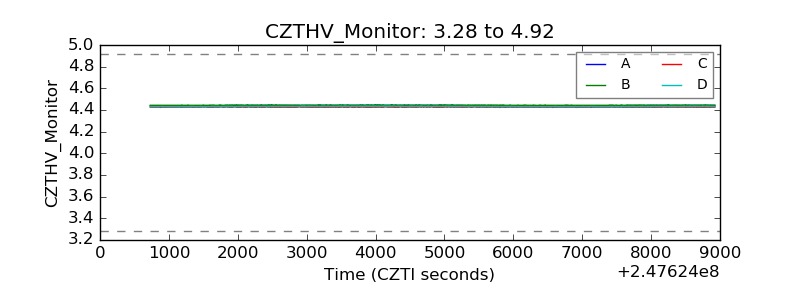 |
| D_VDD | 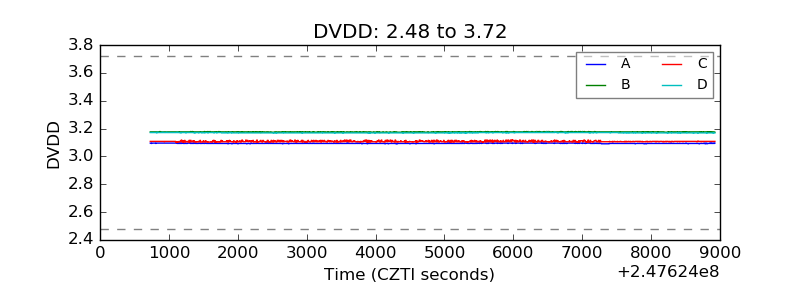 |
| Temperature 1 | 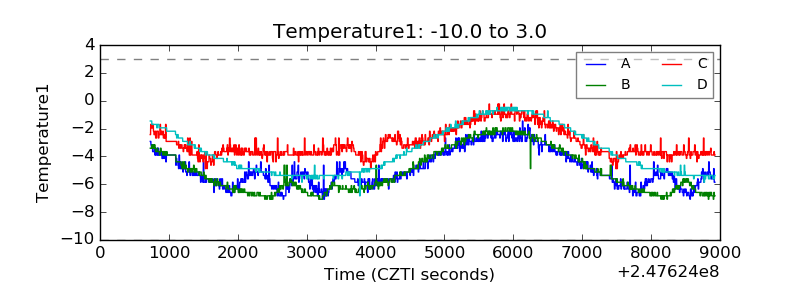 |
| Veto HV Monitor | 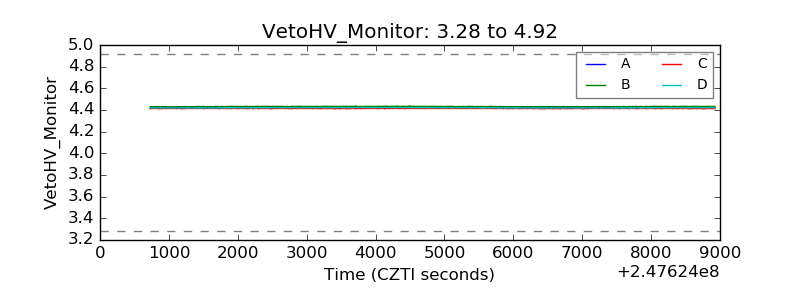 |
| Veto LLD | 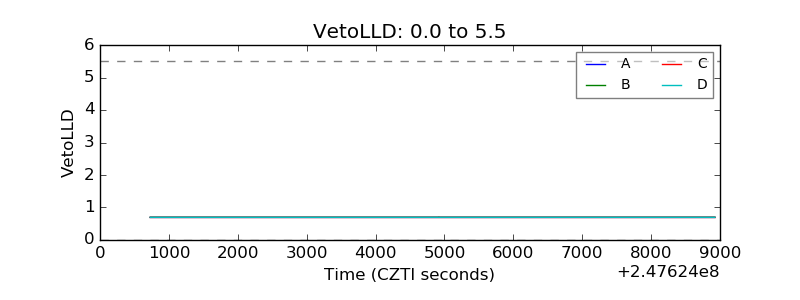 |
| Alpha Counter | 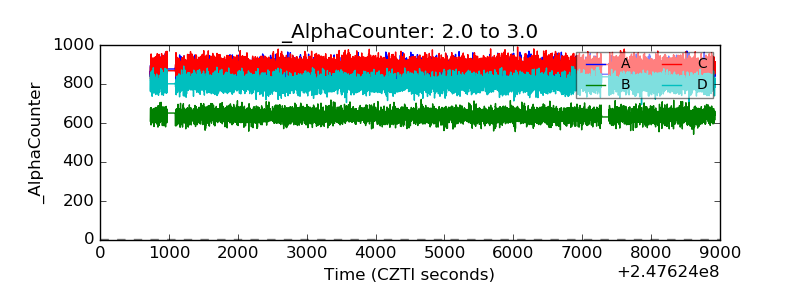 |
| _CPM_Rate | 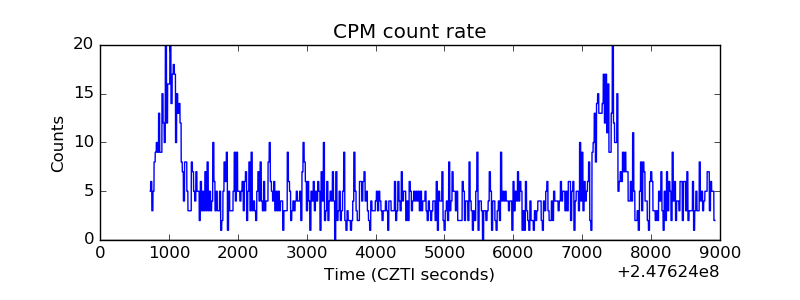 |
| CZT Counter | 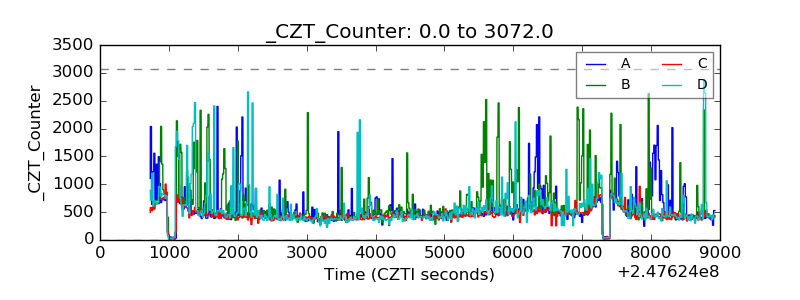 |
| +2.5 Volts monitor |  |
| +5 Volts monitor |  |
| _ROLL_ROT | 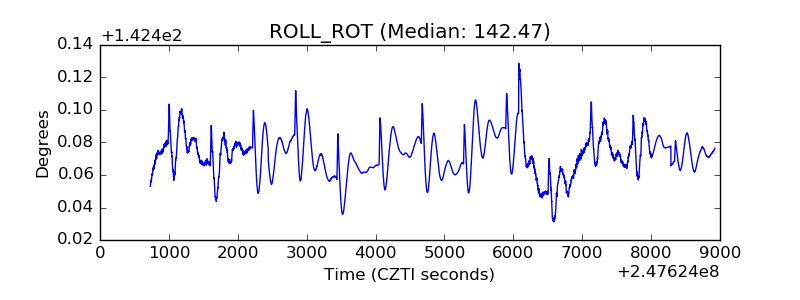 |
| _Roll_DEC | 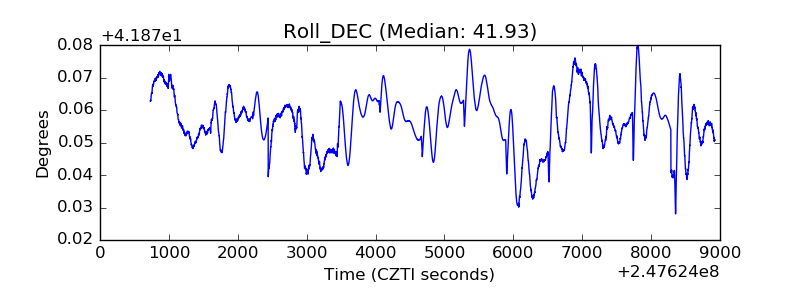 |
| _Roll_RA | 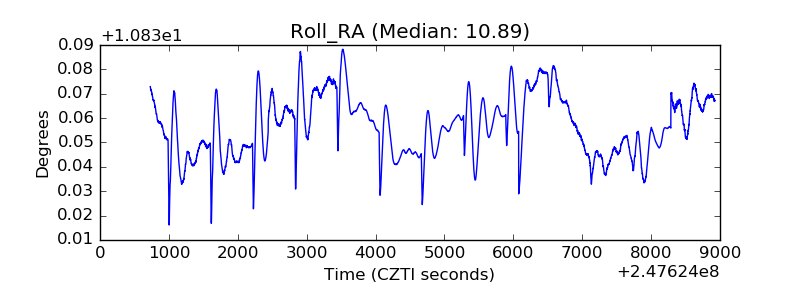 |
| Veto Counter | 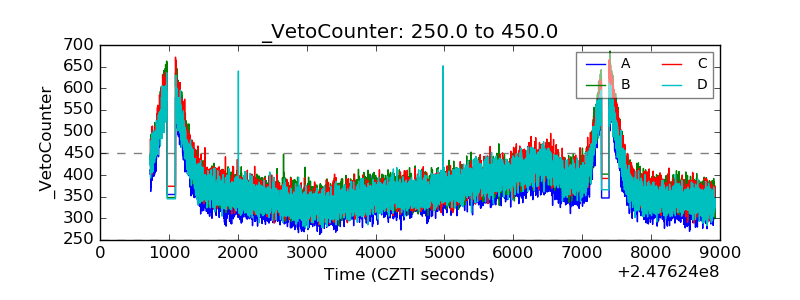 |