| Param | Original file | Final file |
|---|---|---|
| Filename | modeM0/AS1A04_022T04_9000001666_11397cztM0_level2.evt | modeM0/AS1A04_022T04_9000001666_11397cztM0_level2_quad_clean.evt |
| Size (bytes) | 669,836,160 | 114,160,320 |
| Size | 638.8 MB | 108.9 MB |
| Events in quadrant A | 4,766,437 | 698,080 |
| Events in quadrant B | 5,766,456 | 679,781 |
| Events in quadrant C | 4,058,840 | 761,837 |
| Events in quadrant D | 5,100,045 | 708,575 |
| Mode M9 | |||
|---|---|---|---|
| Quadrant | BADHDUFLAG | Total packets | Discarded packets |
| A | 0 | 4 | 0 |
| B | 0 | 4 | 0 |
| C | 0 | 4 | 0 |
| D | 0 | 4 | 0 |
| Mode SS | |||
|---|---|---|---|
| Quadrant | BADHDUFLAG | Total packets | Discarded packets |
| A | 0 | 180 | 0 |
| B | 0 | 180 | 0 |
| C | 0 | 180 | 0 |
| D | 0 | 180 | 0 |
| Mode M0 | |||
|---|---|---|---|
| Quadrant | BADHDUFLAG | Total packets | Discarded packets |
| A | 0 | 20013 | 3 |
| B | 0 | 23147 | 2 |
| C | 0 | 18087 | 2 |
| D | 0 | 21252 | 2 |
| Quadrant | Total seconds | Saturated seconds | Saturation percentage |
|---|---|---|---|
| A | 8766 | 243 | 2.772074% |
| B | 8766 | 705 | 8.042437% |
| C | 8766 | 66 | 0.752909% |
| D | 8766 | 255 | 2.908966% |
Noise dominated data is calculated using 1-second bins in cleaned event files. If a bin has >2000 counts, and if more than 50% of those come from <1% of pixels, then it is considered to be noise-dominated and hence unusable.
| Quadrant | # 1 sec bins | Bins with >0 counts | Bins with >2000 counts | High rate bins dominated by noise | Noise dominated (total time) | Noise dominated (detector-on time) | Marked lightcurve |
|---|---|---|---|---|---|---|---|
| A | 9236 | 8768 | 62 | 62 | 0.67% | 0.71% | 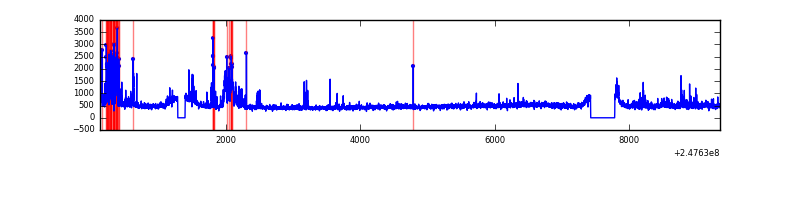 |
| B | 9236 | 8768 | 308 | 308 | 3.33% | 3.51% | 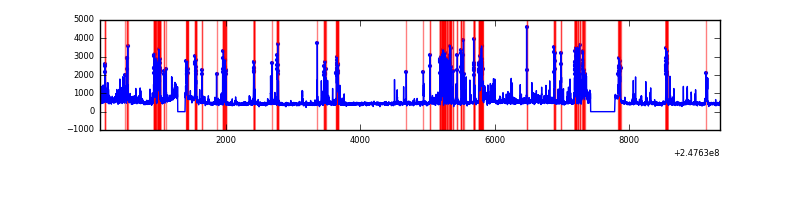 |
| C | 9236 | 8768 | 0 | 0 | 0.00% | 0.00% | 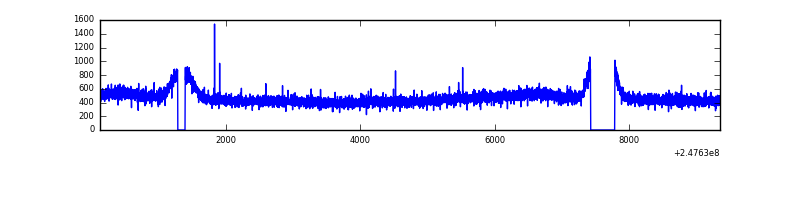 |
| D | 9236 | 8768 | 155 | 155 | 1.68% | 1.77% | 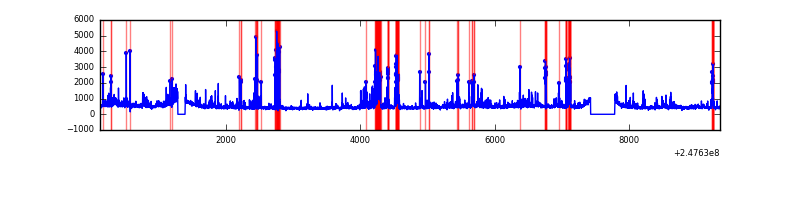 |
Top three noisy pixels from each quadrant. If the there are fewer than three noisy pixels in the level2.evt file, extra rows are filled as -1
| Pixel properties | Quadrant properties | ||||||
|---|---|---|---|---|---|---|---|
| Quadrant | DetID | PixID | Counts | Sigma | Mean | Median | Sigma |
| A | 8 | 5 | 457706 | 2146.84 | 1029 | 1003 | 212.7 |
| A | 13 | 248 | 194428 | 909.24 | 1029 | 1003 | 212.7 |
| A | 13 | 251 | 50559 | 232.95 | 1029 | 1003 | 212.7 |
| B | 4 | 239 | 1744440 | 8979.17 | 1011 | 985 | 194.2 |
| B | 15 | 204 | 46890 | 236.42 | 1011 | 985 | 194.2 |
| B | 0 | 214 | 23262 | 114.73 | 1011 | 985 | 194.2 |
| C | 13 | 61 | 7452 | 26.18 | 1040 | 1045 | 244.8 |
| C | 12 | 4 | 5109 | 16.6 | 1040 | 1045 | 244.8 |
| C | 8 | 128 | 2761 | 7.01 | 1040 | 1045 | 244.8 |
| D | 2 | 14 | 365820 | 1517.09 | 1011 | 983 | 240.5 |
| D | 2 | 120 | 200823 | 830.99 | 1011 | 983 | 240.5 |
| D | 10 | 253 | 168892 | 698.21 | 1011 | 983 | 240.5 |
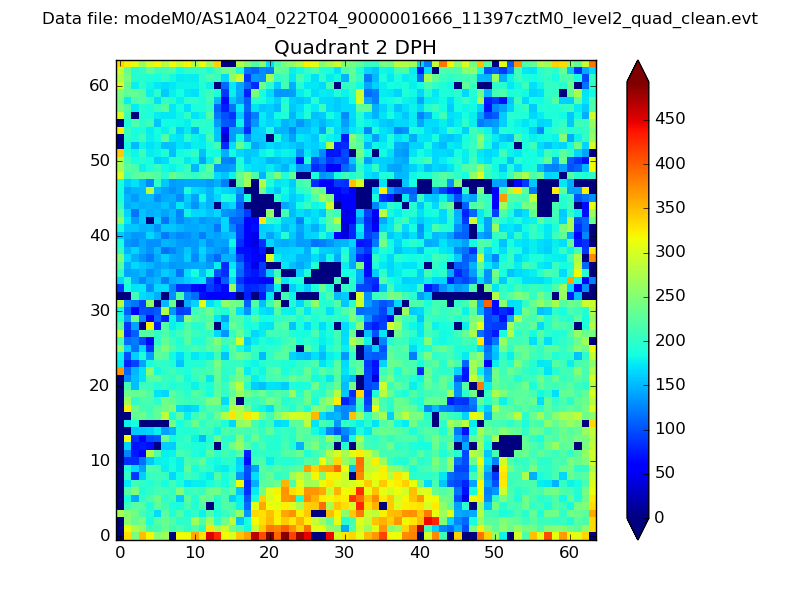
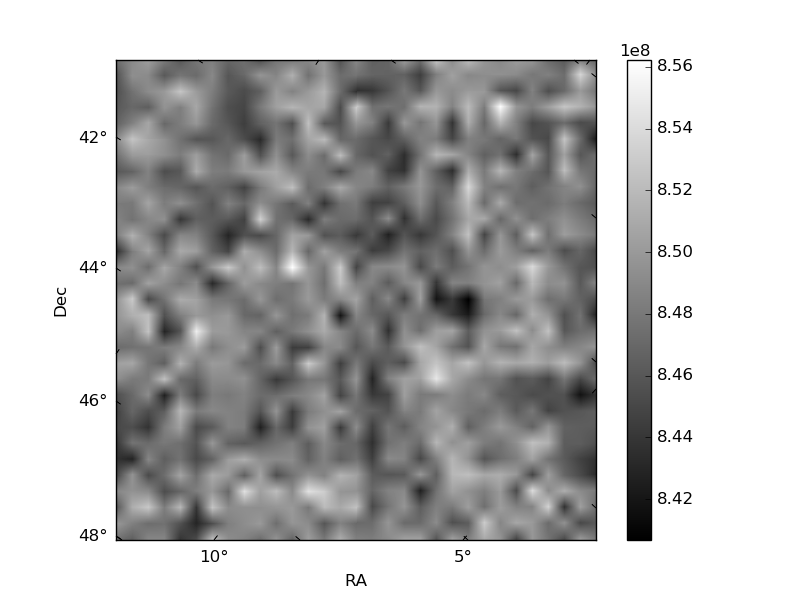
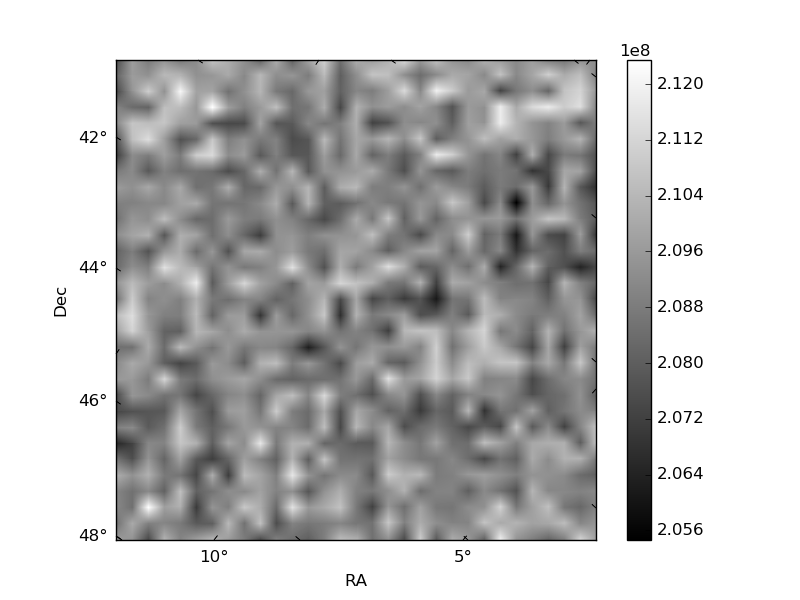
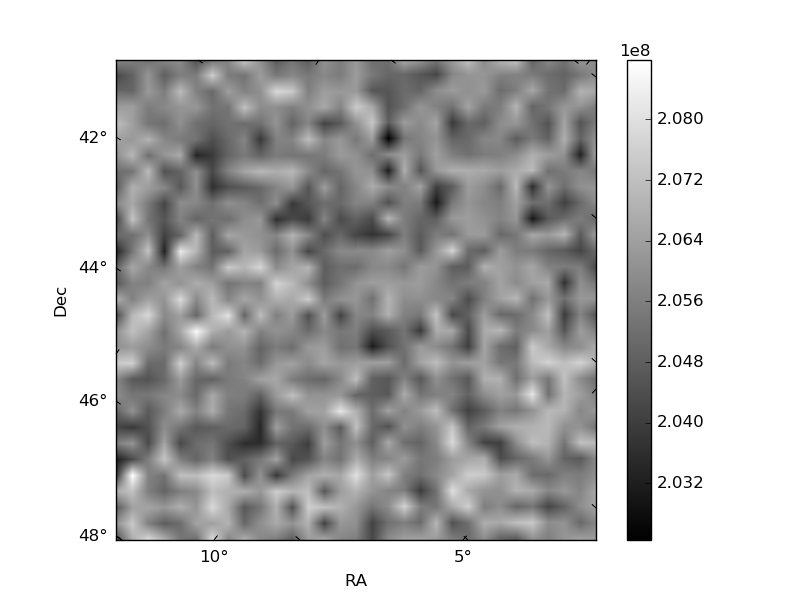
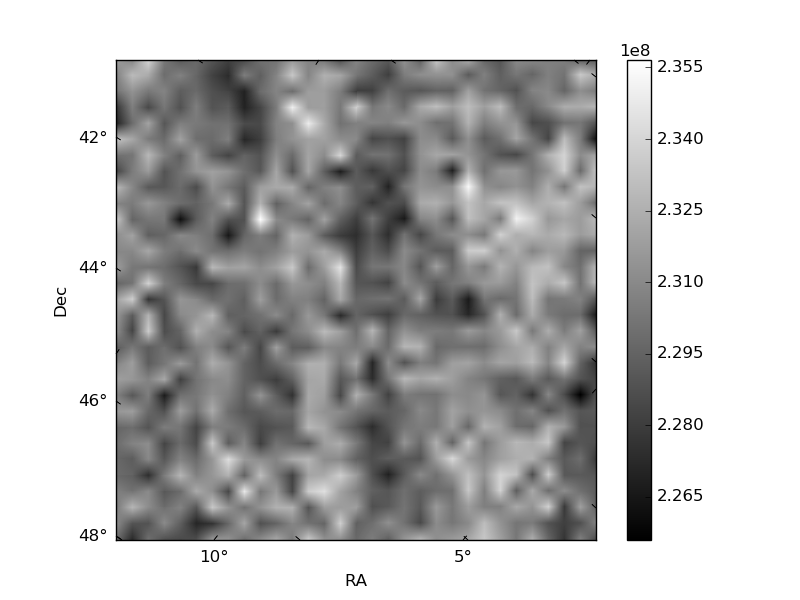
Histogram calculated using DETX and DETY for each event in the final _common_clean file
| Quadrant A | 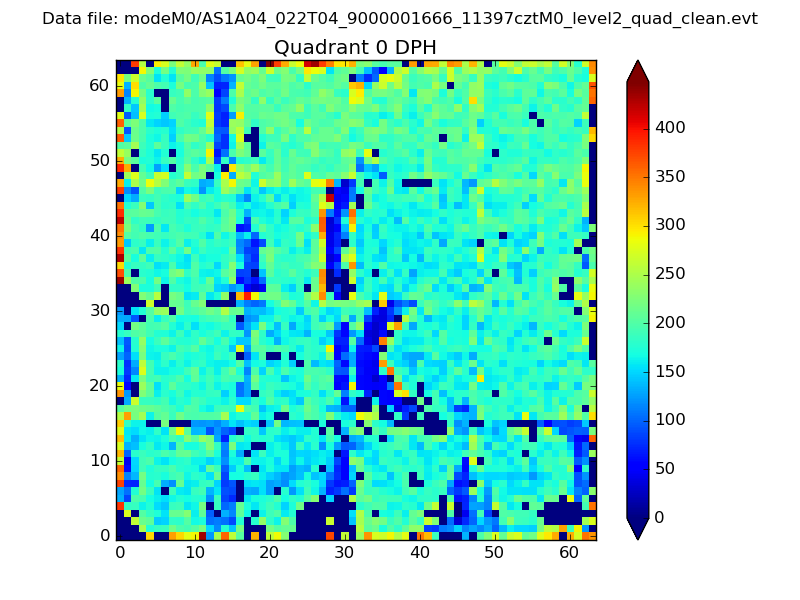 |
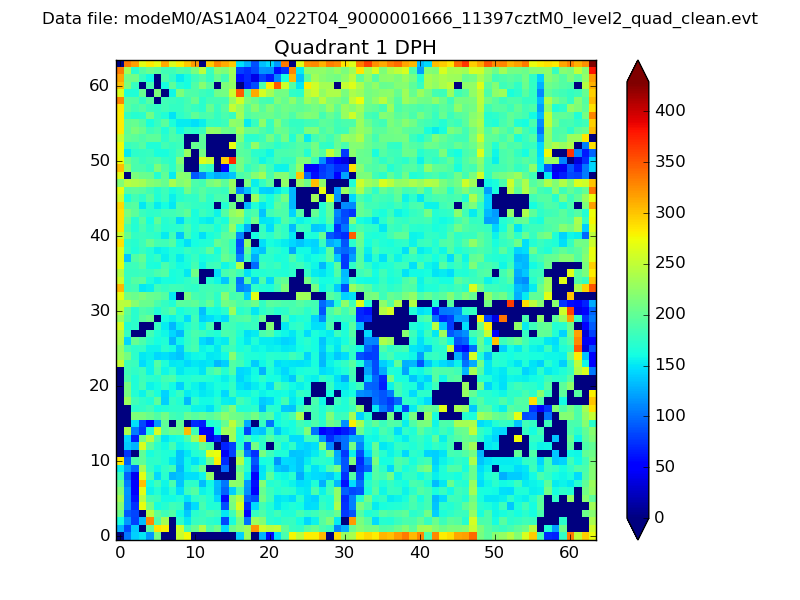 |
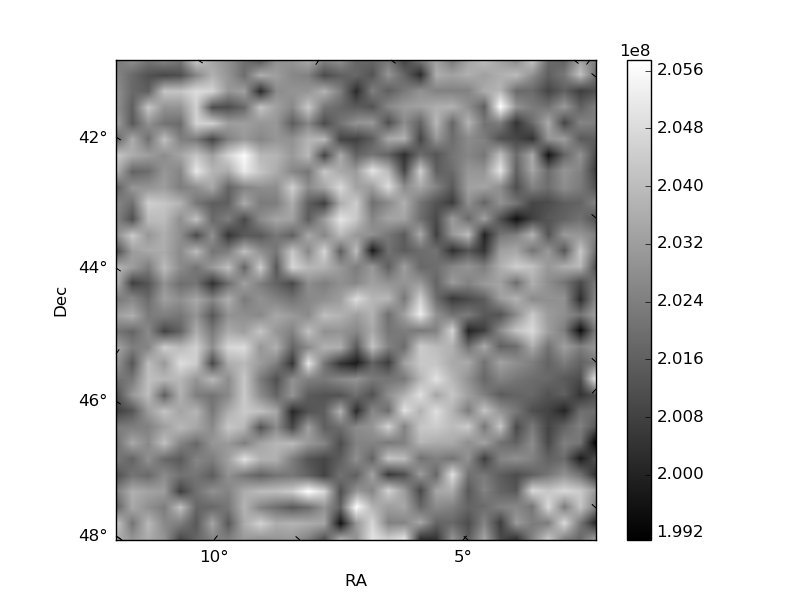
Quadrant B |
|---|---|---|---|
| Quadrant D | 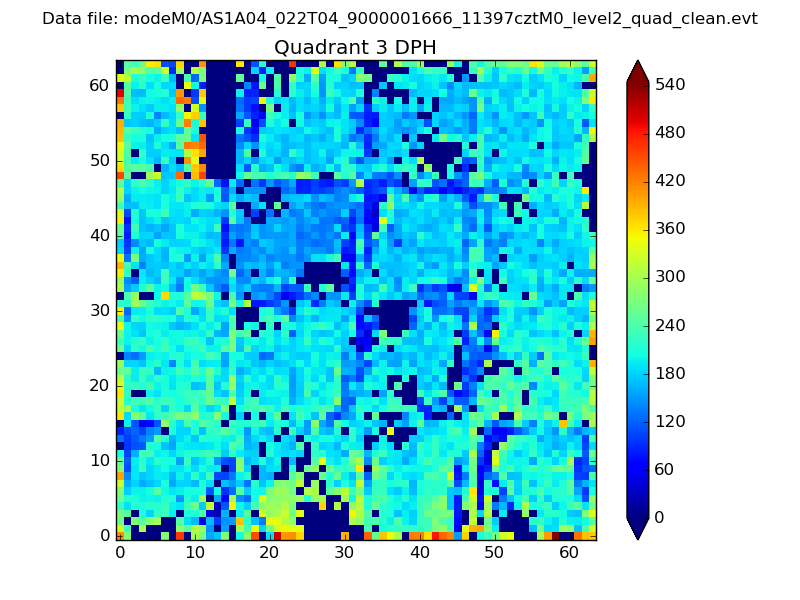 |
 |
Quadrant C |
| Plot type | Count rate plots | Images |
|---|---|---|
| Comparison with Poisson distribution Blue bars denote a histogram of data divided into 1 sec bins. Red curve is a Poisson curve with rate = median count rate of data. |
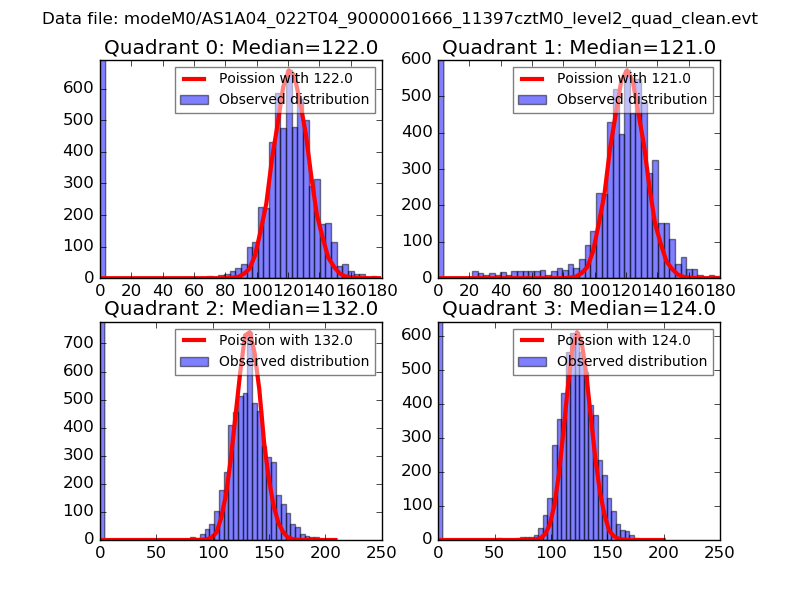 |
 |
| Quadrant-wise count rates Data is divided into 100 sec bins |
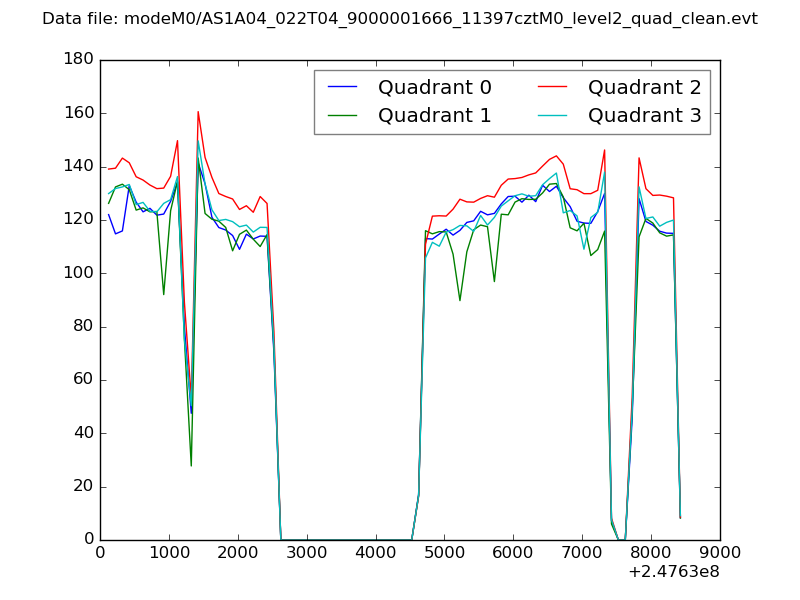 |
|
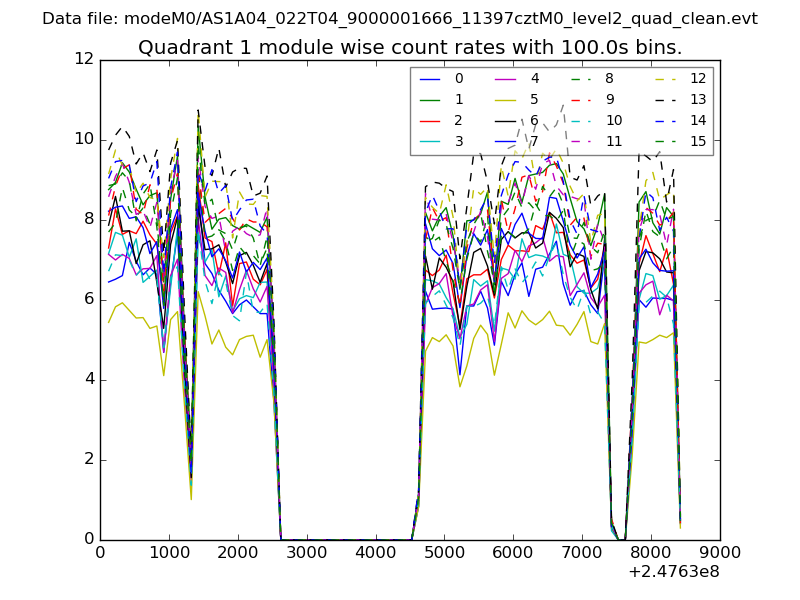
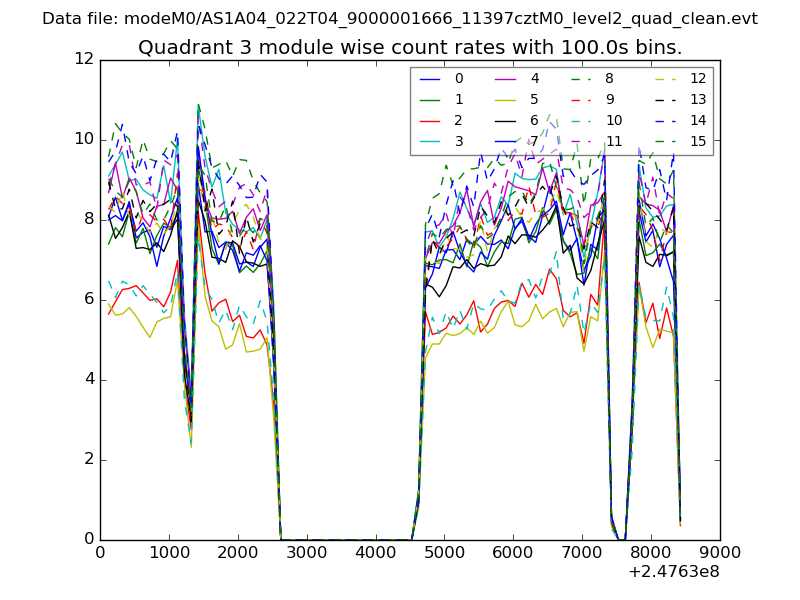
| Module-wise count rates for Quadrant A Data is divided into 100 sec bins |
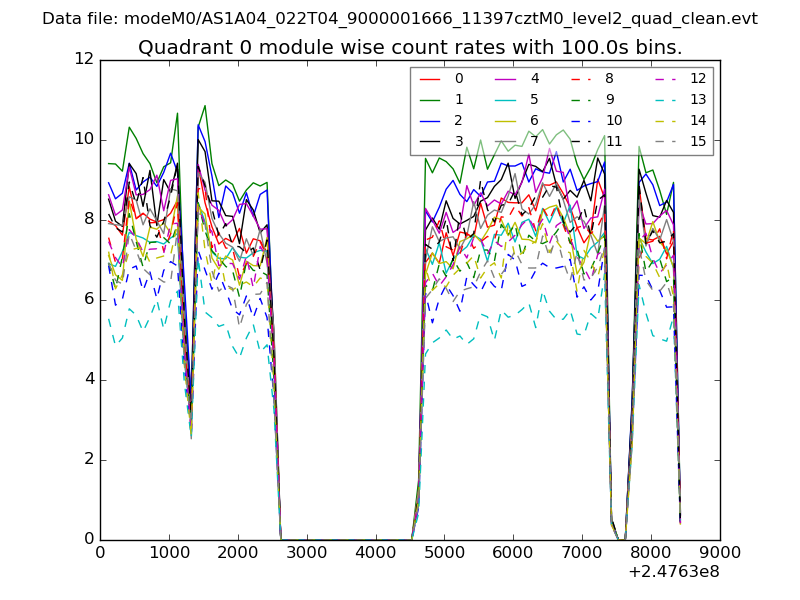 |
 |
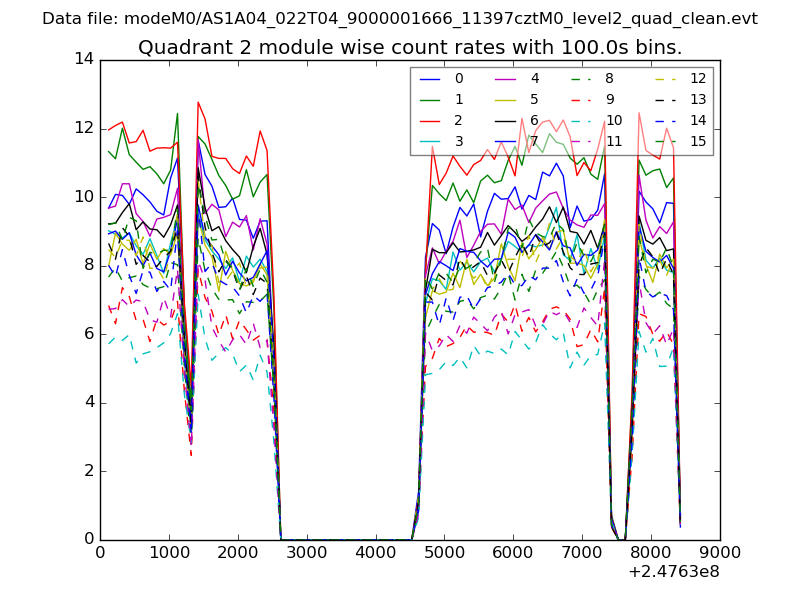
| Module-wise count rates for Quadrant B Data is divided into 100 sec bins |
 |
 |
| Module-wise count rates for Quadrant C Data is divided into 100 sec bins |
 |
 |
| Module-wise count rates for Quadrant D Data is divided into 100 sec bins |
 |
 |
| Parameter | Plot |
|---|---|
| CZT HV Monitor | 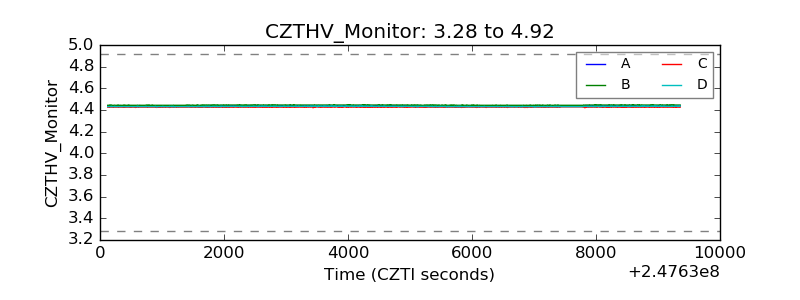 |
| D_VDD | 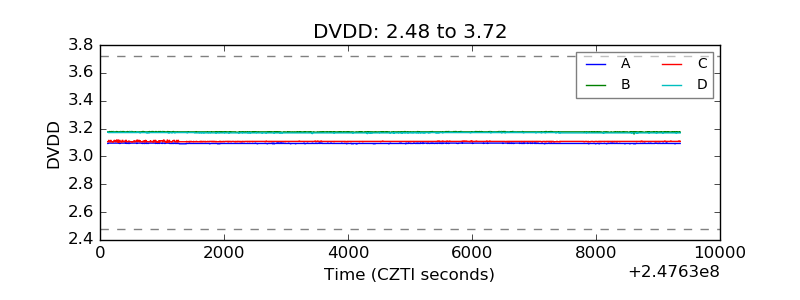 |
| Temperature 1 | 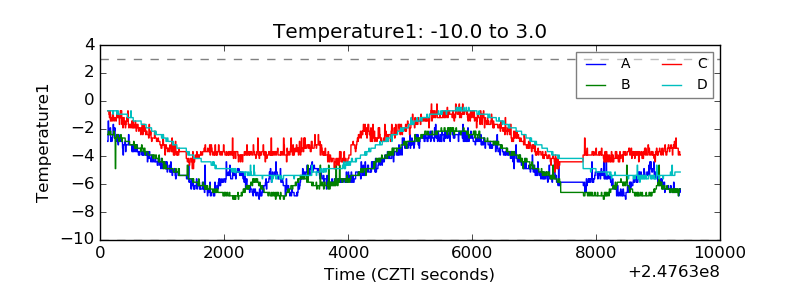 |
| Veto HV Monitor | 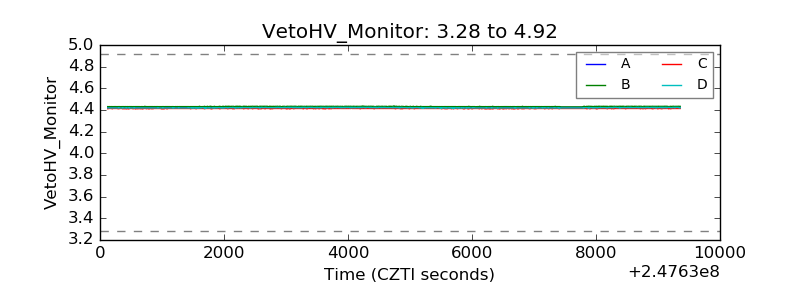 |
| Veto LLD | 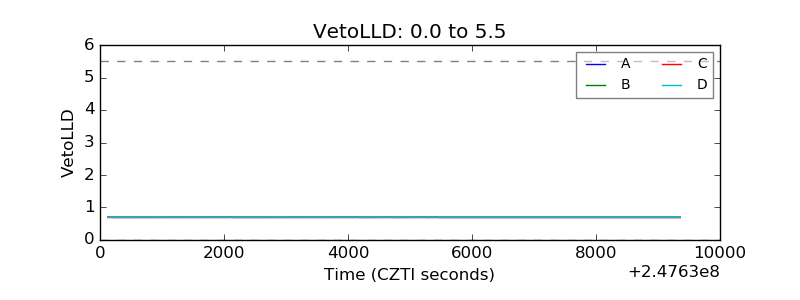 |
| Alpha Counter | 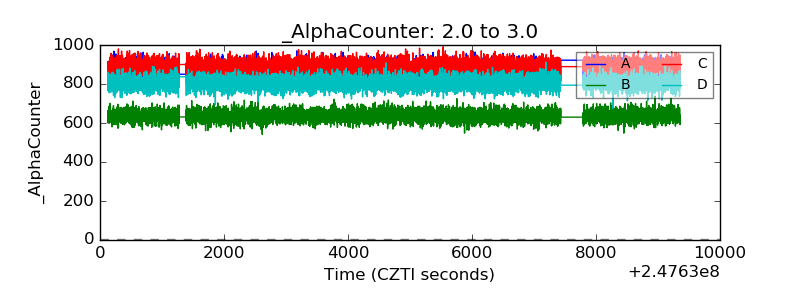 |
| _CPM_Rate | 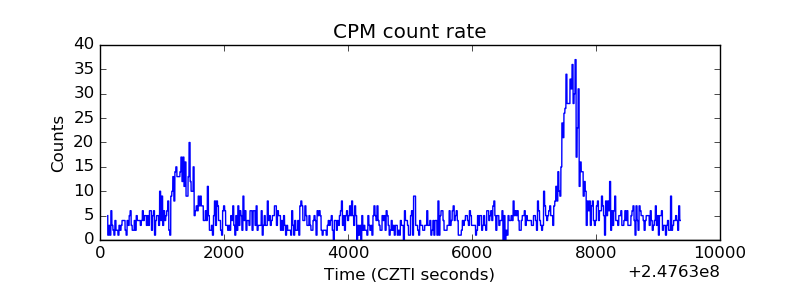 |
| CZT Counter | 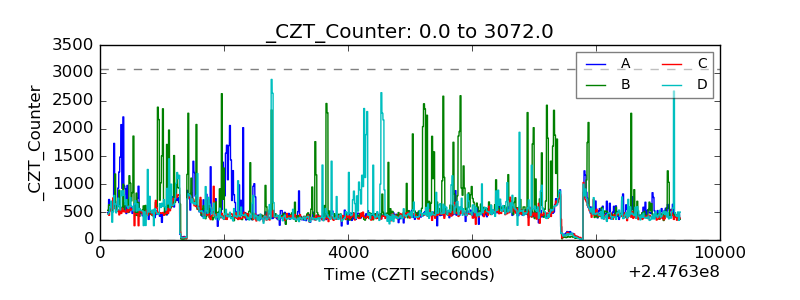 |
| +2.5 Volts monitor |  |
| +5 Volts monitor |  |
| _ROLL_ROT | 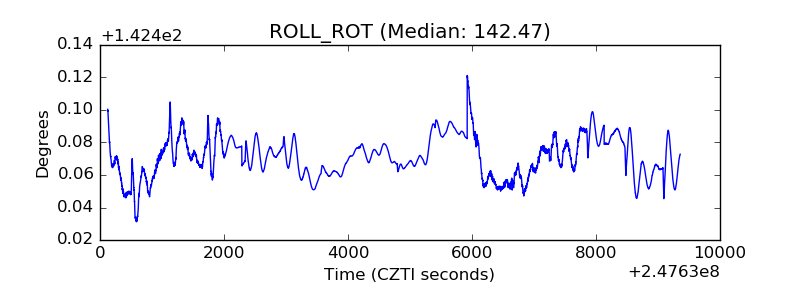 |
| _Roll_DEC | 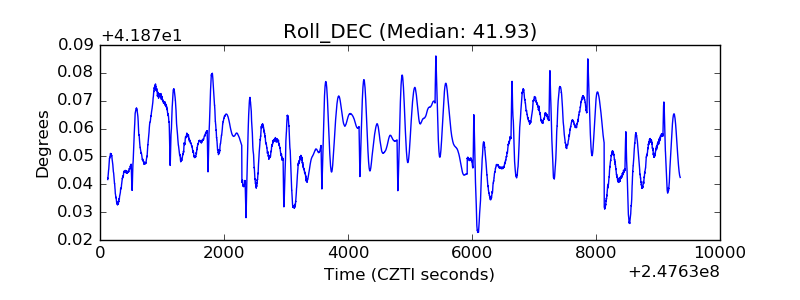 |
| _Roll_RA | 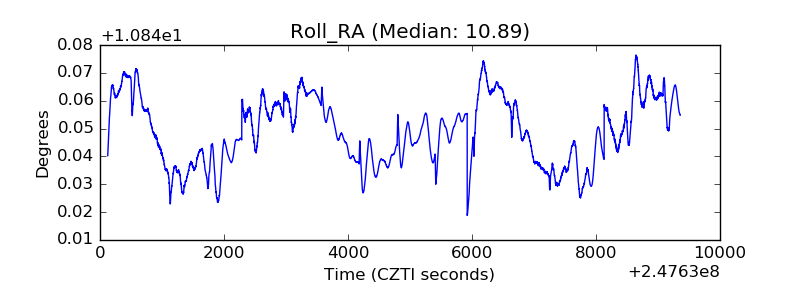 |
| Veto Counter | 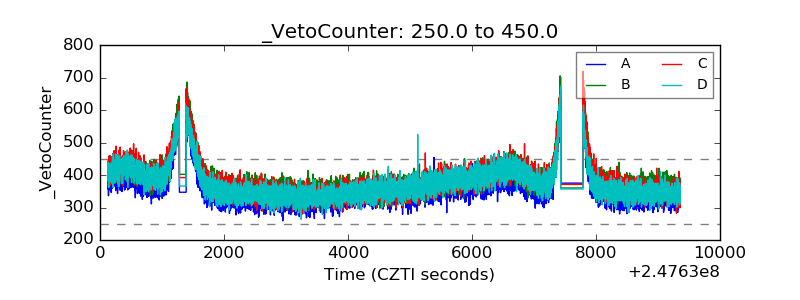 |