| Param | Original file | Final file |
|---|---|---|
| Filename | modeM0/AS1A04_022T04_9000001666_11399cztM0_level2.evt | modeM0/AS1A04_022T04_9000001666_11399cztM0_level2_quad_clean.evt |
| Size (bytes) | 1,060,822,080 | 148,590,720 |
| Size | 1011.7 MB | 141.7 MB |
| Events in quadrant A | 8,302,475 | 873,079 |
| Events in quadrant B | 8,907,657 | 866,623 |
| Events in quadrant C | 5,980,164 | 966,866 |
| Events in quadrant D | 8,045,584 | 881,781 |
| Mode M9 | |||
|---|---|---|---|
| Quadrant | BADHDUFLAG | Total packets | Discarded packets |
| A | 0 | 16 | 0 |
| B | 0 | 16 | 0 |
| C | 0 | 16 | 0 |
| D | 0 | 16 | 0 |
| Mode SS | |||
|---|---|---|---|
| Quadrant | BADHDUFLAG | Total packets | Discarded packets |
| A | 0 | 270 | 0 |
| B | 0 | 270 | 0 |
| C | 0 | 270 | 0 |
| D | 0 | 270 | 0 |
| Mode M0 | |||
|---|---|---|---|
| Quadrant | BADHDUFLAG | Total packets | Discarded packets |
| A | 0 | 33188 | 4 |
| B | 0 | 35248 | 3 |
| C | 0 | 26897 | 3 |
| D | 0 | 32870 | 3 |
| Quadrant | Total seconds | Saturated seconds | Saturation percentage |
|---|---|---|---|
| A | 13185 | 609 | 4.618885% |
| B | 13185 | 1012 | 7.675389% |
| C | 13185 | 108 | 0.819113% |
| D | 13185 | 480 | 3.640501% |
Noise dominated data is calculated using 1-second bins in cleaned event files. If a bin has >2000 counts, and if more than 50% of those come from <1% of pixels, then it is considered to be noise-dominated and hence unusable.
| Quadrant | # 1 sec bins | Bins with >0 counts | Bins with >2000 counts | High rate bins dominated by noise | Noise dominated (total time) | Noise dominated (detector-on time) | Marked lightcurve |
|---|---|---|---|---|---|---|---|
| A | 14825 | 13188 | 254 | 254 | 1.71% | 1.93% | 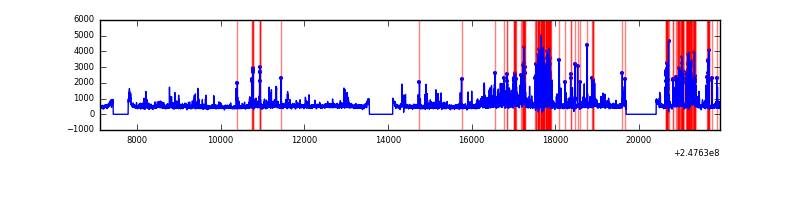 |
| B | 14825 | 13188 | 464 | 464 | 3.13% | 3.52% | 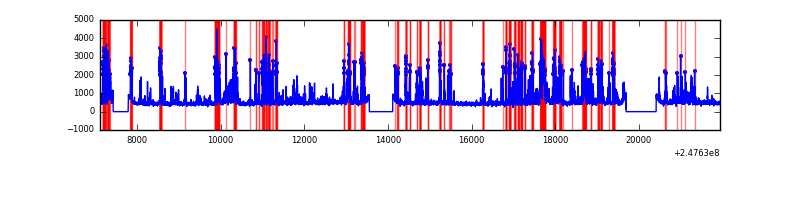 |
| C | 14825 | 13188 | 0 | 0 | 0.00% | 0.00% | 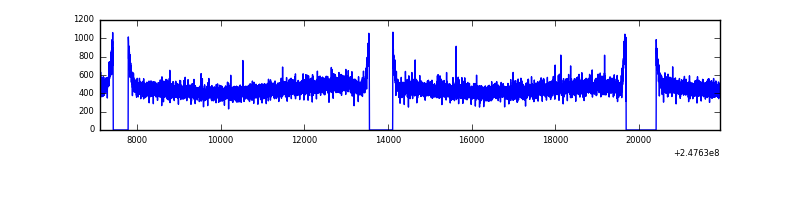 |
| D | 14825 | 13188 | 300 | 300 | 2.02% | 2.27% | 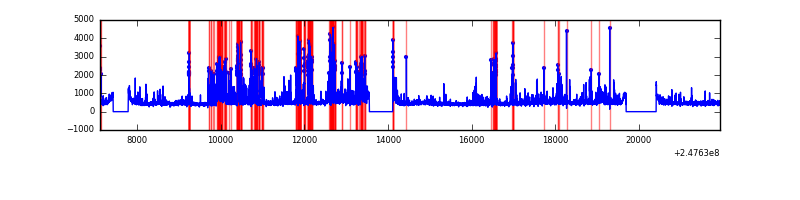 |
Top three noisy pixels from each quadrant. If the there are fewer than three noisy pixels in the level2.evt file, extra rows are filled as -1
| Pixel properties | Quadrant properties | ||||||
|---|---|---|---|---|---|---|---|
| Quadrant | DetID | PixID | Counts | Sigma | Mean | Median | Sigma |
| A | 8 | 5 | 1458165 | 4739.56 | 1520 | 1488 | 307.3 |
| A | 13 | 251 | 698172 | 2266.79 | 1520 | 1488 | 307.3 |
| A | 1 | 162 | 96616 | 309.52 | 1520 | 1488 | 307.3 |
| B | 4 | 239 | 2852772 | 9672.41 | 1517 | 1475 | 294.8 |
| B | 15 | 204 | 50680 | 166.92 | 1517 | 1475 | 294.8 |
| B | 12 | 111 | 33862 | 109.87 | 1517 | 1475 | 294.8 |
| C | 13 | 61 | 11156 | 26.91 | 1533 | 1539 | 357.4 |
| C | 12 | 4 | 4028 | 6.96 | 1533 | 1539 | 357.4 |
| C | 3 | 202 | 3676 | 5.98 | 1533 | 1539 | 357.4 |
| D | 10 | 253 | 580041 | 1617.86 | 1494 | 1454 | 357.6 |
| D | 1 | 52 | 528217 | 1472.95 | 1494 | 1454 | 357.6 |
| D | 14 | 34 | 351351 | 978.39 | 1494 | 1454 | 357.6 |
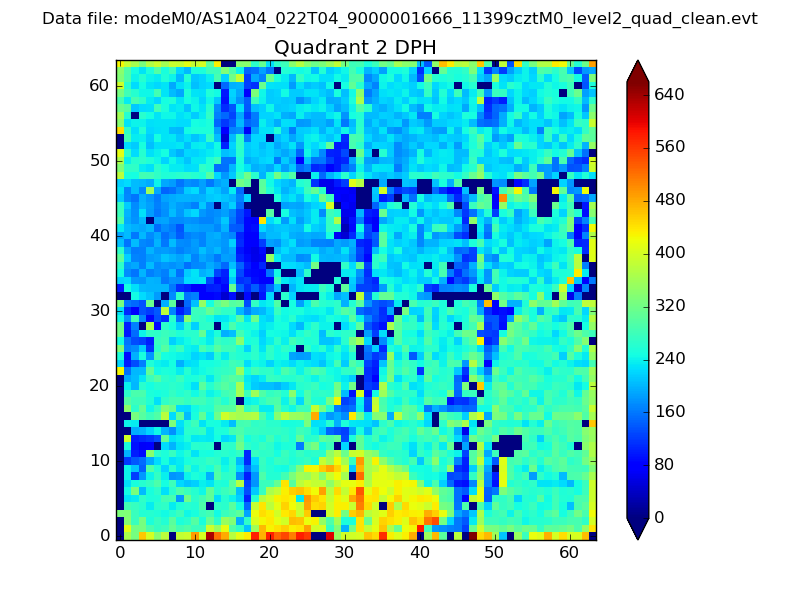
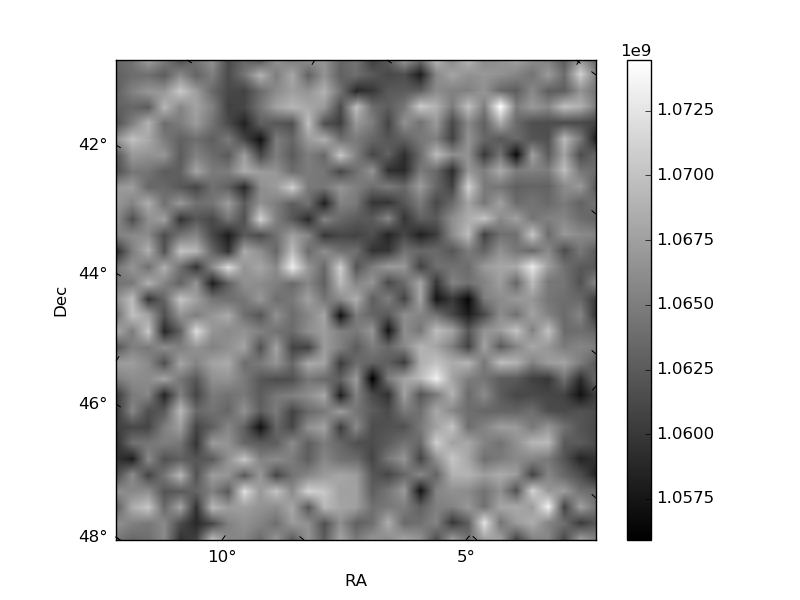
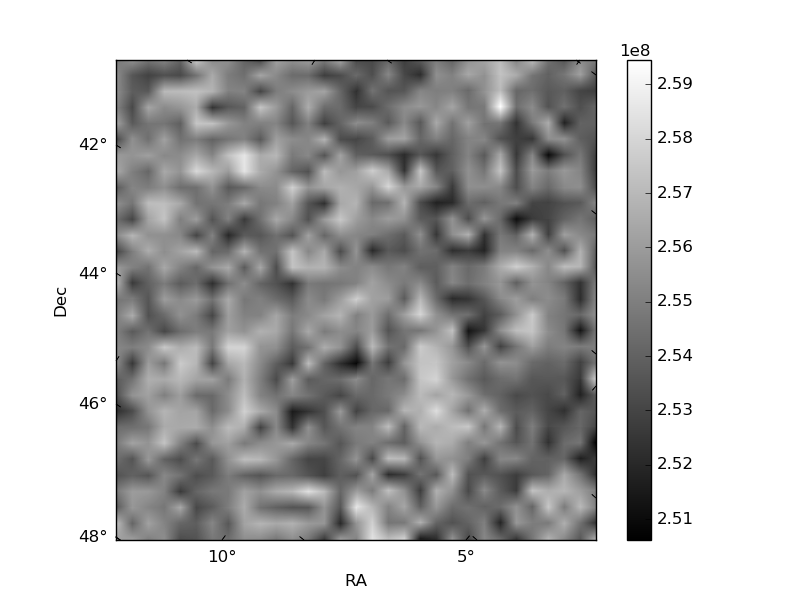
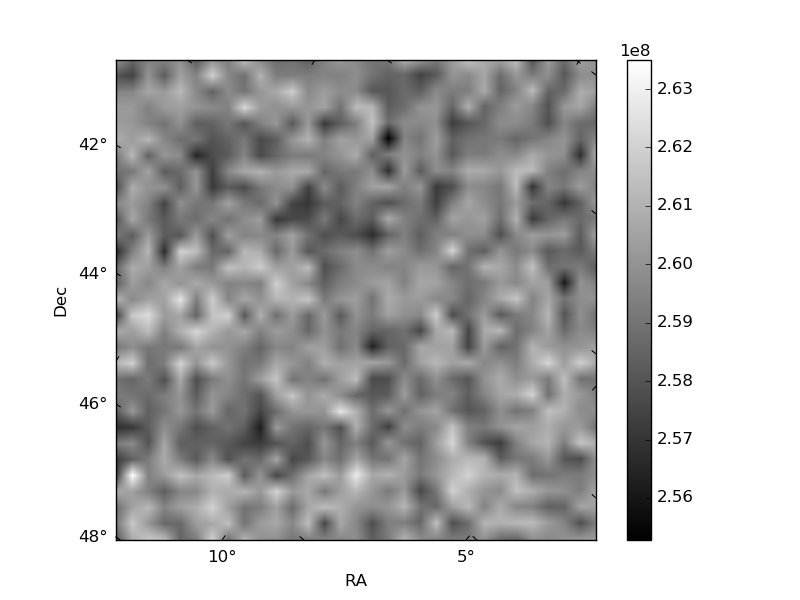
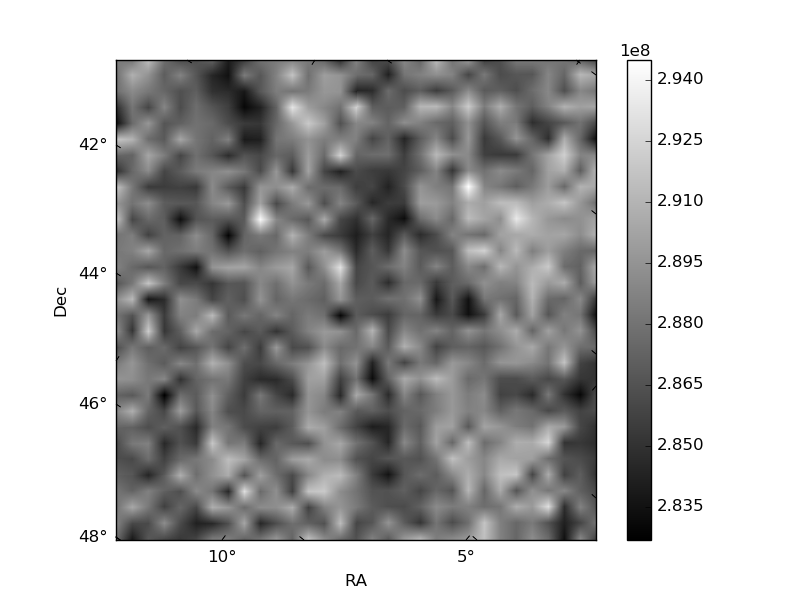
Histogram calculated using DETX and DETY for each event in the final _common_clean file
| Quadrant A | 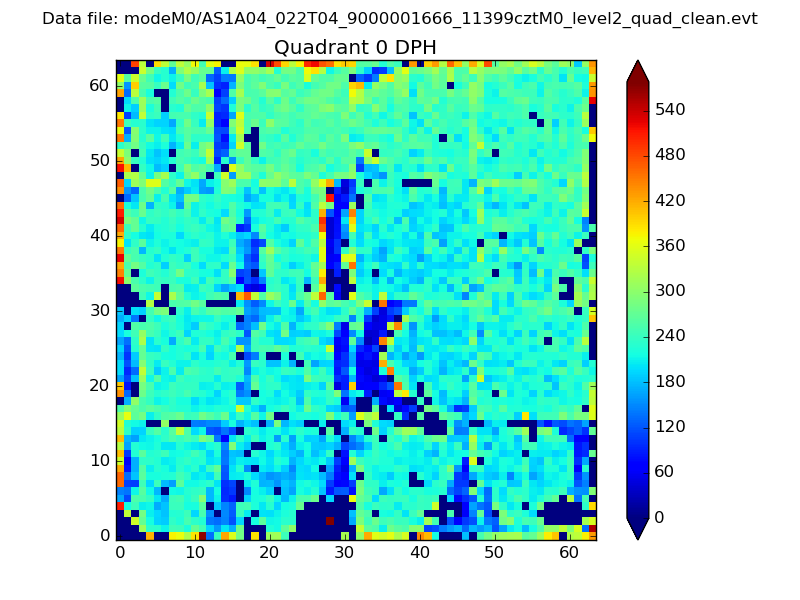 |
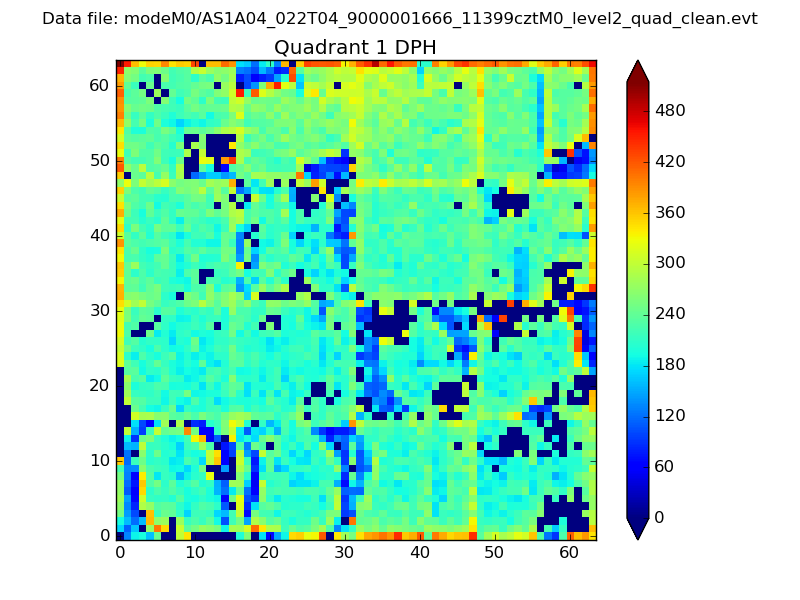 |
Quadrant B |
|---|---|---|---|
| Quadrant D | 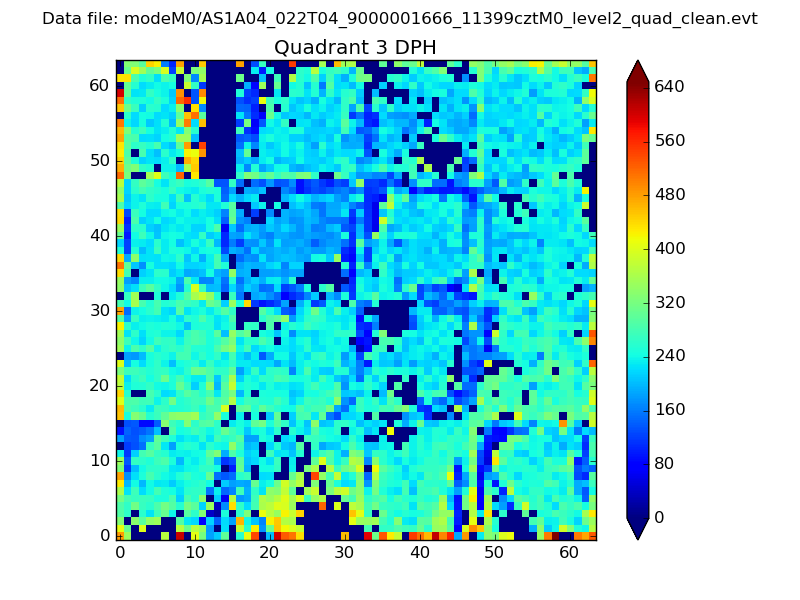 |
 |
Quadrant C |
| Plot type | Count rate plots | Images |
|---|---|---|
| Comparison with Poisson distribution Blue bars denote a histogram of data divided into 1 sec bins. Red curve is a Poisson curve with rate = median count rate of data. |
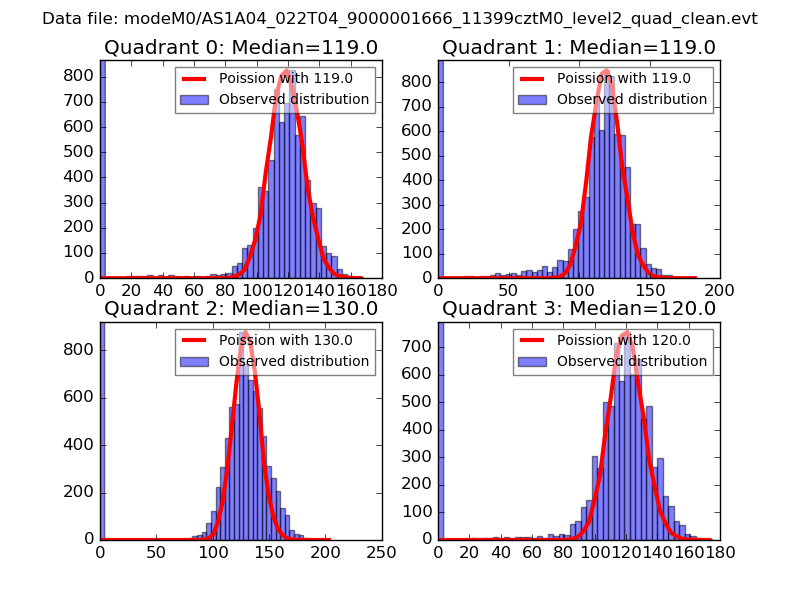 |
 |
| Quadrant-wise count rates Data is divided into 100 sec bins |
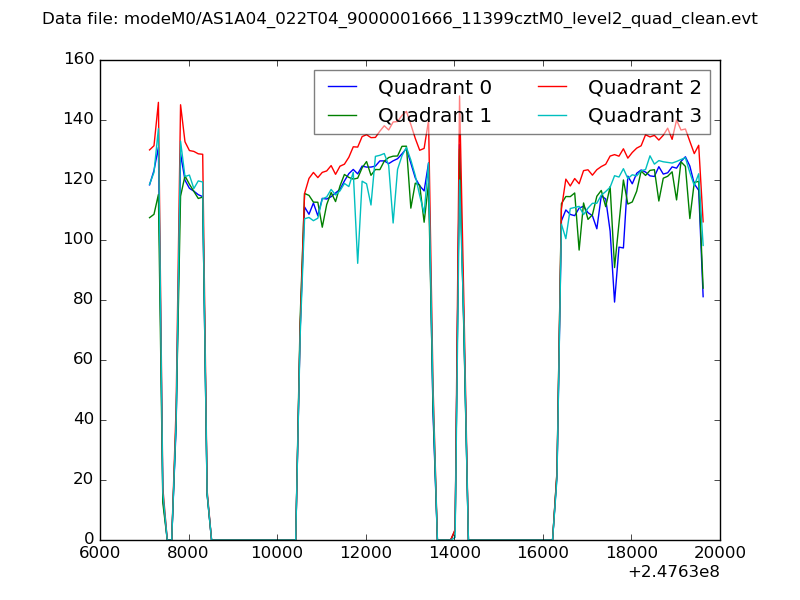 |
|
| Module-wise count rates for Quadrant A Data is divided into 100 sec bins |
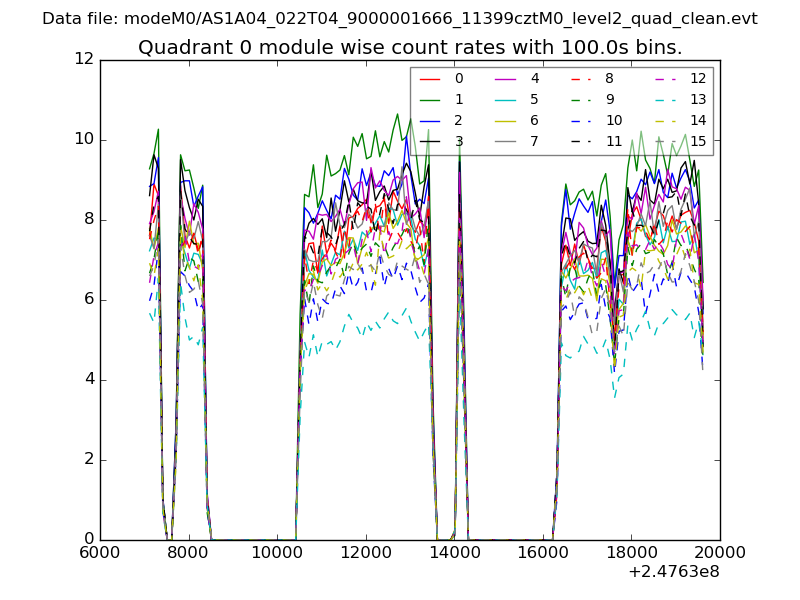 |
 |
| Module-wise count rates for Quadrant B Data is divided into 100 sec bins |
 |
 |
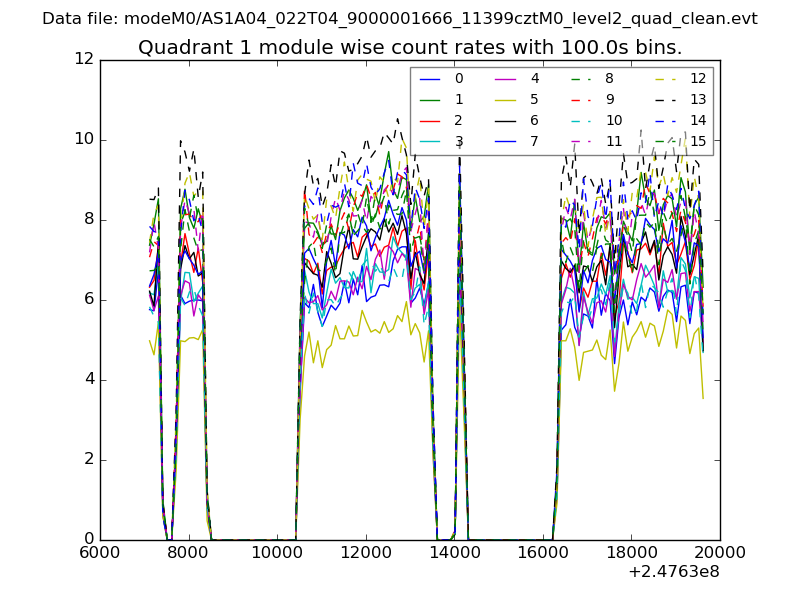
| Module-wise count rates for Quadrant C Data is divided into 100 sec bins |
 |
 |
| Module-wise count rates for Quadrant D Data is divided into 100 sec bins |
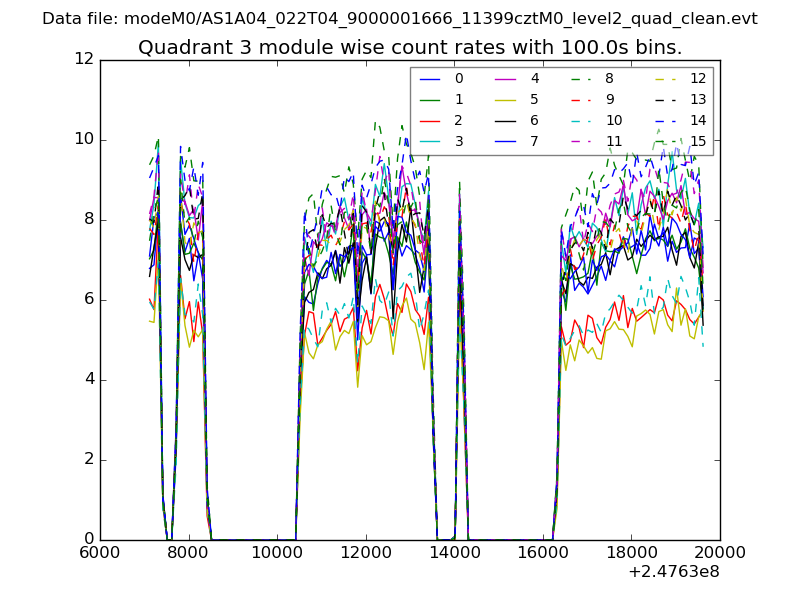 |
 |
| Parameter | Plot |
|---|---|
| CZT HV Monitor |  |
| D_VDD | 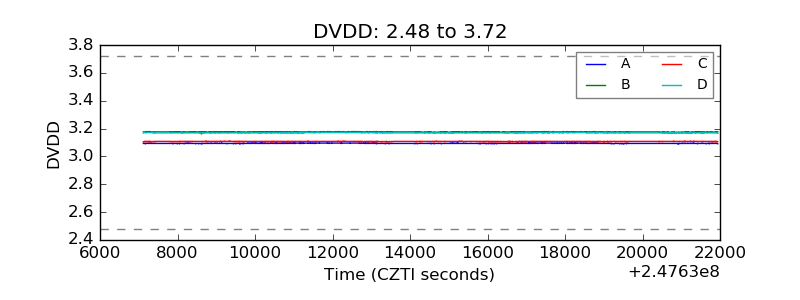 |
| Temperature 1 | 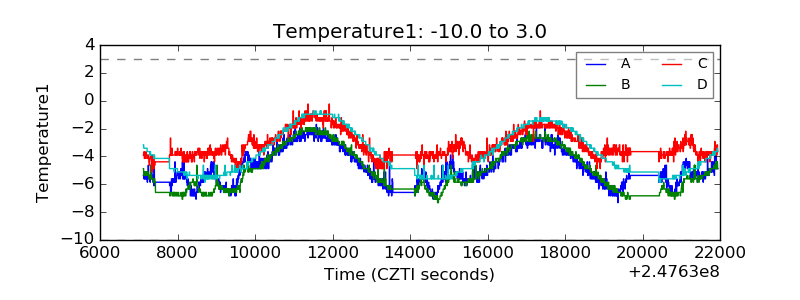 |
| Veto HV Monitor | 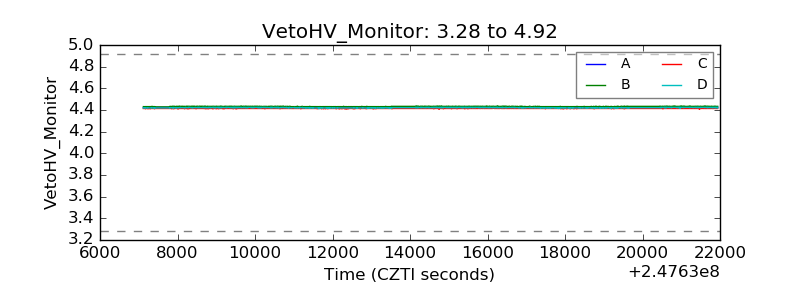 |
| Veto LLD | 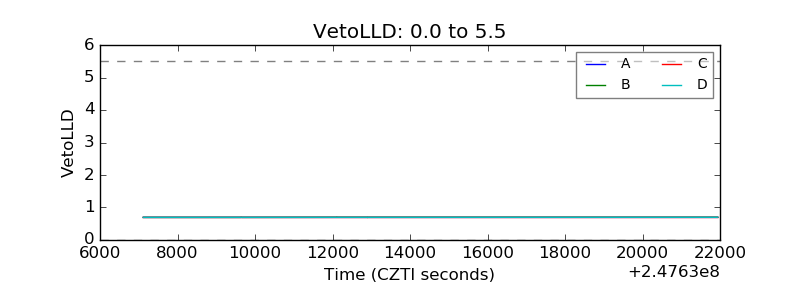 |
| Alpha Counter | 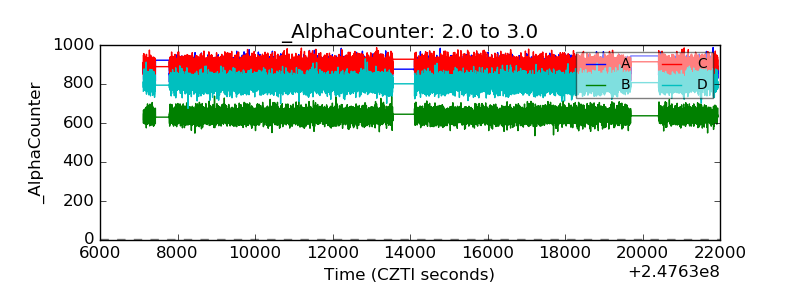 |
| _CPM_Rate | 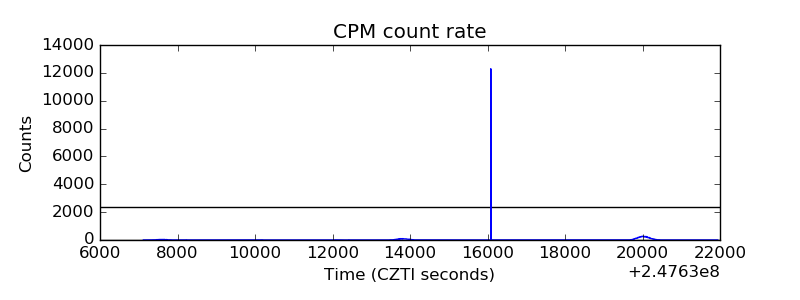 |
| CZT Counter | 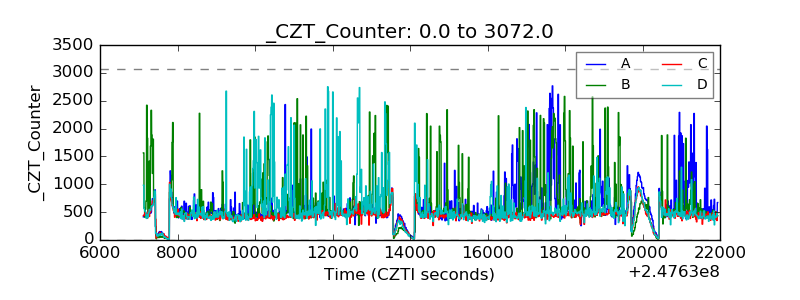 |
| +2.5 Volts monitor |  |
| +5 Volts monitor | 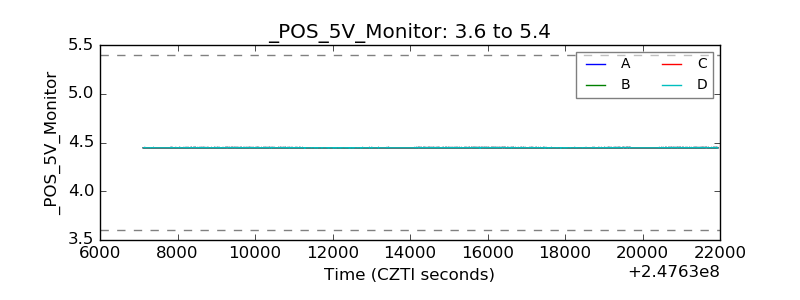 |
| _ROLL_ROT | 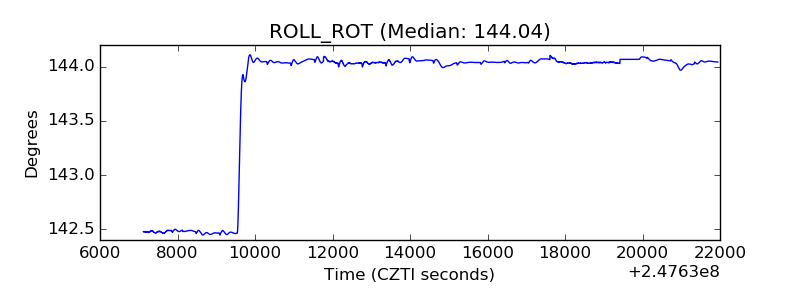 |
| _Roll_DEC | 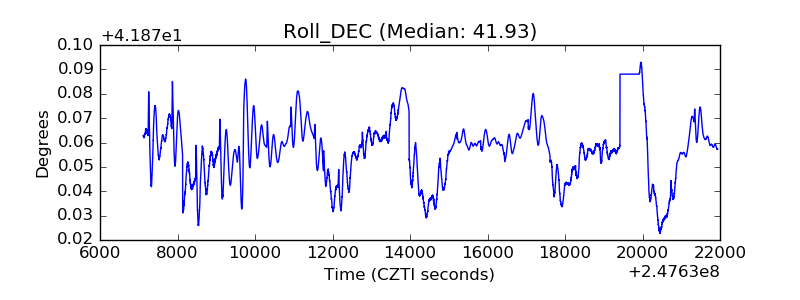 |
| _Roll_RA | 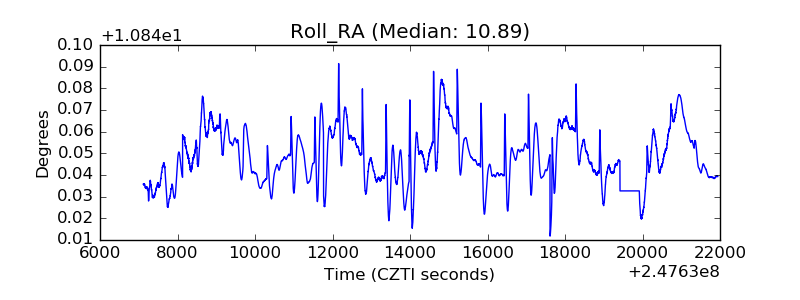 |
| Veto Counter | 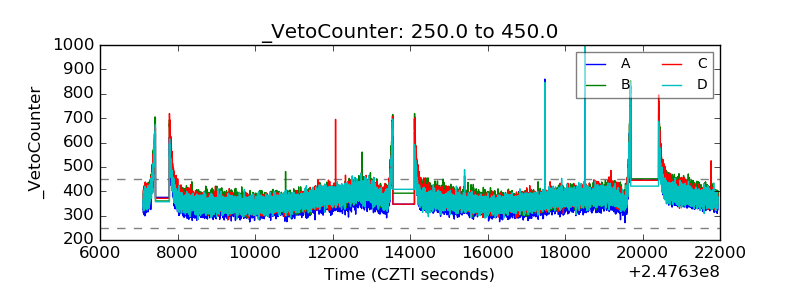 |