| Param | Original file | Final file |
|---|---|---|
| Filename | modeM0/AS1A04_022T04_9000001666_11400cztM0_level2.evt | modeM0/AS1A04_022T04_9000001666_11400cztM0_level2_quad_clean.evt |
| Size (bytes) | 597,772,800 | 75,957,120 |
| Size | 570.1 MB | 72.4 MB |
| Events in quadrant A | 5,334,099 | 431,817 |
| Events in quadrant B | 4,341,559 | 449,178 |
| Events in quadrant C | 3,235,385 | 489,754 |
| Events in quadrant D | 4,716,853 | 440,006 |
| Mode M9 | |||
|---|---|---|---|
| Quadrant | BADHDUFLAG | Total packets | Discarded packets |
| A | 0 | 16 | 0 |
| B | 0 | 16 | 0 |
| C | 0 | 16 | 0 |
| D | 0 | 16 | 0 |
| Mode SS | |||
|---|---|---|---|
| Quadrant | BADHDUFLAG | Total packets | Discarded packets |
| A | 0 | 144 | 0 |
| B | 0 | 144 | 0 |
| C | 0 | 144 | 0 |
| D | 0 | 144 | 0 |
| Mode M0 | |||
|---|---|---|---|
| Quadrant | BADHDUFLAG | Total packets | Discarded packets |
| A | 0 | 20405 | 3 |
| B | 0 | 17424 | 2 |
| C | 0 | 14357 | 2 |
| D | 0 | 18624 | 2 |
| Quadrant | Total seconds | Saturated seconds | Saturation percentage |
|---|---|---|---|
| A | 7019 | 646 | 9.203590% |
| B | 7019 | 357 | 5.086195% |
| C | 7019 | 94 | 1.339222% |
| D | 7019 | 421 | 5.998005% |
Noise dominated data is calculated using 1-second bins in cleaned event files. If a bin has >2000 counts, and if more than 50% of those come from <1% of pixels, then it is considered to be noise-dominated and hence unusable.
| Quadrant | # 1 sec bins | Bins with >0 counts | Bins with >2000 counts | High rate bins dominated by noise | Noise dominated (total time) | Noise dominated (detector-on time) | Marked lightcurve |
|---|---|---|---|---|---|---|---|
| A | 8644 | 7021 | 315 | 315 | 3.64% | 4.49% | 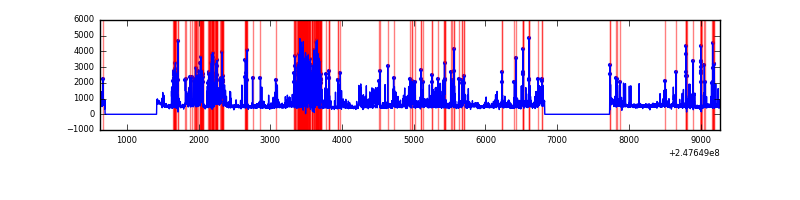 |
| B | 8644 | 7021 | 121 | 121 | 1.40% | 1.72% | 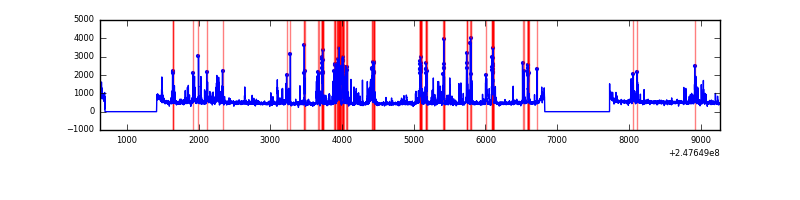 |
| C | 8644 | 7021 | 0 | 0 | 0.00% | 0.00% | 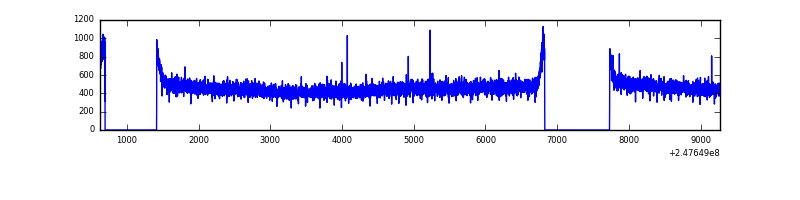 |
| D | 8643 | 7020 | 254 | 254 | 2.94% | 3.62% | 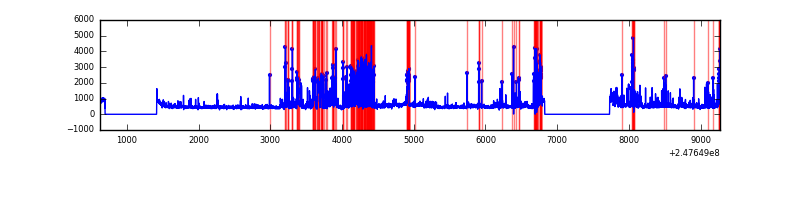 |
Top three noisy pixels from each quadrant. If the there are fewer than three noisy pixels in the level2.evt file, extra rows are filled as -1
| Pixel properties | Quadrant properties | ||||||
|---|---|---|---|---|---|---|---|
| Quadrant | DetID | PixID | Counts | Sigma | Mean | Median | Sigma |
| A | 8 | 5 | 2027344 | 12177.58 | 817 | 798 | 166.4 |
| A | 1 | 162 | 48977 | 289.51 | 817 | 798 | 166.4 |
| A | 1 | 178 | 26548 | 154.73 | 817 | 798 | 166.4 |
| B | 4 | 239 | 975166 | 6025.22 | 836 | 814 | 161.7 |
| B | 3 | 189 | 43901 | 266.44 | 836 | 814 | 161.7 |
| B | 15 | 204 | 23852 | 142.46 | 836 | 814 | 161.7 |
| C | 13 | 61 | 5929 | 26.34 | 829 | 833 | 193.4 |
| C | 14 | 234 | 3145 | 11.95 | 829 | 833 | 193.4 |
| C | 3 | 202 | 2060 | 6.34 | 829 | 833 | 193.4 |
| D | 1 | 52 | 860291 | 4398.0 | 808 | 784 | 195.4 |
| D | 10 | 253 | 246132 | 1255.42 | 808 | 784 | 195.4 |
| D | 13 | 249 | 228444 | 1164.91 | 808 | 784 | 195.4 |
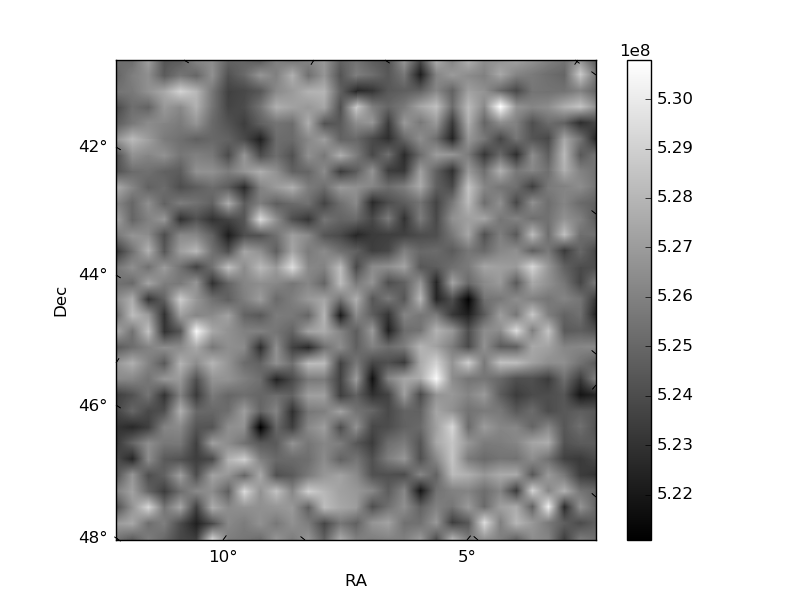
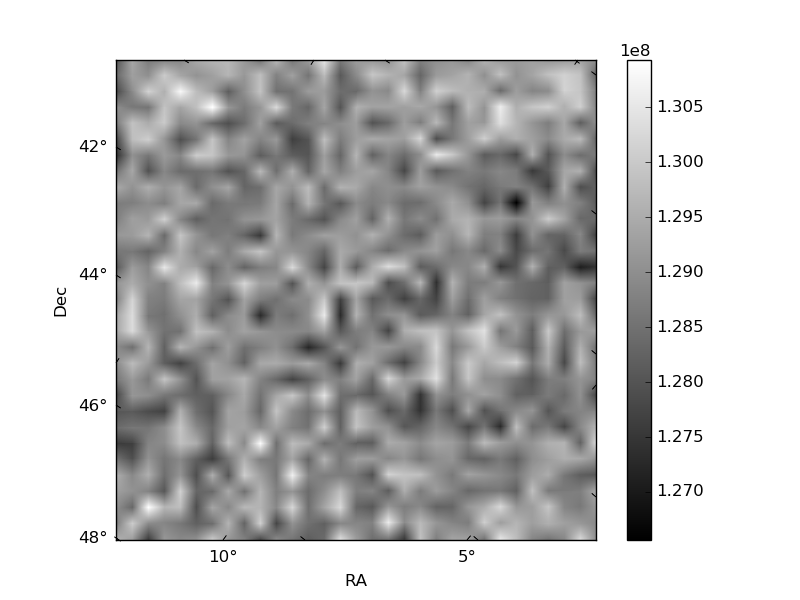
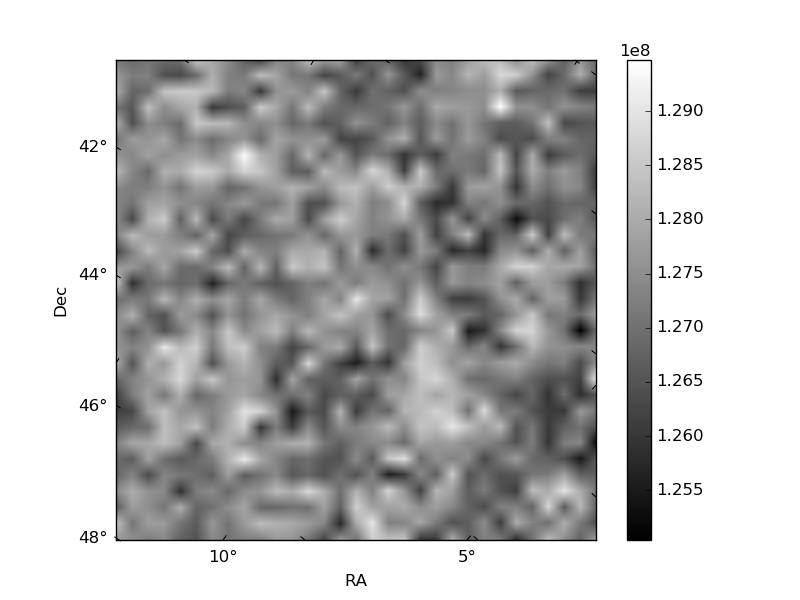
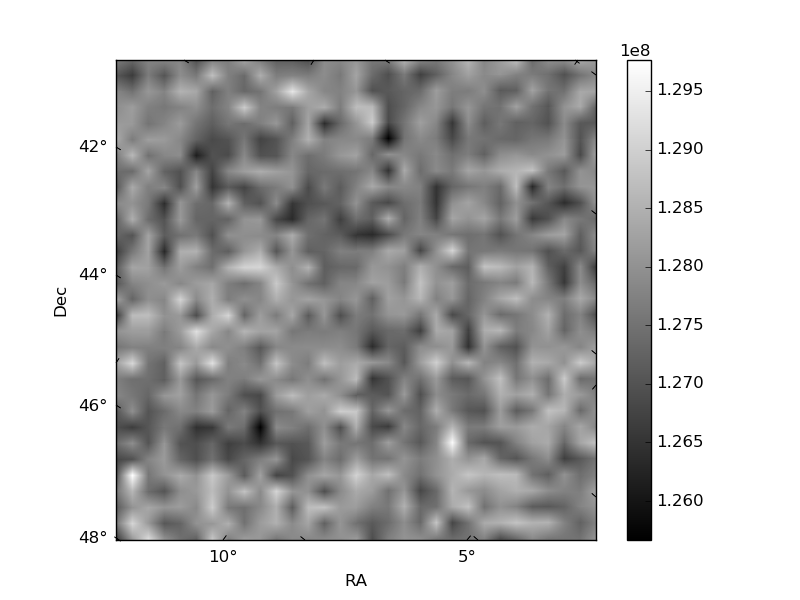
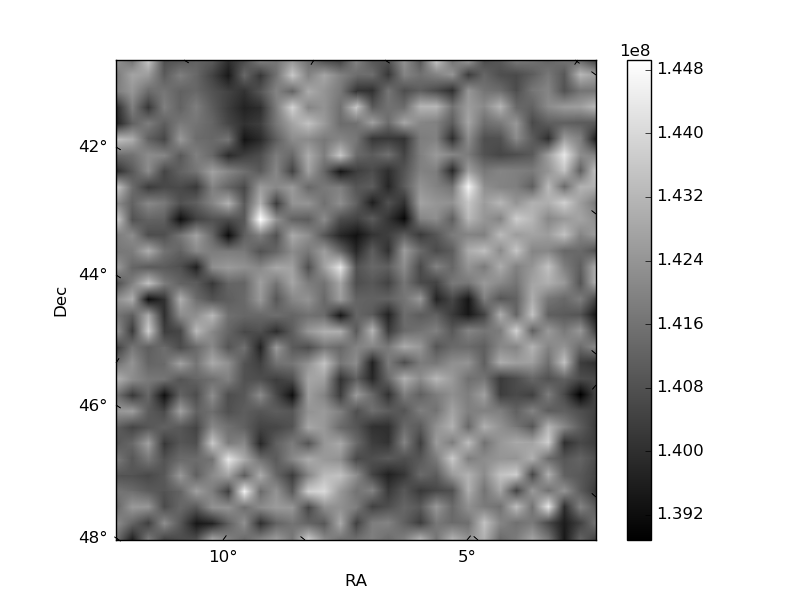
Histogram calculated using DETX and DETY for each event in the final _common_clean file
| Quadrant A | 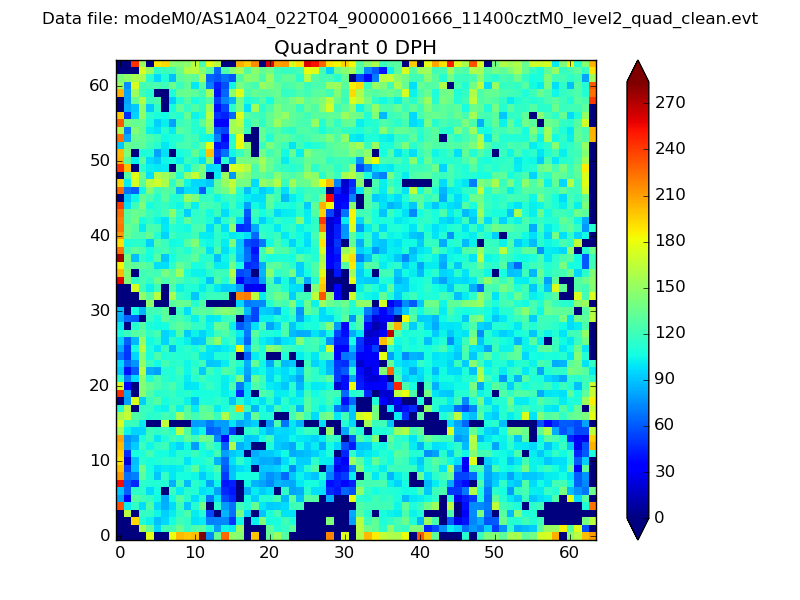 |
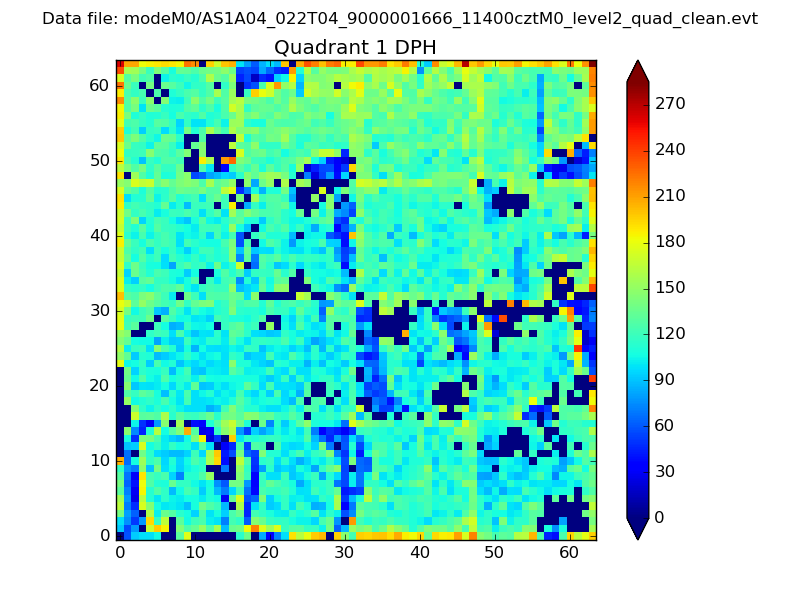 |
Quadrant B |
|---|---|---|---|
| Quadrant D | 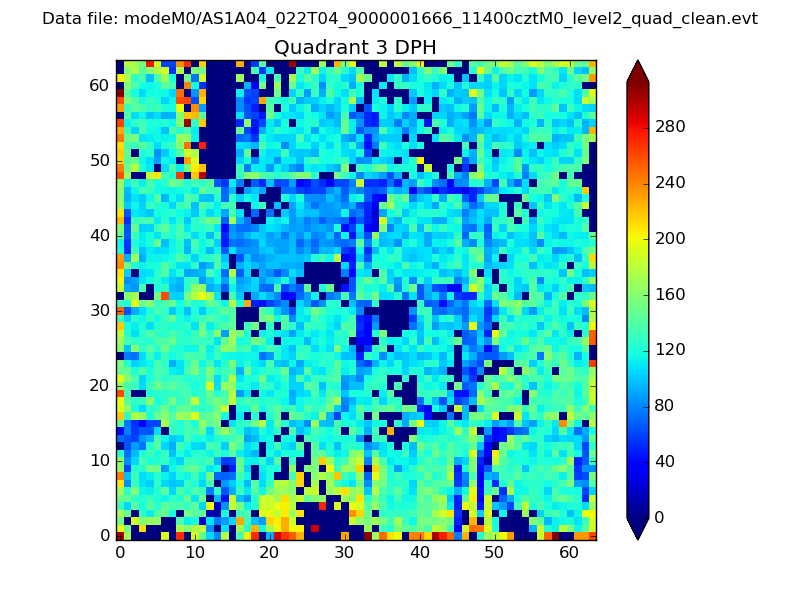 |
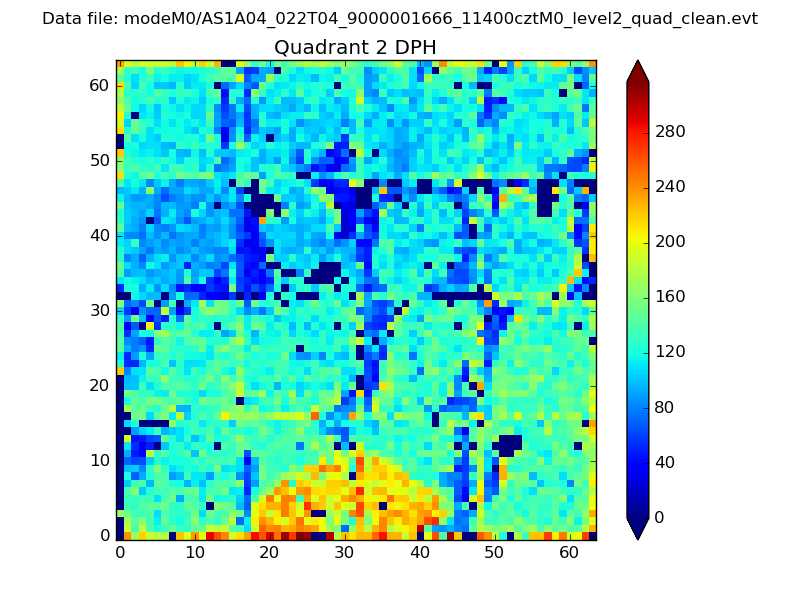 |
Quadrant C |
| Plot type | Count rate plots | Images |
|---|---|---|
| Comparison with Poisson distribution Blue bars denote a histogram of data divided into 1 sec bins. Red curve is a Poisson curve with rate = median count rate of data. |
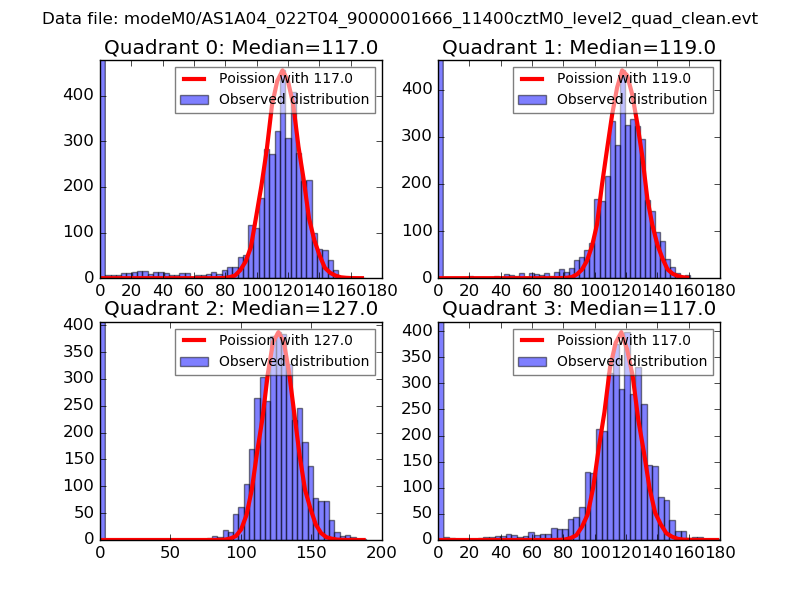 |
 |
| Quadrant-wise count rates Data is divided into 100 sec bins |
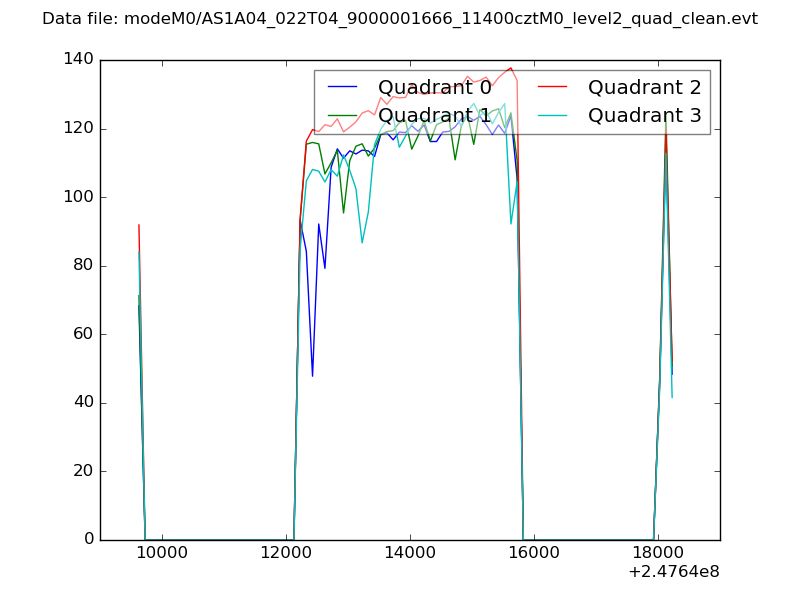 |
|
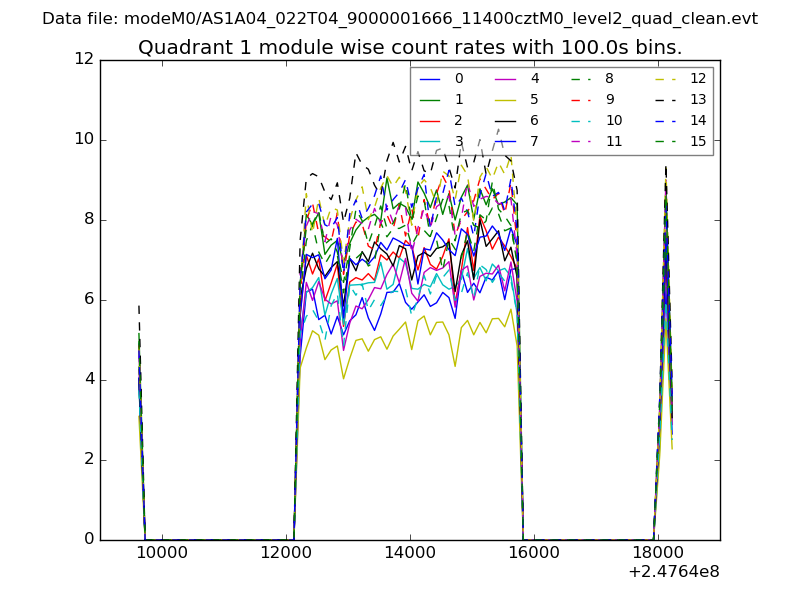
| Module-wise count rates for Quadrant A Data is divided into 100 sec bins |
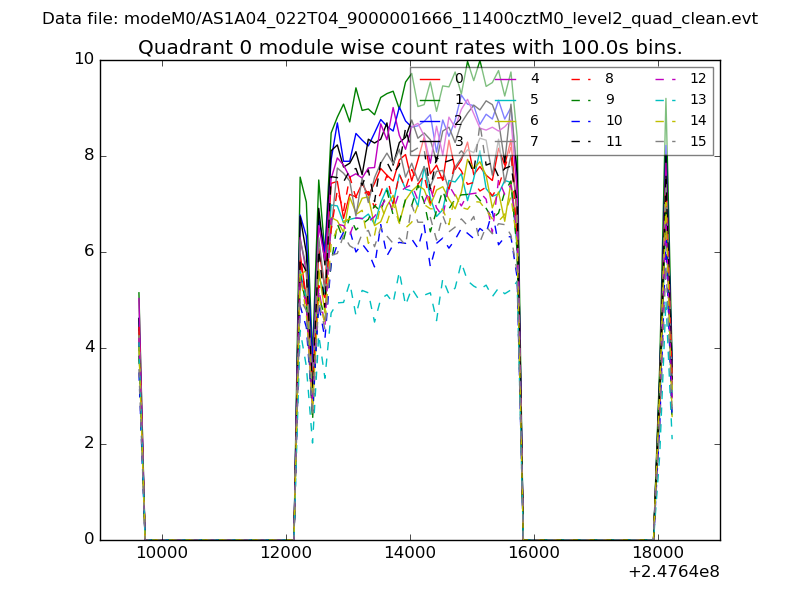 |
 |
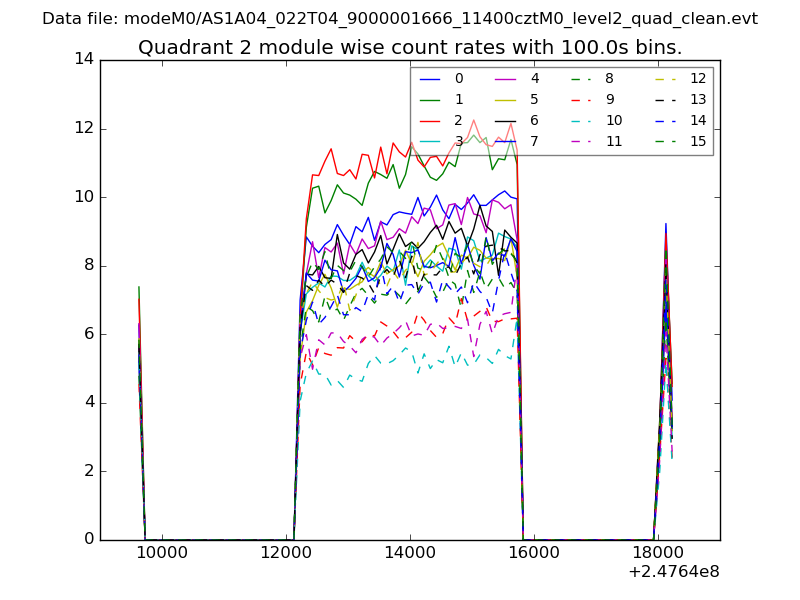
| Module-wise count rates for Quadrant B Data is divided into 100 sec bins |
 |
 |
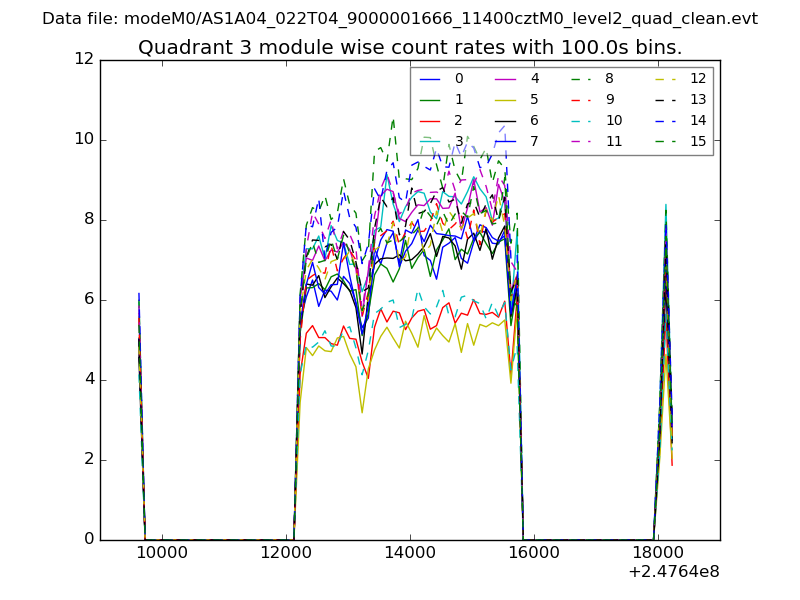
| Module-wise count rates for Quadrant C Data is divided into 100 sec bins |
 |
 |
| Module-wise count rates for Quadrant D Data is divided into 100 sec bins |
 |
 |
| Parameter | Plot |
|---|---|
| CZT HV Monitor | 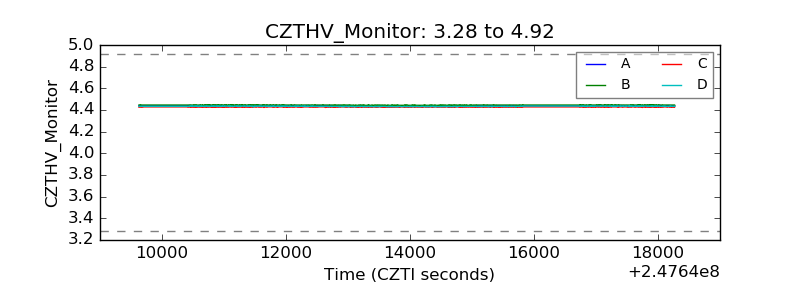 |
| D_VDD | 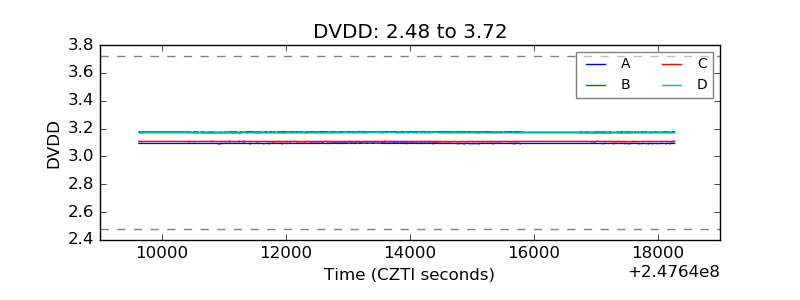 |
| Temperature 1 | 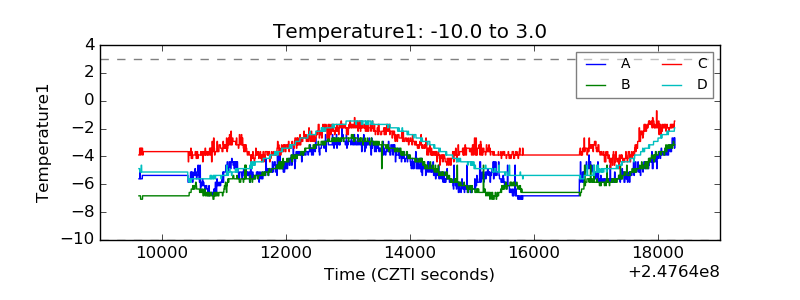 |
| Veto HV Monitor | 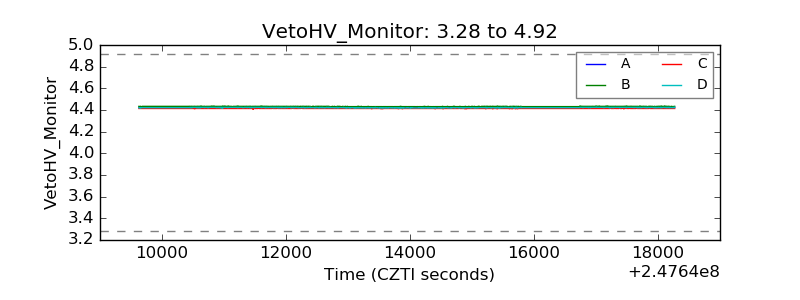 |
| Veto LLD | 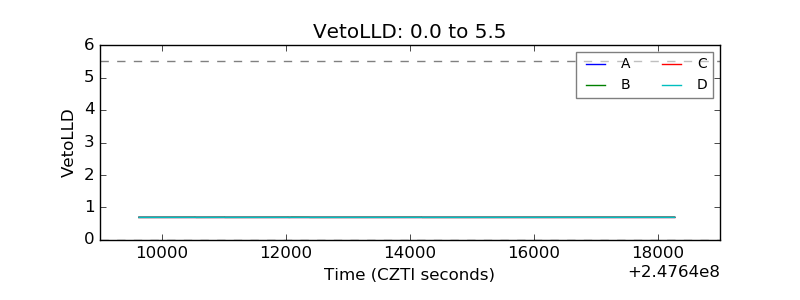 |
| Alpha Counter | 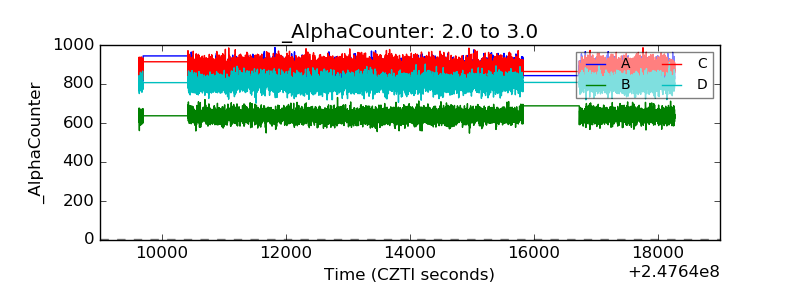 |
| _CPM_Rate | 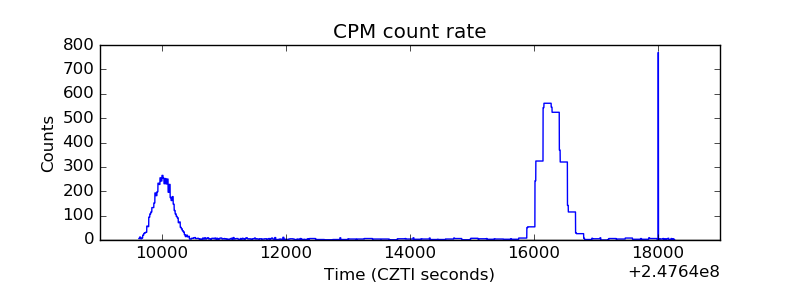 |
| CZT Counter | 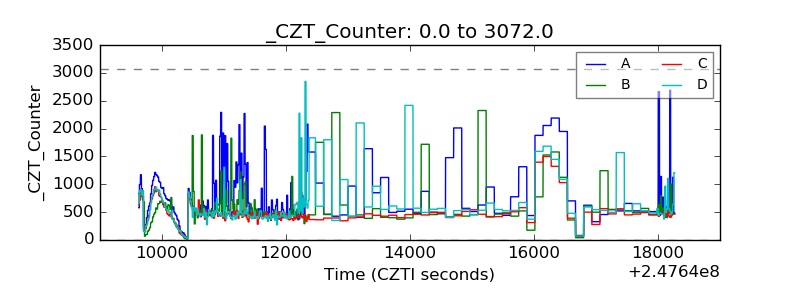 |
| +2.5 Volts monitor |  |
| +5 Volts monitor |  |
| _ROLL_ROT | 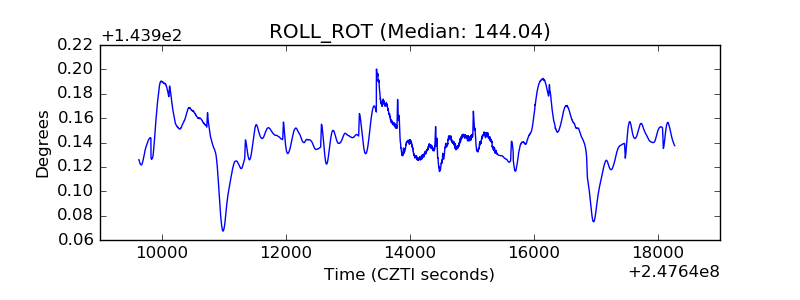 |
| _Roll_DEC | 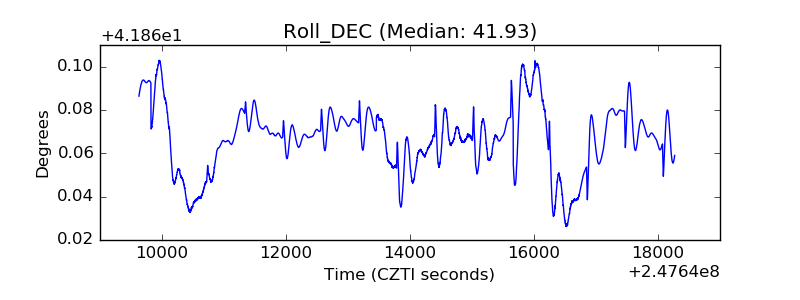 |
| _Roll_RA | 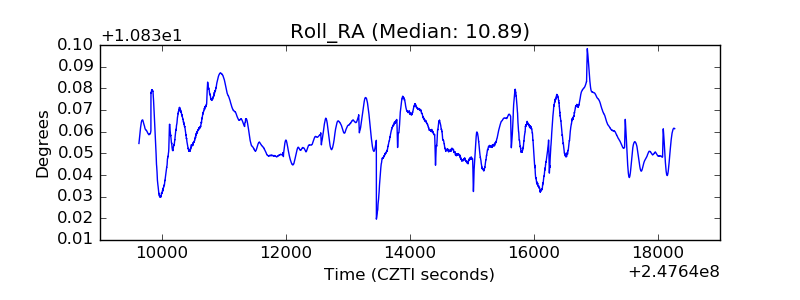 |
| Veto Counter | 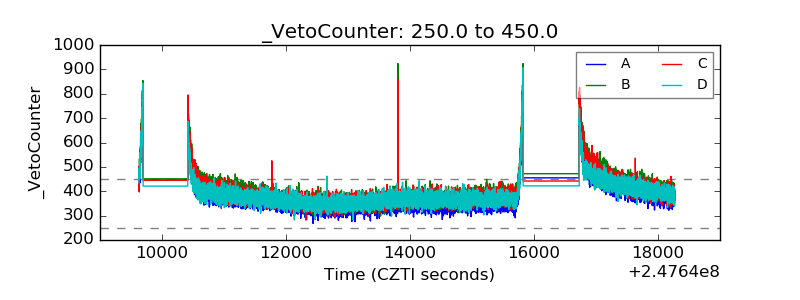 |