| Param | Original file | Final file |
|---|---|---|
| Filename | modeM0/AS1A04_022T04_9000001666_11401cztM0_level2.evt | modeM0/AS1A04_022T04_9000001666_11401cztM0_level2_quad_clean.evt |
| Size (bytes) | 520,372,800 | 85,432,320 |
| Size | 496.3 MB | 81.5 MB |
| Events in quadrant A | 3,560,383 | 525,772 |
| Events in quadrant B | 4,203,615 | 519,795 |
| Events in quadrant C | 3,056,953 | 564,228 |
| Events in quadrant D | 4,491,175 | 517,359 |
| Mode M9 | |||
|---|---|---|---|
| Quadrant | BADHDUFLAG | Total packets | Discarded packets |
| A | 0 | 11 | 0 |
| B | 0 | 11 | 0 |
| C | 0 | 11 | 0 |
| D | 0 | 11 | 0 |
| Mode SS | |||
|---|---|---|---|
| Quadrant | BADHDUFLAG | Total packets | Discarded packets |
| A | 0 | 134 | 0 |
| B | 0 | 134 | 0 |
| C | 0 | 134 | 0 |
| D | 0 | 134 | 0 |
| Mode M0 | |||
|---|---|---|---|
| Quadrant | BADHDUFLAG | Total packets | Discarded packets |
| A | 0 | 14749 | 2 |
| B | 0 | 16713 | 1 |
| C | 0 | 13393 | 1 |
| D | 0 | 17798 | 1 |
| Quadrant | Total seconds | Saturated seconds | Saturation percentage |
|---|---|---|---|
| A | 6593 | 111 | 1.683604% |
| B | 6593 | 302 | 4.580616% |
| C | 6593 | 33 | 0.500531% |
| D | 6593 | 192 | 2.912180% |
Noise dominated data is calculated using 1-second bins in cleaned event files. If a bin has >2000 counts, and if more than 50% of those come from <1% of pixels, then it is considered to be noise-dominated and hence unusable.
| Quadrant | # 1 sec bins | Bins with >0 counts | Bins with >2000 counts | High rate bins dominated by noise | Noise dominated (total time) | Noise dominated (detector-on time) | Marked lightcurve |
|---|---|---|---|---|---|---|---|
| A | 7688 | 6594 | 39 | 39 | 0.51% | 0.59% |  |
| B | 7688 | 6594 | 157 | 157 | 2.04% | 2.38% | 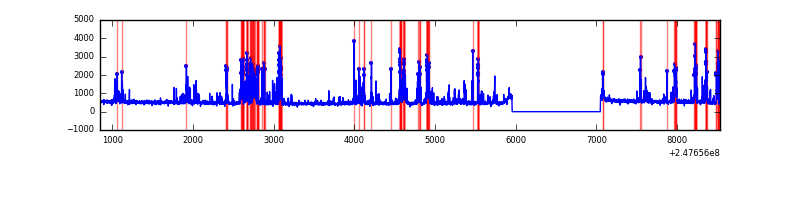 |
| C | 7688 | 6594 | 0 | 0 | 0.00% | 0.00% | 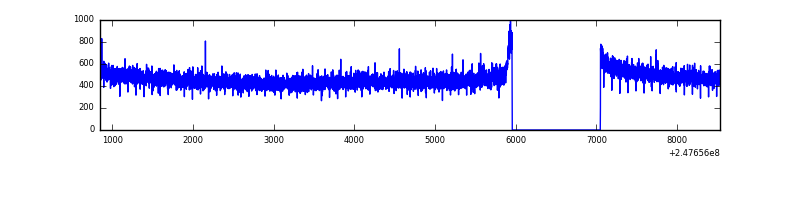 |
| D | 7688 | 6594 | 104 | 104 | 1.35% | 1.58% | 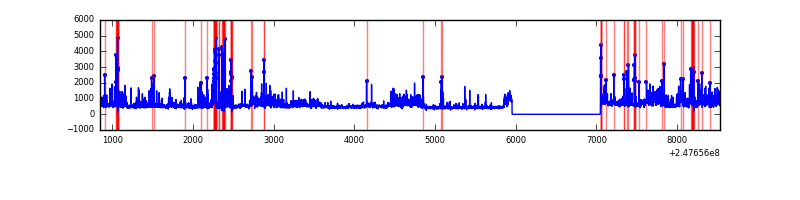 |
Top three noisy pixels from each quadrant. If the there are fewer than three noisy pixels in the level2.evt file, extra rows are filled as -1
| Pixel properties | Quadrant properties | ||||||
|---|---|---|---|---|---|---|---|
| Quadrant | DetID | PixID | Counts | Sigma | Mean | Median | Sigma |
| A | 8 | 5 | 314419 | 1920.65 | 802 | 784 | 163.3 |
| A | 1 | 162 | 60948 | 368.44 | 802 | 784 | 163.3 |
| A | 1 | 178 | 35689 | 213.75 | 802 | 784 | 163.3 |
| B | 4 | 239 | 981000 | 6408.7 | 789 | 768 | 153.0 |
| B | 3 | 189 | 95073 | 616.56 | 789 | 768 | 153.0 |
| B | 15 | 204 | 21610 | 136.26 | 789 | 768 | 153.0 |
| C | 8 | 222 | 6317 | 30.42 | 783 | 788 | 181.7 |
| C | 13 | 61 | 5588 | 26.41 | 783 | 788 | 181.7 |
| C | 3 | 202 | 1916 | 6.21 | 783 | 788 | 181.7 |
| D | 1 | 52 | 769577 | 4158.77 | 771 | 748 | 184.9 |
| D | 13 | 249 | 316051 | 1705.55 | 771 | 748 | 184.9 |
| D | 10 | 253 | 168585 | 907.87 | 771 | 748 | 184.9 |
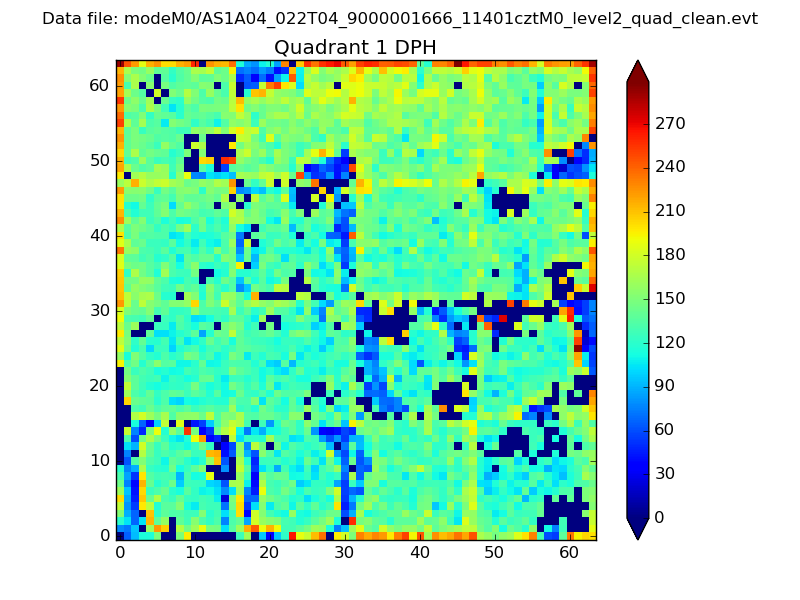
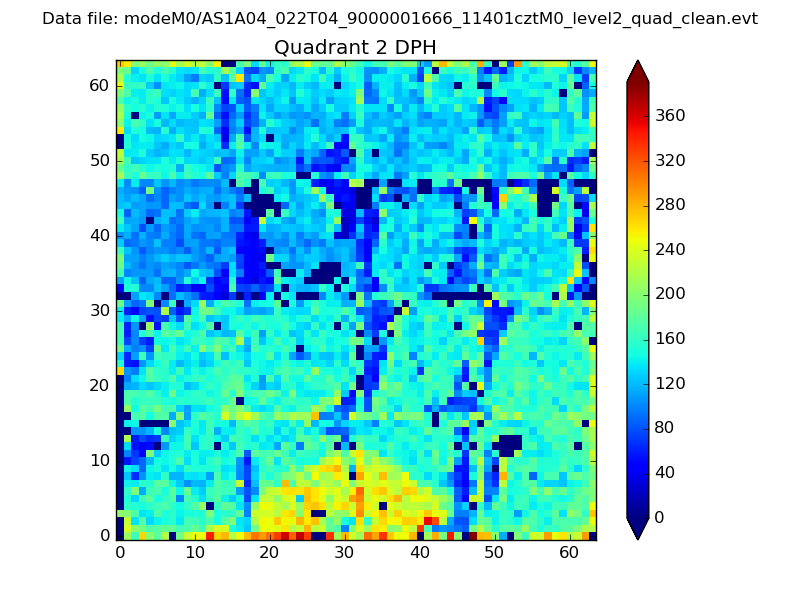
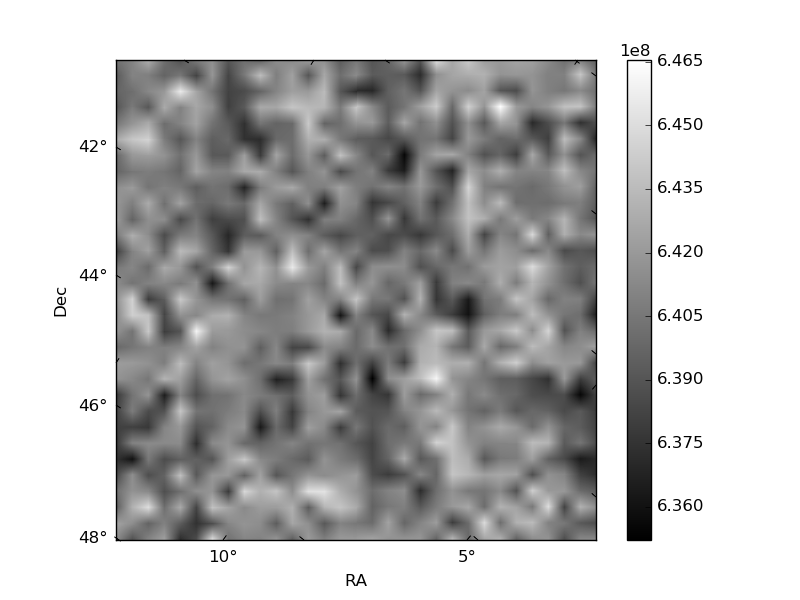
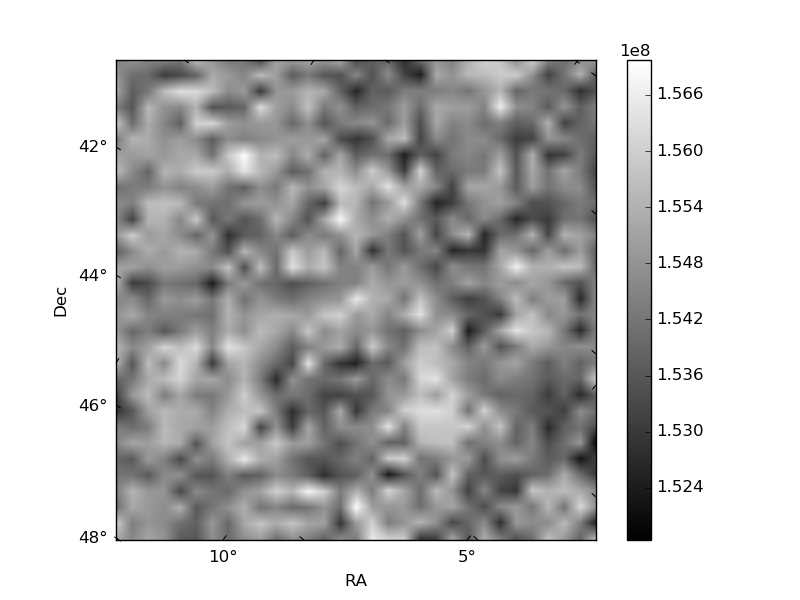
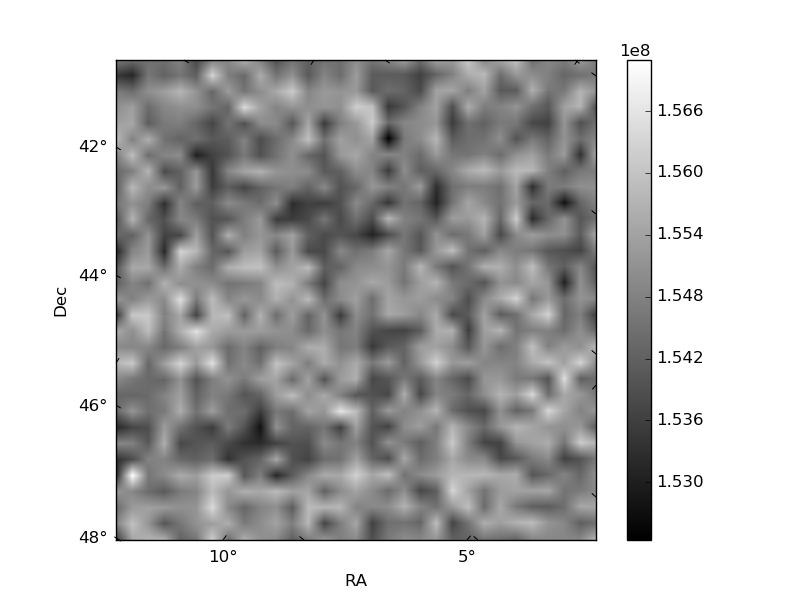
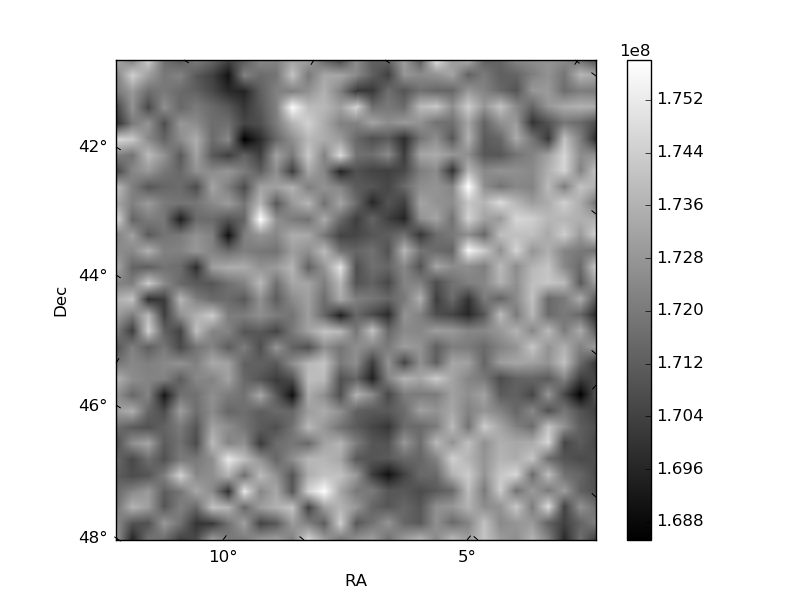
Histogram calculated using DETX and DETY for each event in the final _common_clean file
| Quadrant A | 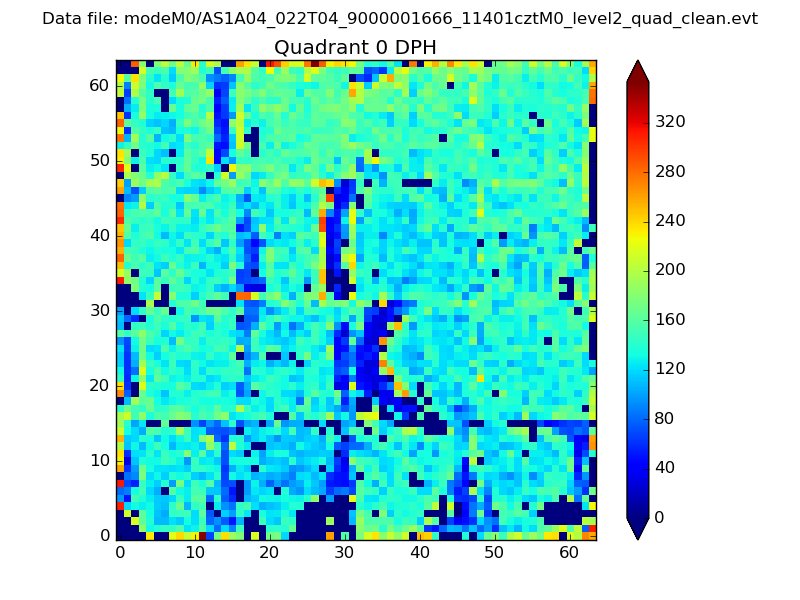 |
 |
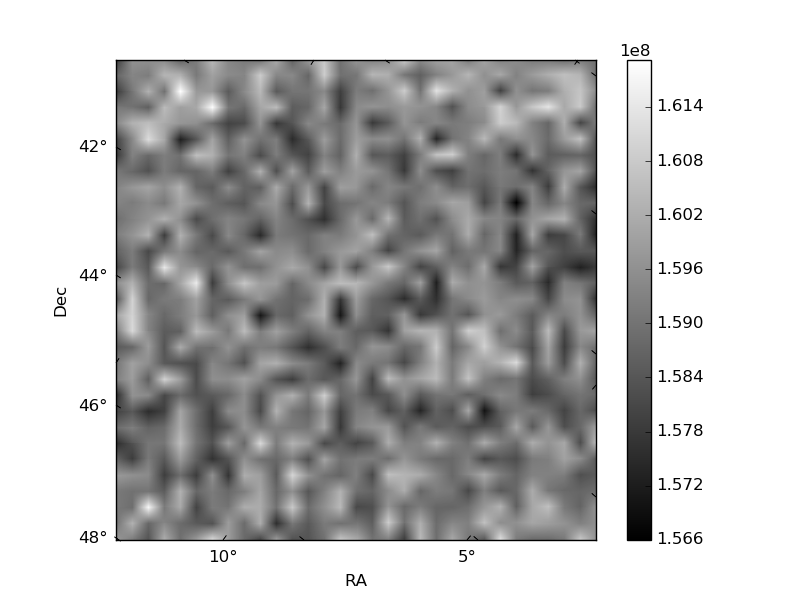
Quadrant B |
|---|---|---|---|
| Quadrant D | 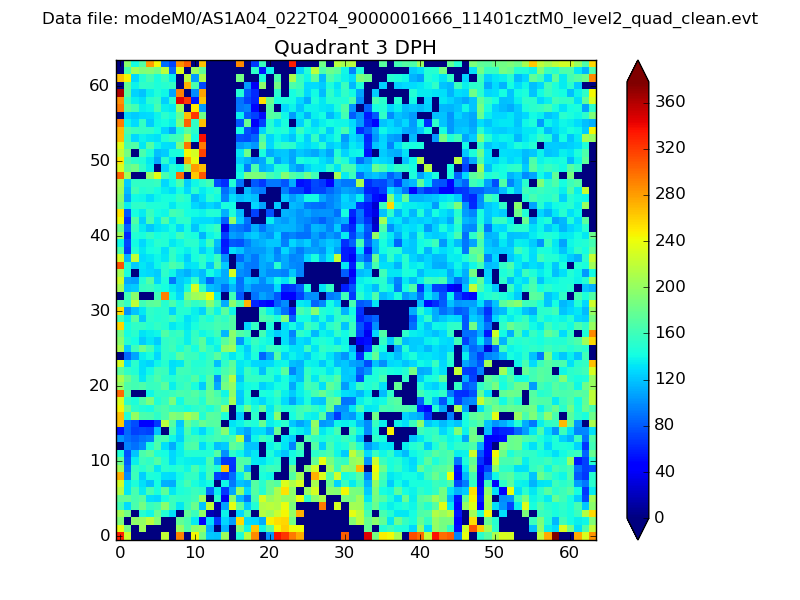 |
 |
Quadrant C |
| Plot type | Count rate plots | Images |
|---|---|---|
| Comparison with Poisson distribution Blue bars denote a histogram of data divided into 1 sec bins. Red curve is a Poisson curve with rate = median count rate of data. |
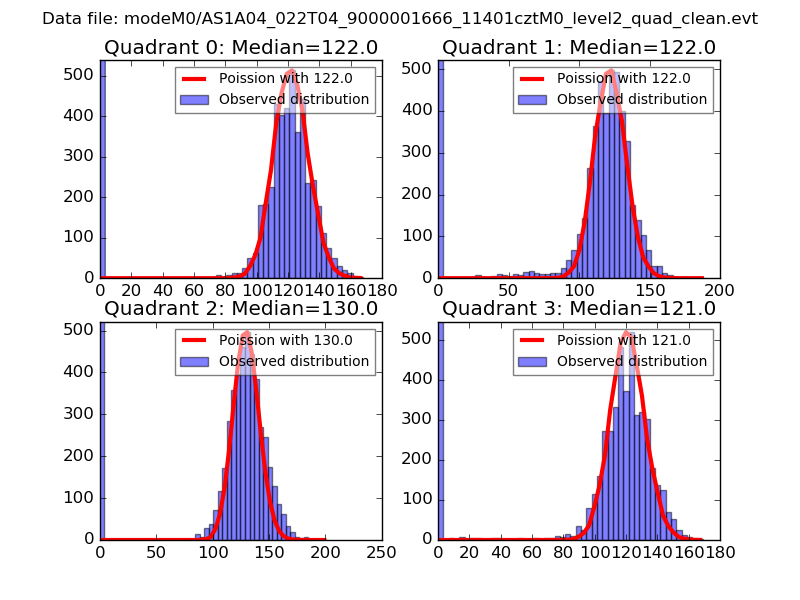 |
 |
| Quadrant-wise count rates Data is divided into 100 sec bins |
 |
|
| Module-wise count rates for Quadrant A Data is divided into 100 sec bins |
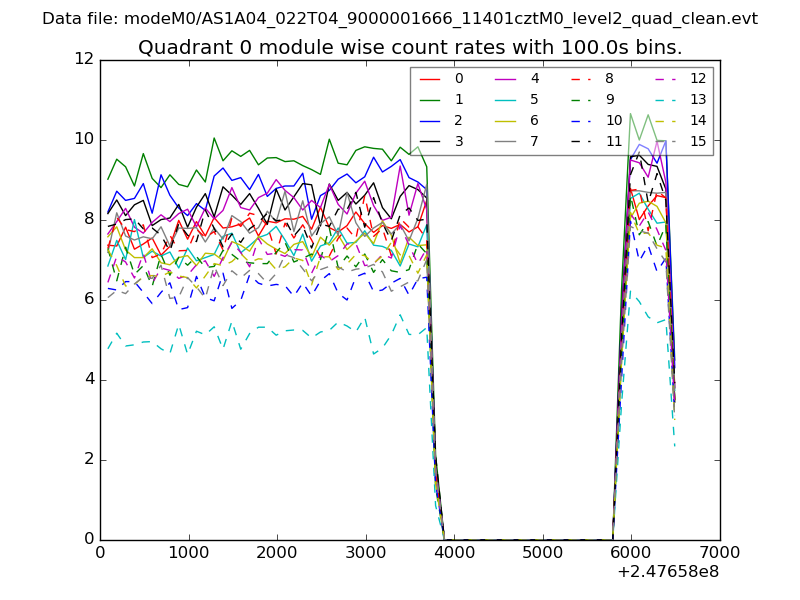 |
 |
| Module-wise count rates for Quadrant B Data is divided into 100 sec bins |
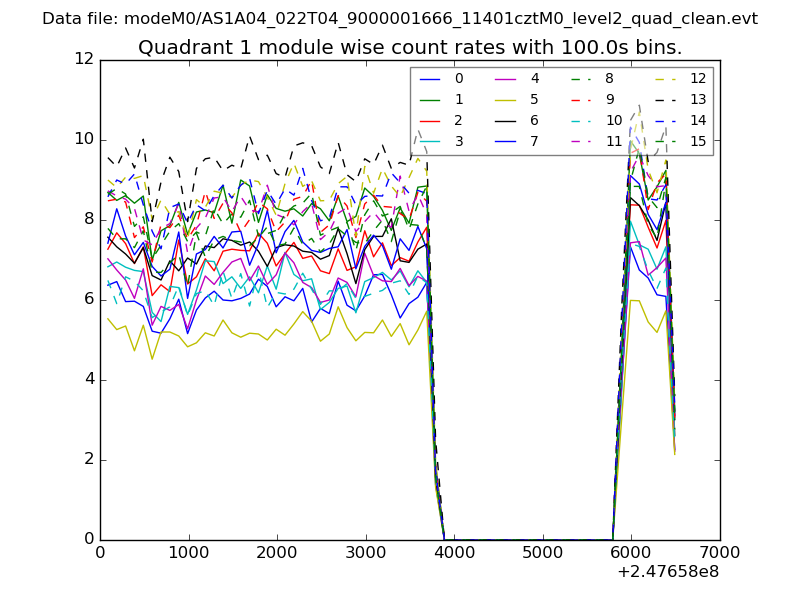 |
 |
| Module-wise count rates for Quadrant C Data is divided into 100 sec bins |
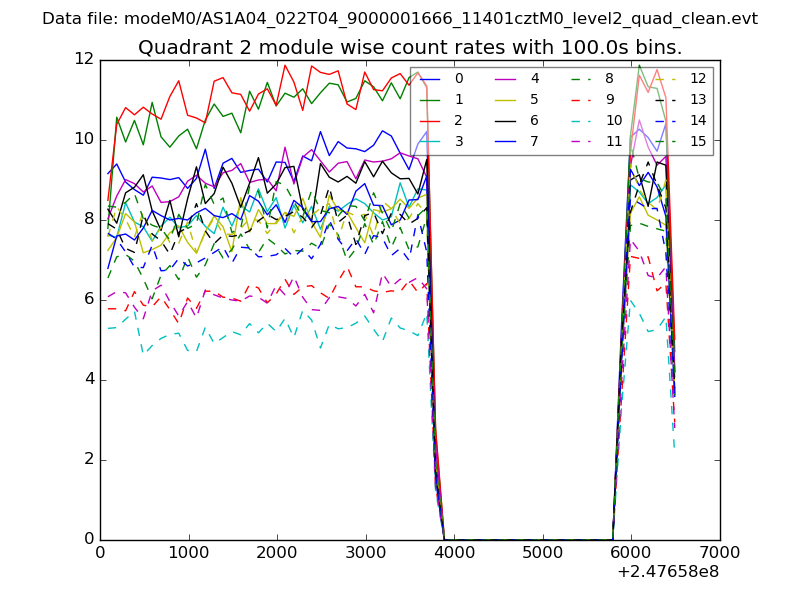 |
 |
| Module-wise count rates for Quadrant D Data is divided into 100 sec bins |
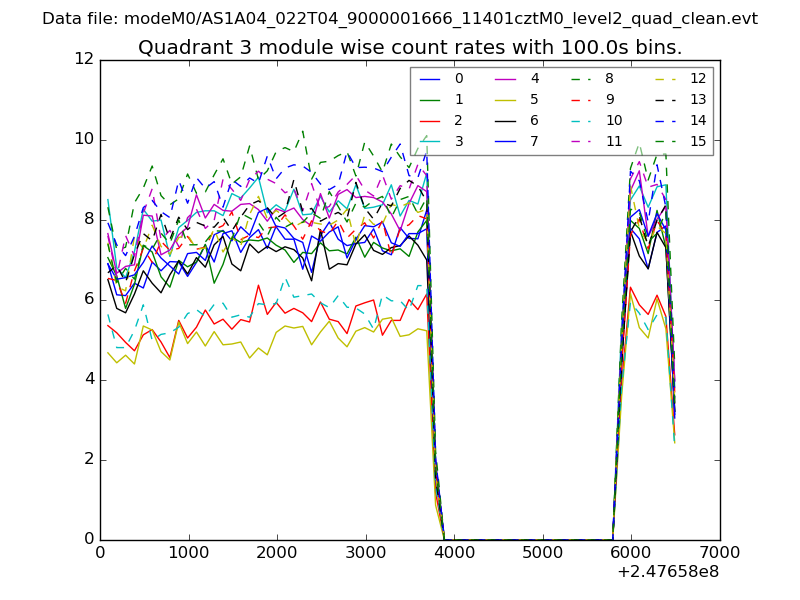 |
 |
| Parameter | Plot |
|---|---|
| CZT HV Monitor | 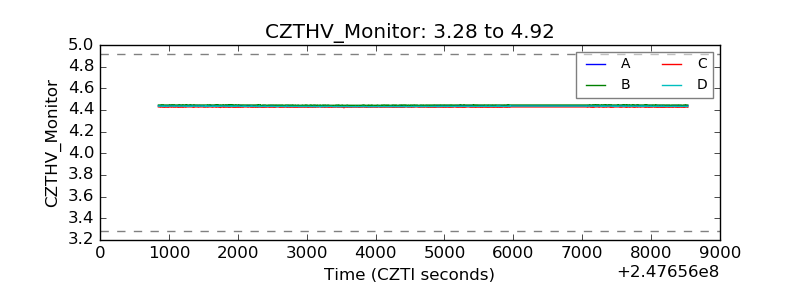 |
| D_VDD | 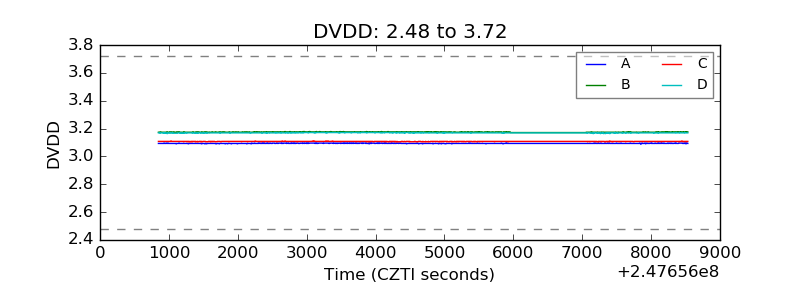 |
| Temperature 1 | 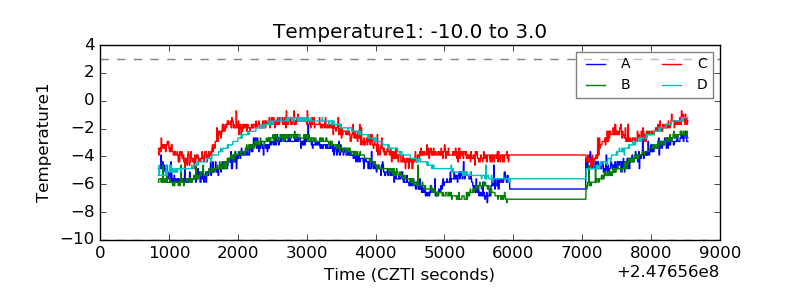 |
| Veto HV Monitor | 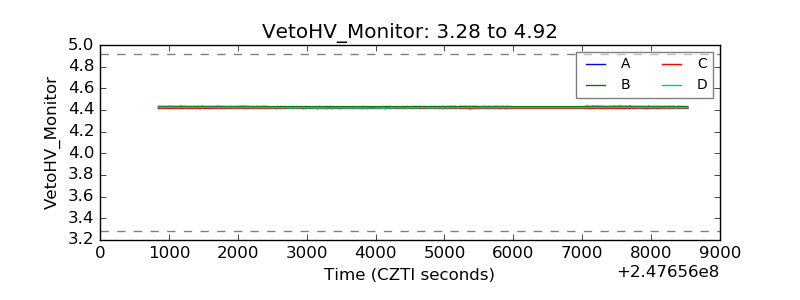 |
| Veto LLD | 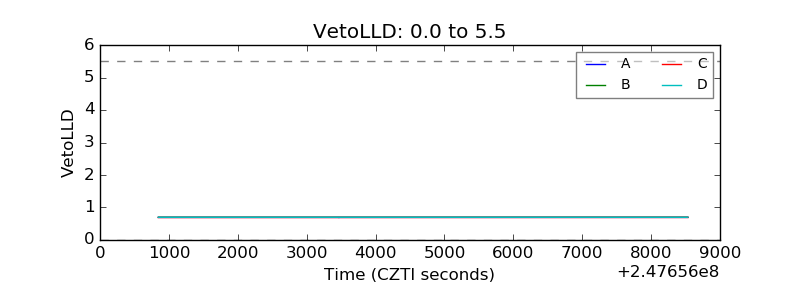 |
| Alpha Counter | 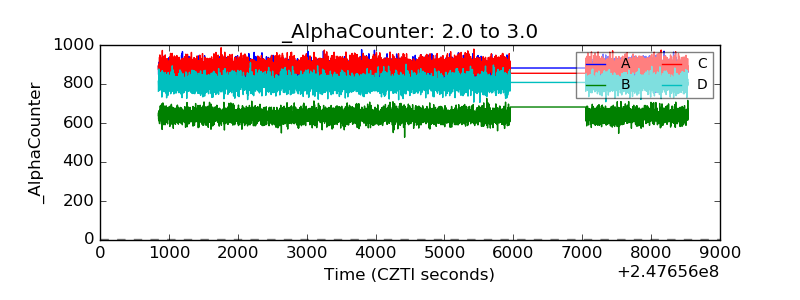 |
| _CPM_Rate | 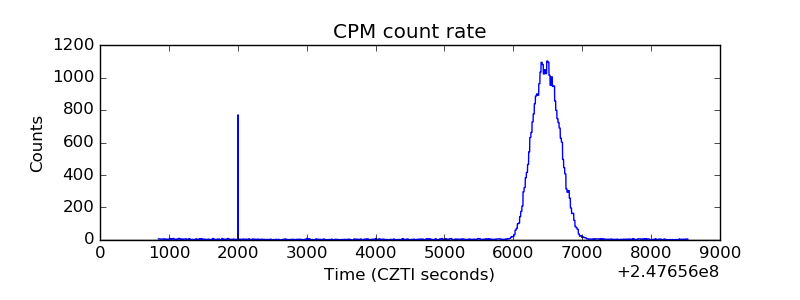 |
| CZT Counter | 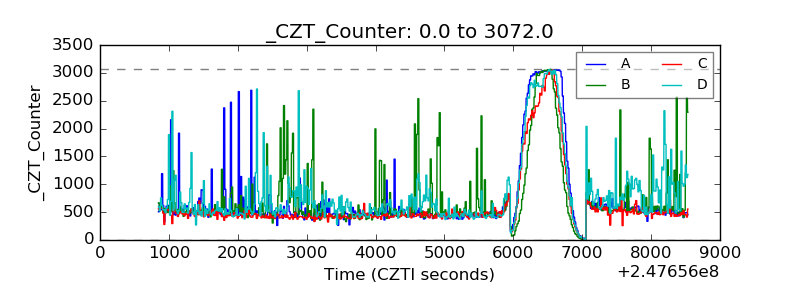 |
| +2.5 Volts monitor |  |
| +5 Volts monitor |  |
| _ROLL_ROT | 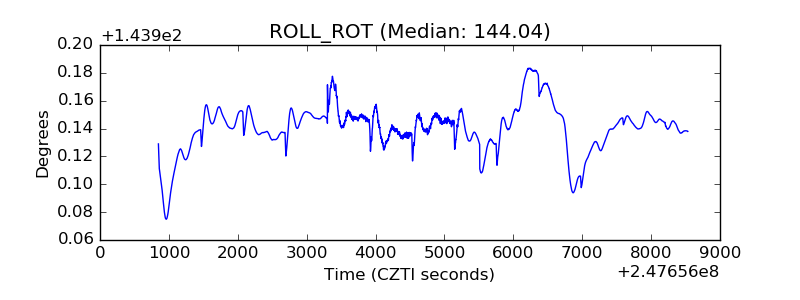 |
| _Roll_DEC | 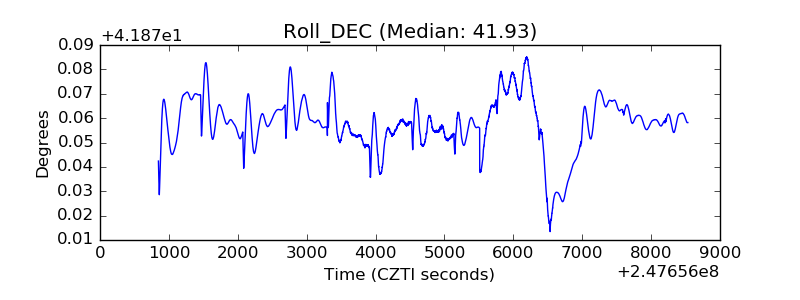 |
| _Roll_RA | 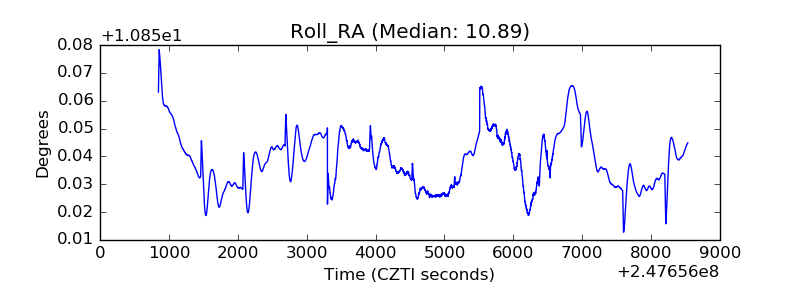 |
| Veto Counter | 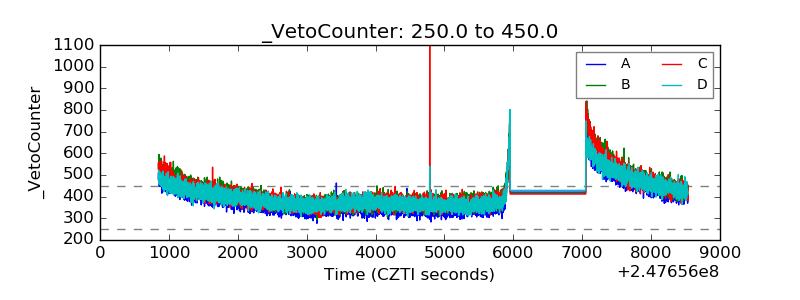 |