| Param | Original file | Final file |
|---|---|---|
| Filename | modeM0/AS1A04_022T04_9000001666_11404cztM0_level2.evt | modeM0/AS1A04_022T04_9000001666_11404cztM0_level2_quad_clean.evt |
| Size (bytes) | 469,166,400 | 105,632,640 |
| Size | 447.4 MB | 100.7 MB |
| Events in quadrant A | 3,086,084 | 700,289 |
| Events in quadrant B | 3,881,777 | 684,706 |
| Events in quadrant C | 2,846,134 | 734,199 |
| Events in quadrant D | 4,003,312 | 676,868 |
| Mode M9 | |||
|---|---|---|---|
| Quadrant | BADHDUFLAG | Total packets | Discarded packets |
| A | 0 | 13 | 0 |
| B | 0 | 13 | 0 |
| C | 0 | 13 | 0 |
| D | 0 | 13 | 0 |
| Mode SS | |||
|---|---|---|---|
| Quadrant | BADHDUFLAG | Total packets | Discarded packets |
| A | 0 | 116 | 0 |
| B | 0 | 116 | 0 |
| C | 0 | 116 | 0 |
| D | 0 | 116 | 0 |
| Mode M0 | |||
|---|---|---|---|
| Quadrant | BADHDUFLAG | Total packets | Discarded packets |
| A | 0 | 12922 | 2 |
| B | 0 | 15283 | 1 |
| C | 0 | 12102 | 1 |
| D | 0 | 15700 | 1 |
| Quadrant | Total seconds | Saturated seconds | Saturation percentage |
|---|---|---|---|
| A | 5770 | 96 | 1.663778% |
| B | 5770 | 338 | 5.857886% |
| C | 5770 | 62 | 1.074523% |
| D | 5770 | 223 | 3.864818% |
Noise dominated data is calculated using 1-second bins in cleaned event files. If a bin has >2000 counts, and if more than 50% of those come from <1% of pixels, then it is considered to be noise-dominated and hence unusable.
| Quadrant | # 1 sec bins | Bins with >0 counts | Bins with >2000 counts | High rate bins dominated by noise | Noise dominated (total time) | Noise dominated (detector-on time) | Marked lightcurve |
|---|---|---|---|---|---|---|---|
| A | 7020 | 5771 | 5 | 5 | 0.07% | 0.09% |  |
| B | 7020 | 5771 | 162 | 162 | 2.31% | 2.81% |  |
| C | 7020 | 5771 | 0 | 0 | 0.00% | 0.00% | 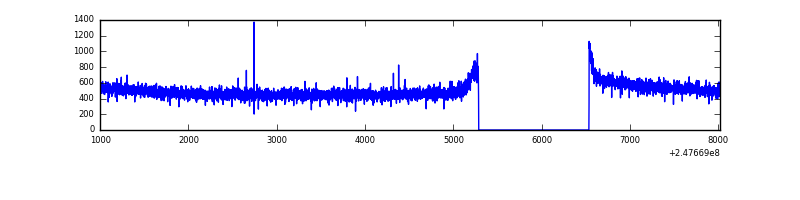 |
| D | 7020 | 5771 | 126 | 126 | 1.79% | 2.18% | 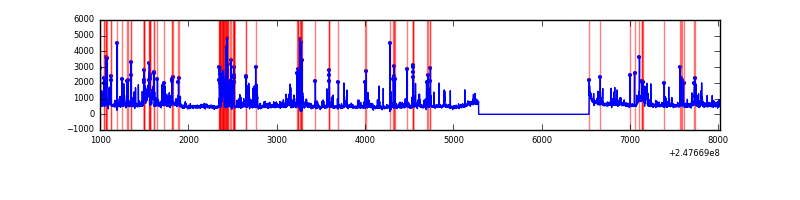 |
Top three noisy pixels from each quadrant. If the there are fewer than three noisy pixels in the level2.evt file, extra rows are filled as -1
| Pixel properties | Quadrant properties | ||||||
|---|---|---|---|---|---|---|---|
| Quadrant | DetID | PixID | Counts | Sigma | Mean | Median | Sigma |
| A | 8 | 5 | 179940 | 1204.95 | 741 | 725 | 148.7 |
| A | 1 | 162 | 20254 | 131.3 | 741 | 725 | 148.7 |
| A | 1 | 178 | 11129 | 69.95 | 741 | 725 | 148.7 |
| B | 4 | 239 | 940272 | 6913.14 | 720 | 703 | 135.9 |
| B | 3 | 189 | 78149 | 569.83 | 720 | 703 | 135.9 |
| B | 15 | 204 | 35513 | 256.12 | 720 | 703 | 135.9 |
| C | 13 | 61 | 5377 | 27.47 | 730 | 736 | 169.0 |
| C | 3 | 202 | 1827 | 6.46 | 730 | 736 | 169.0 |
| C | -1 | -1 | -1 | -1.0 | 730 | 736 | 169.0 |
| D | 1 | 52 | 666004 | 3876.2 | 722 | 705 | 171.6 |
| D | 10 | 253 | 173230 | 1005.18 | 722 | 705 | 171.6 |
| D | 2 | 120 | 131682 | 763.11 | 722 | 705 | 171.6 |
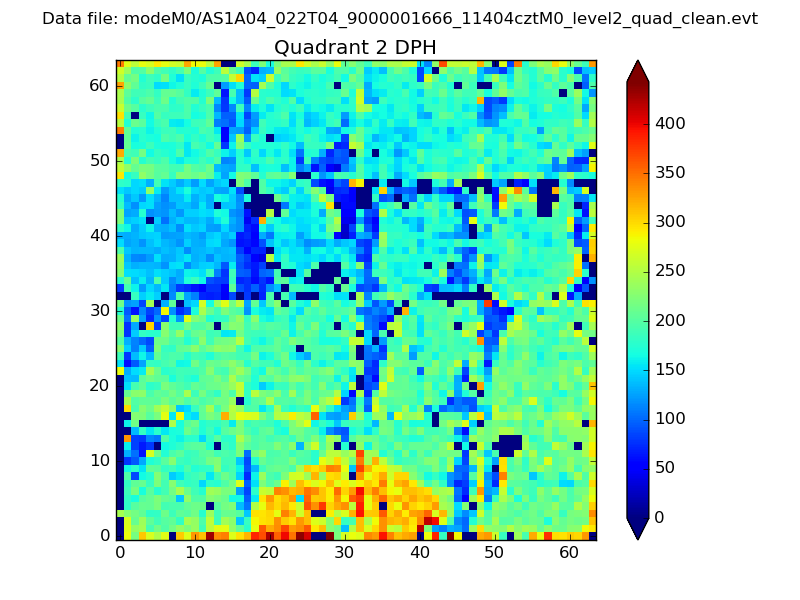
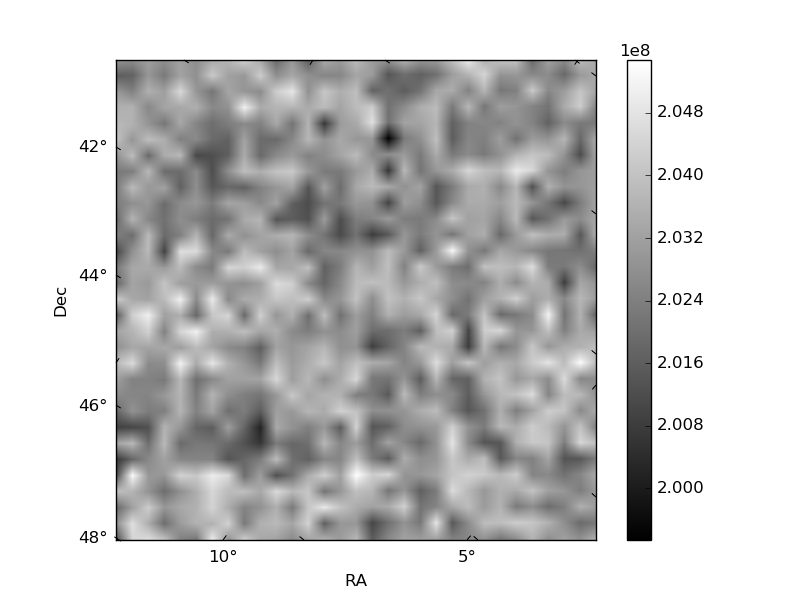
Histogram calculated using DETX and DETY for each event in the final _common_clean file
| Quadrant A | 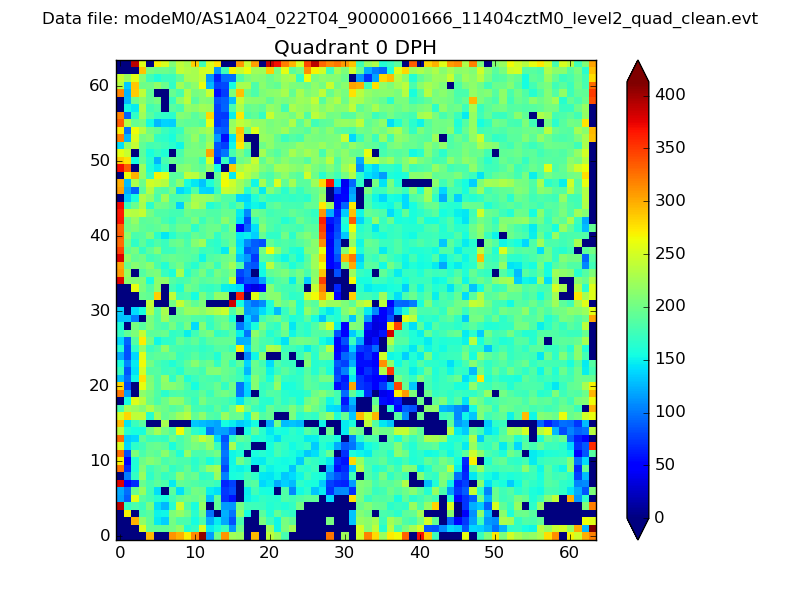 |
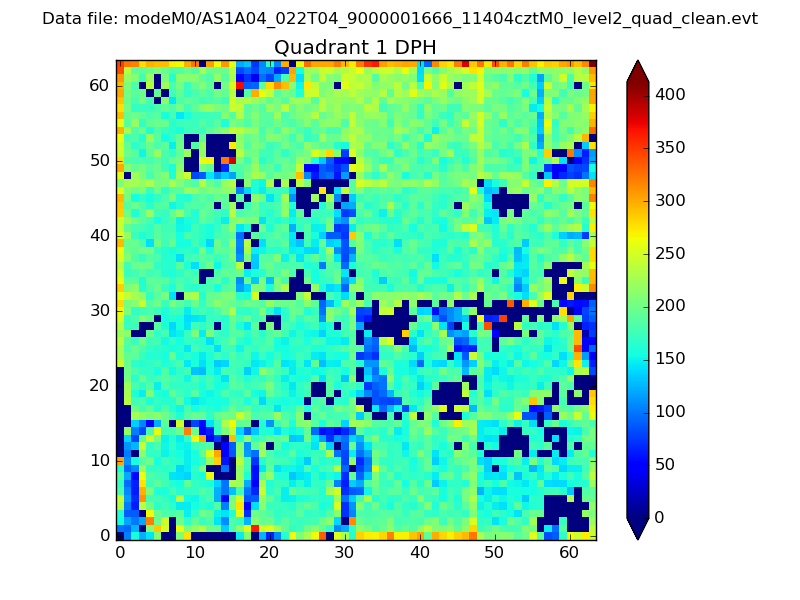 |
Quadrant B |
|---|---|---|---|
| Quadrant D | 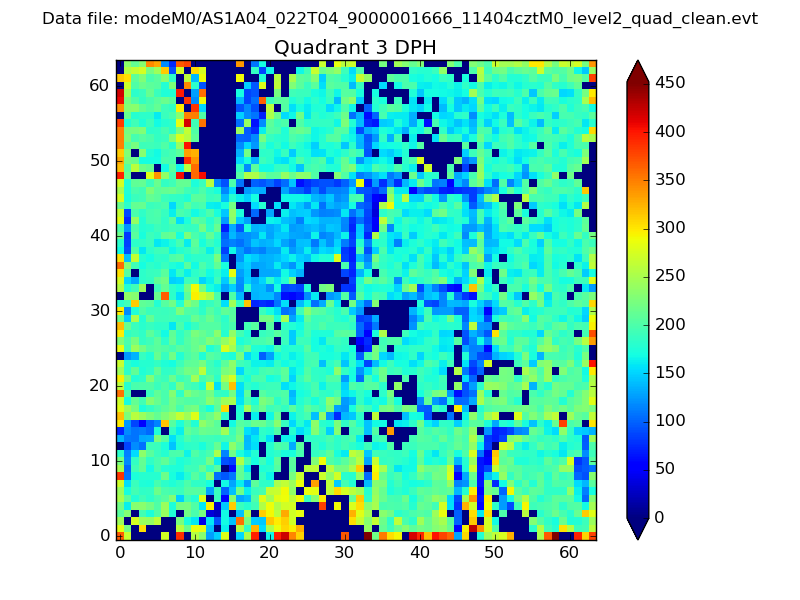 |
 |
Quadrant C |
| Plot type | Count rate plots | Images |
|---|---|---|
| Comparison with Poisson distribution Blue bars denote a histogram of data divided into 1 sec bins. Red curve is a Poisson curve with rate = median count rate of data. |
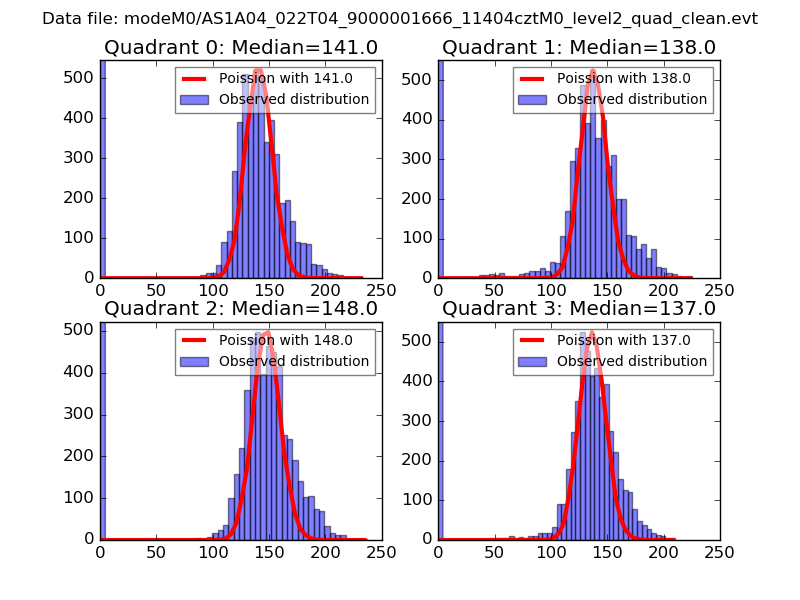 |
 |
| Quadrant-wise count rates Data is divided into 100 sec bins |
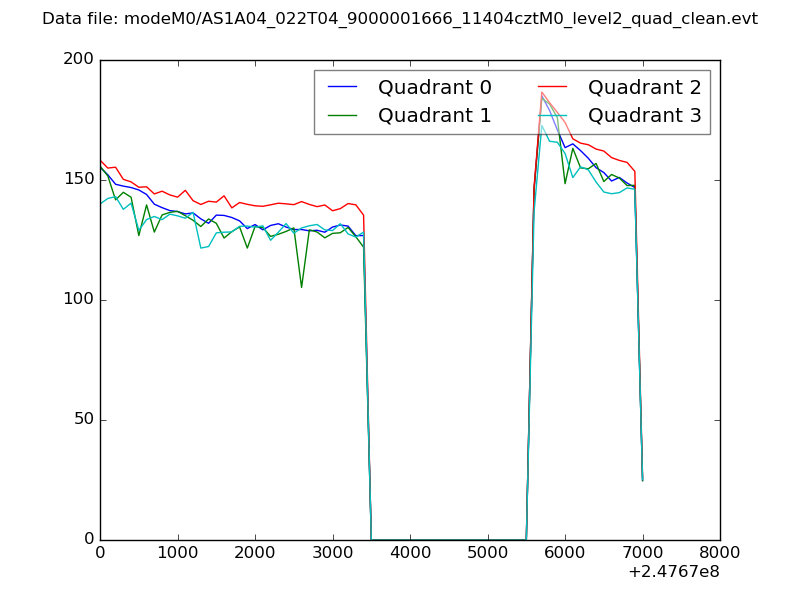 |
|
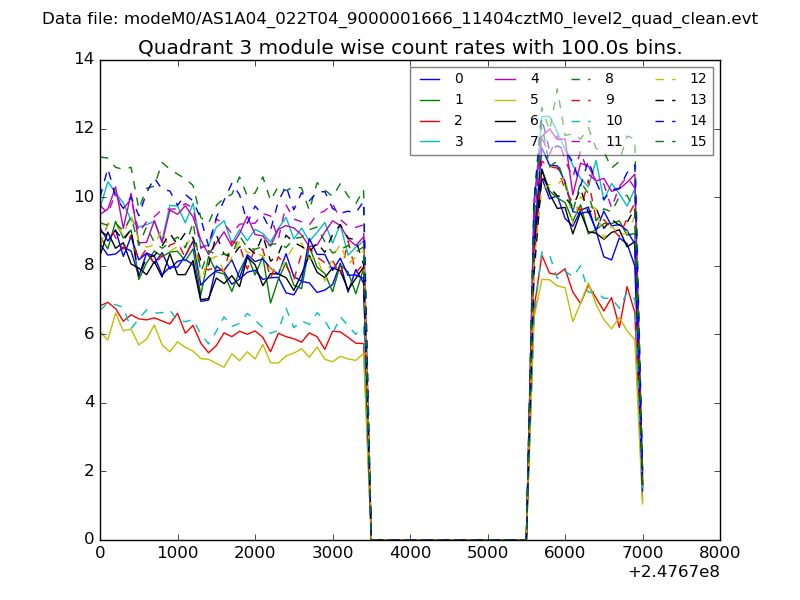
| Module-wise count rates for Quadrant A Data is divided into 100 sec bins |
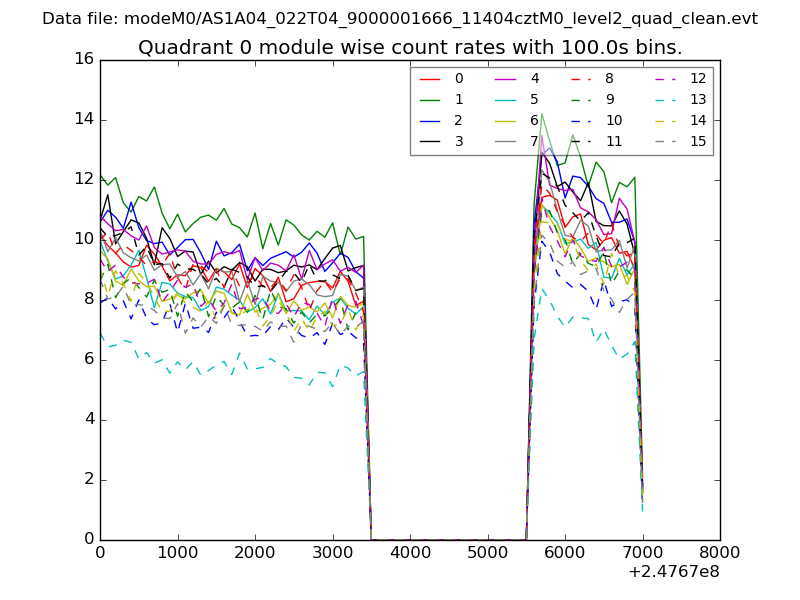 |
 |
| Module-wise count rates for Quadrant B Data is divided into 100 sec bins |
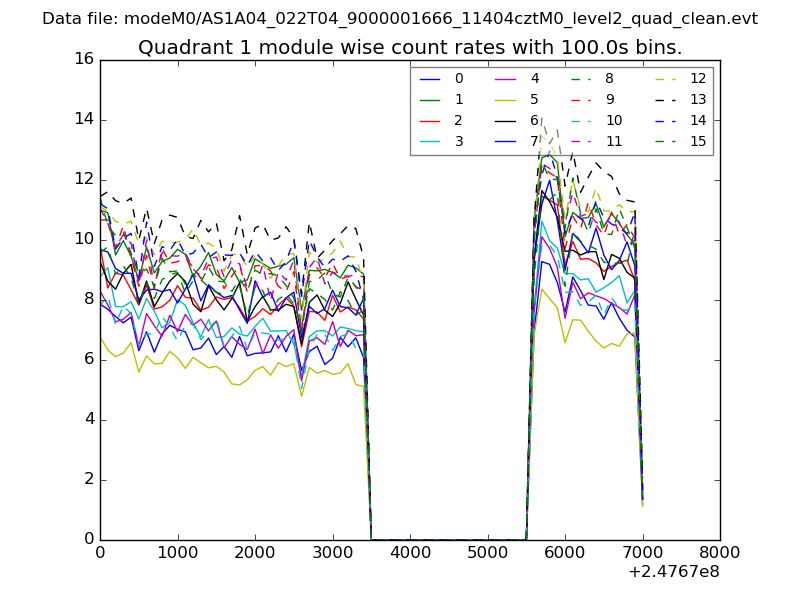 |
 |
| Module-wise count rates for Quadrant C Data is divided into 100 sec bins |
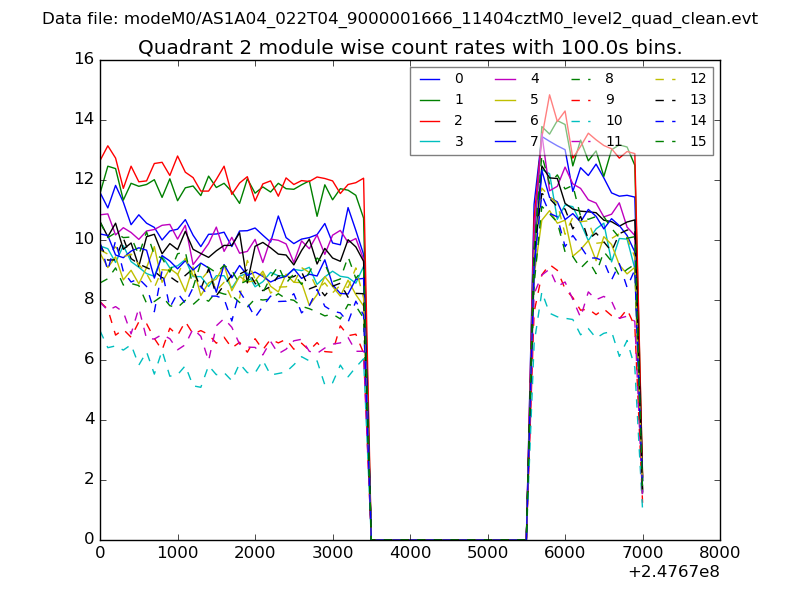 |
 |
| Module-wise count rates for Quadrant D Data is divided into 100 sec bins |
 |
 |
| Parameter | Plot |
|---|---|
| CZT HV Monitor | 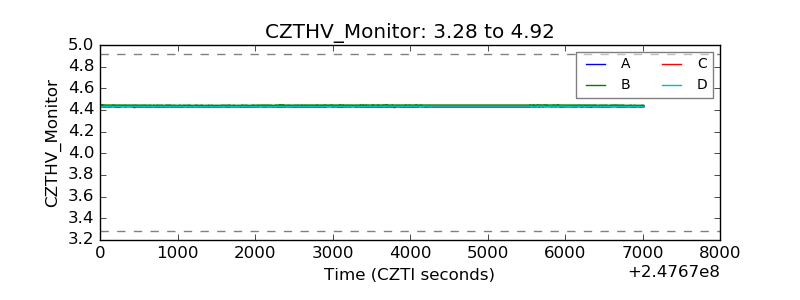 |
| D_VDD | 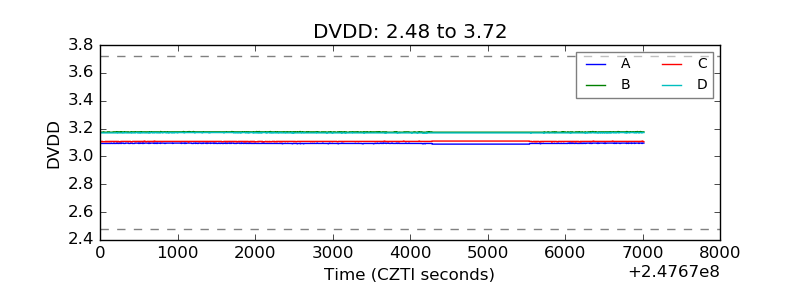 |
| Temperature 1 | 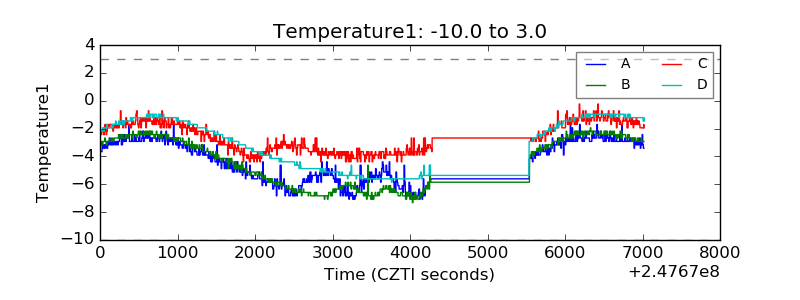 |
| Veto HV Monitor | 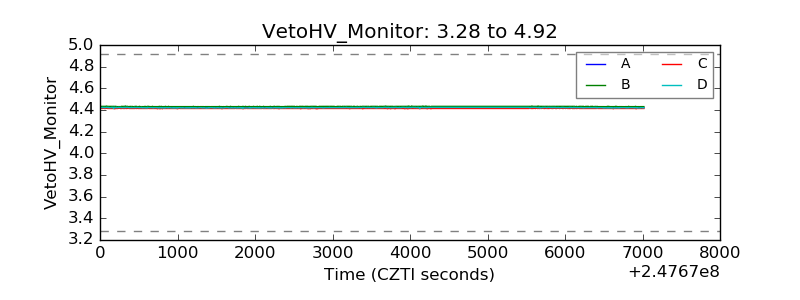 |
| Veto LLD | 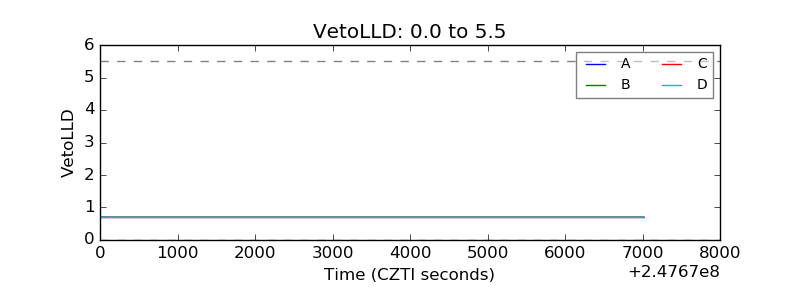 |
| Alpha Counter | 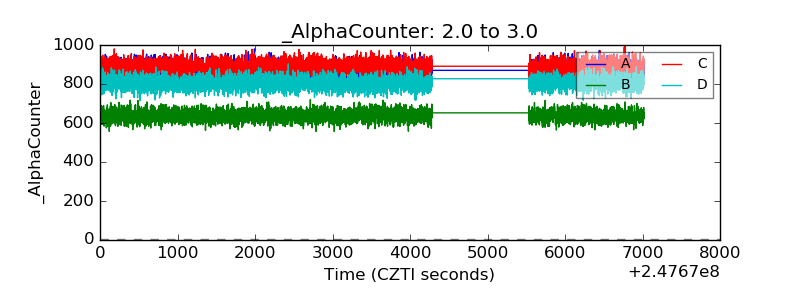 |
| _CPM_Rate | 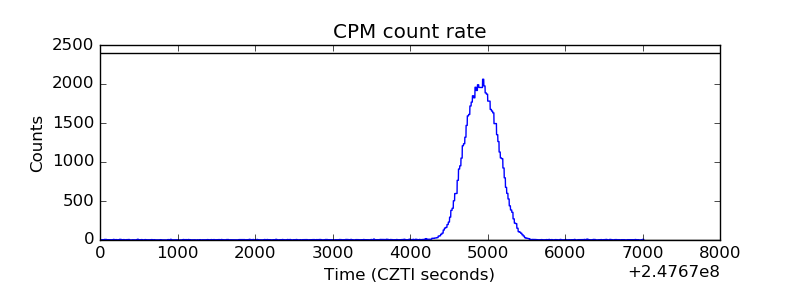 |
| CZT Counter | 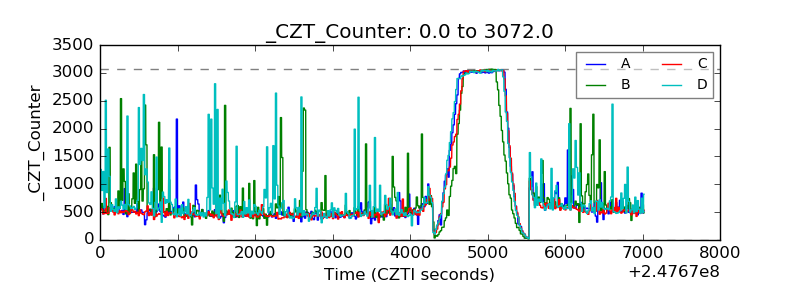 |
| +2.5 Volts monitor |  |
| +5 Volts monitor | 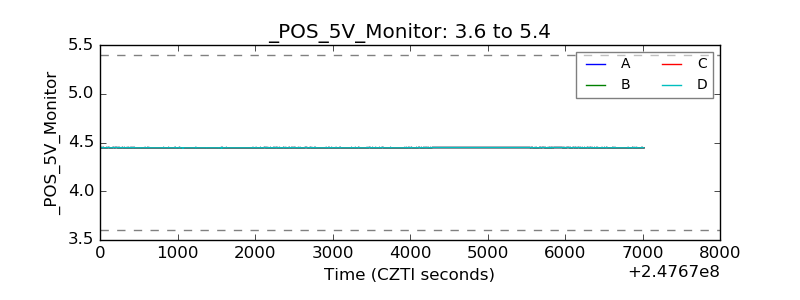 |
| _ROLL_ROT | 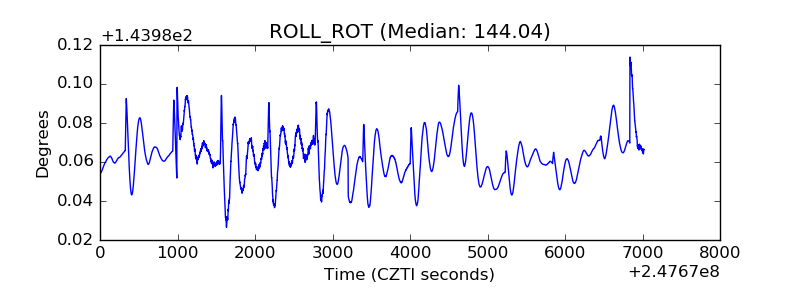 |
| _Roll_DEC | 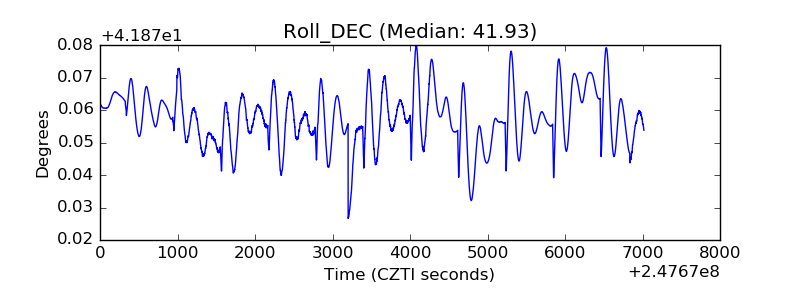 |
| _Roll_RA | 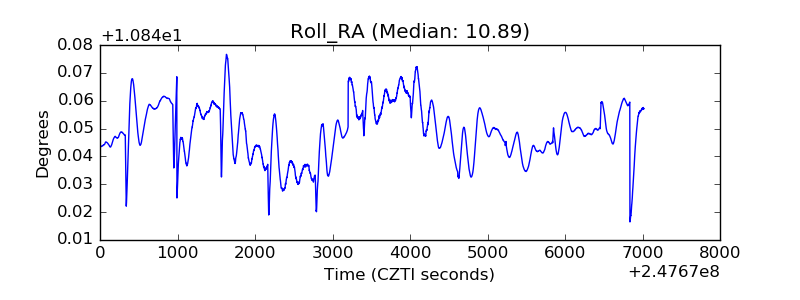 |
| Veto Counter | 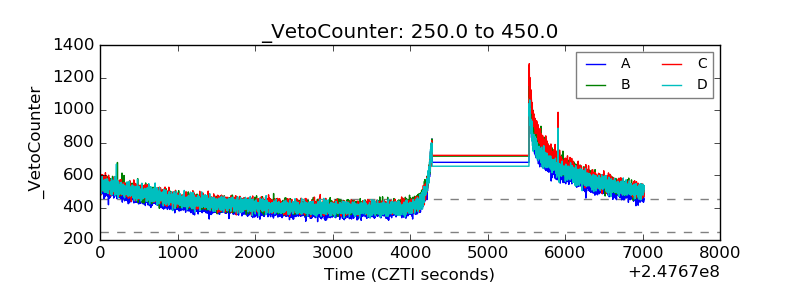 |